Gold’s powerful rally has paused – but not in isolation. As geopolitical tensions escalate and energy markets take centre stage, the macro landscape is shifting in ways that temporarily sideline precious metals. The recent oil price surge, driven by conflict in the Middle East and structural stress in the global energy system, is now dictating market sentiment, liquidity flows, and inflation expectations. In this environment, gold finds itself caught between long-term structural strength and short-term tactical pressure – correcting after an overheated advance while competing with oil for leadership in an increasingly fragmented and unstable world.
1. Review – Gold Corrects While Oil Takes the Lead
After reaching a new all-time high of USD 5,602 on 29th January, the gold price has now been in a corrective phase for over three months. So far, this phase has been characterised by two sharp downward waves, two recovery waves, and most recently another decline since mid-April.
With the lower high at USD 5,419 on 2nd March and the lower low at USD 4,099 on 23rd March, a clear downtrend has been established. Most recently, on 17th April, gold failed exactly at its 50-day moving average (USD 4,873) and has since entered a third downward wave, reaching USD 4,501 so far. Selling pressure initially increased noticeably over the course of the last week. Shortly before the Fed’s interest rate decision, however, gold found a bottom at USD 4,510 and has since been attempting a recovery but ultimately has failed to break out from the short-term downtrend. Gold needs a weekly close above USD 4,600 to improve the picture.
1.1 Oil Takes the Lead
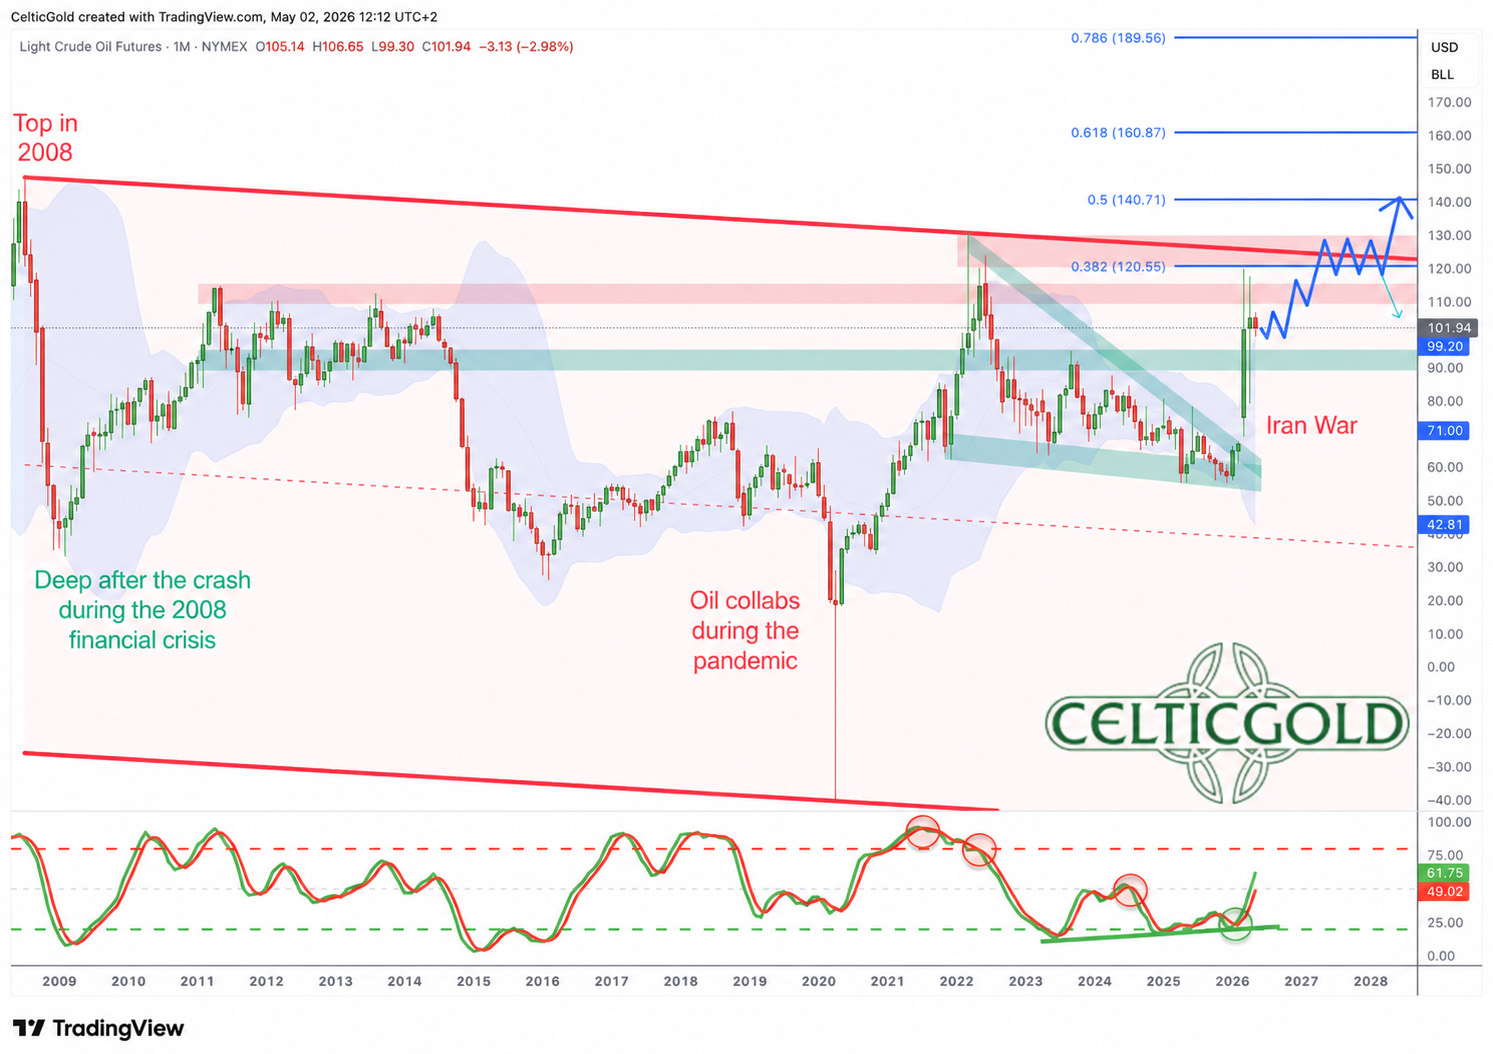
Oil in USD, monthly chart as of 2nd May 2026. Source: Tradingview
At the same time, oil has taken over market leadership following the US-Israeli attack on Iran. With high volatility and a clear breakout from a falling wedge pattern, it is now shaping both sentiment and price action across global financial markets. As long as peace negotiations fail to produce meaningful progress and the Strait of Hormuz remains blocked, oil price developments are likely to remain the dominant market driver.
From a technical perspective, oil has been in a broad bear market since July 2008. The recent geopolitical escalation triggered a breakout from a three-and-a-half-year consolidation wedge, pushing prices directly toward the 0.382 trend extension of the prior recovery move following the pandemic-induced crash in spring 2020.
The monthly stochastic oscillator is on a clear buy signal and still has significant upside potential before reaching overbought territory. On top, there is currently no sign of euphoria or excess in the oil sector. Although the strong rally since late February may require some further consolidation, the technical picture still favours a continuation higher. The next target lies near the upper boundary of the long-term downtrend channel between USD 120 and 125, followed by another extension near USD 140.
1.2 Gold Remains Under Pressure
As anticipated, precious metals have not been able to escape this shift in leadership. Over the past two months, compared to other sectors they have come under stronger downward pressure, mainly because they entered the Iran crisis in a significantly overbought condition after their historic rally.
A persistently strong US dollar is also weighing on gold and intensifying short-term selling pressure. Technically, the outlook remains fragile for now. After several consecutive sell-offs, a tentative bullish signal had begun to emerge since last Wednesday but has been negated already. Hence, there is currently no technical justification to significantly increase gold’s strategic weighting in asset allocation. Patience is likely required until summer.
2. Chart Analysis – Gold in US-Dollars
2.1 Weekly Chart: Correction Not Yet Complete
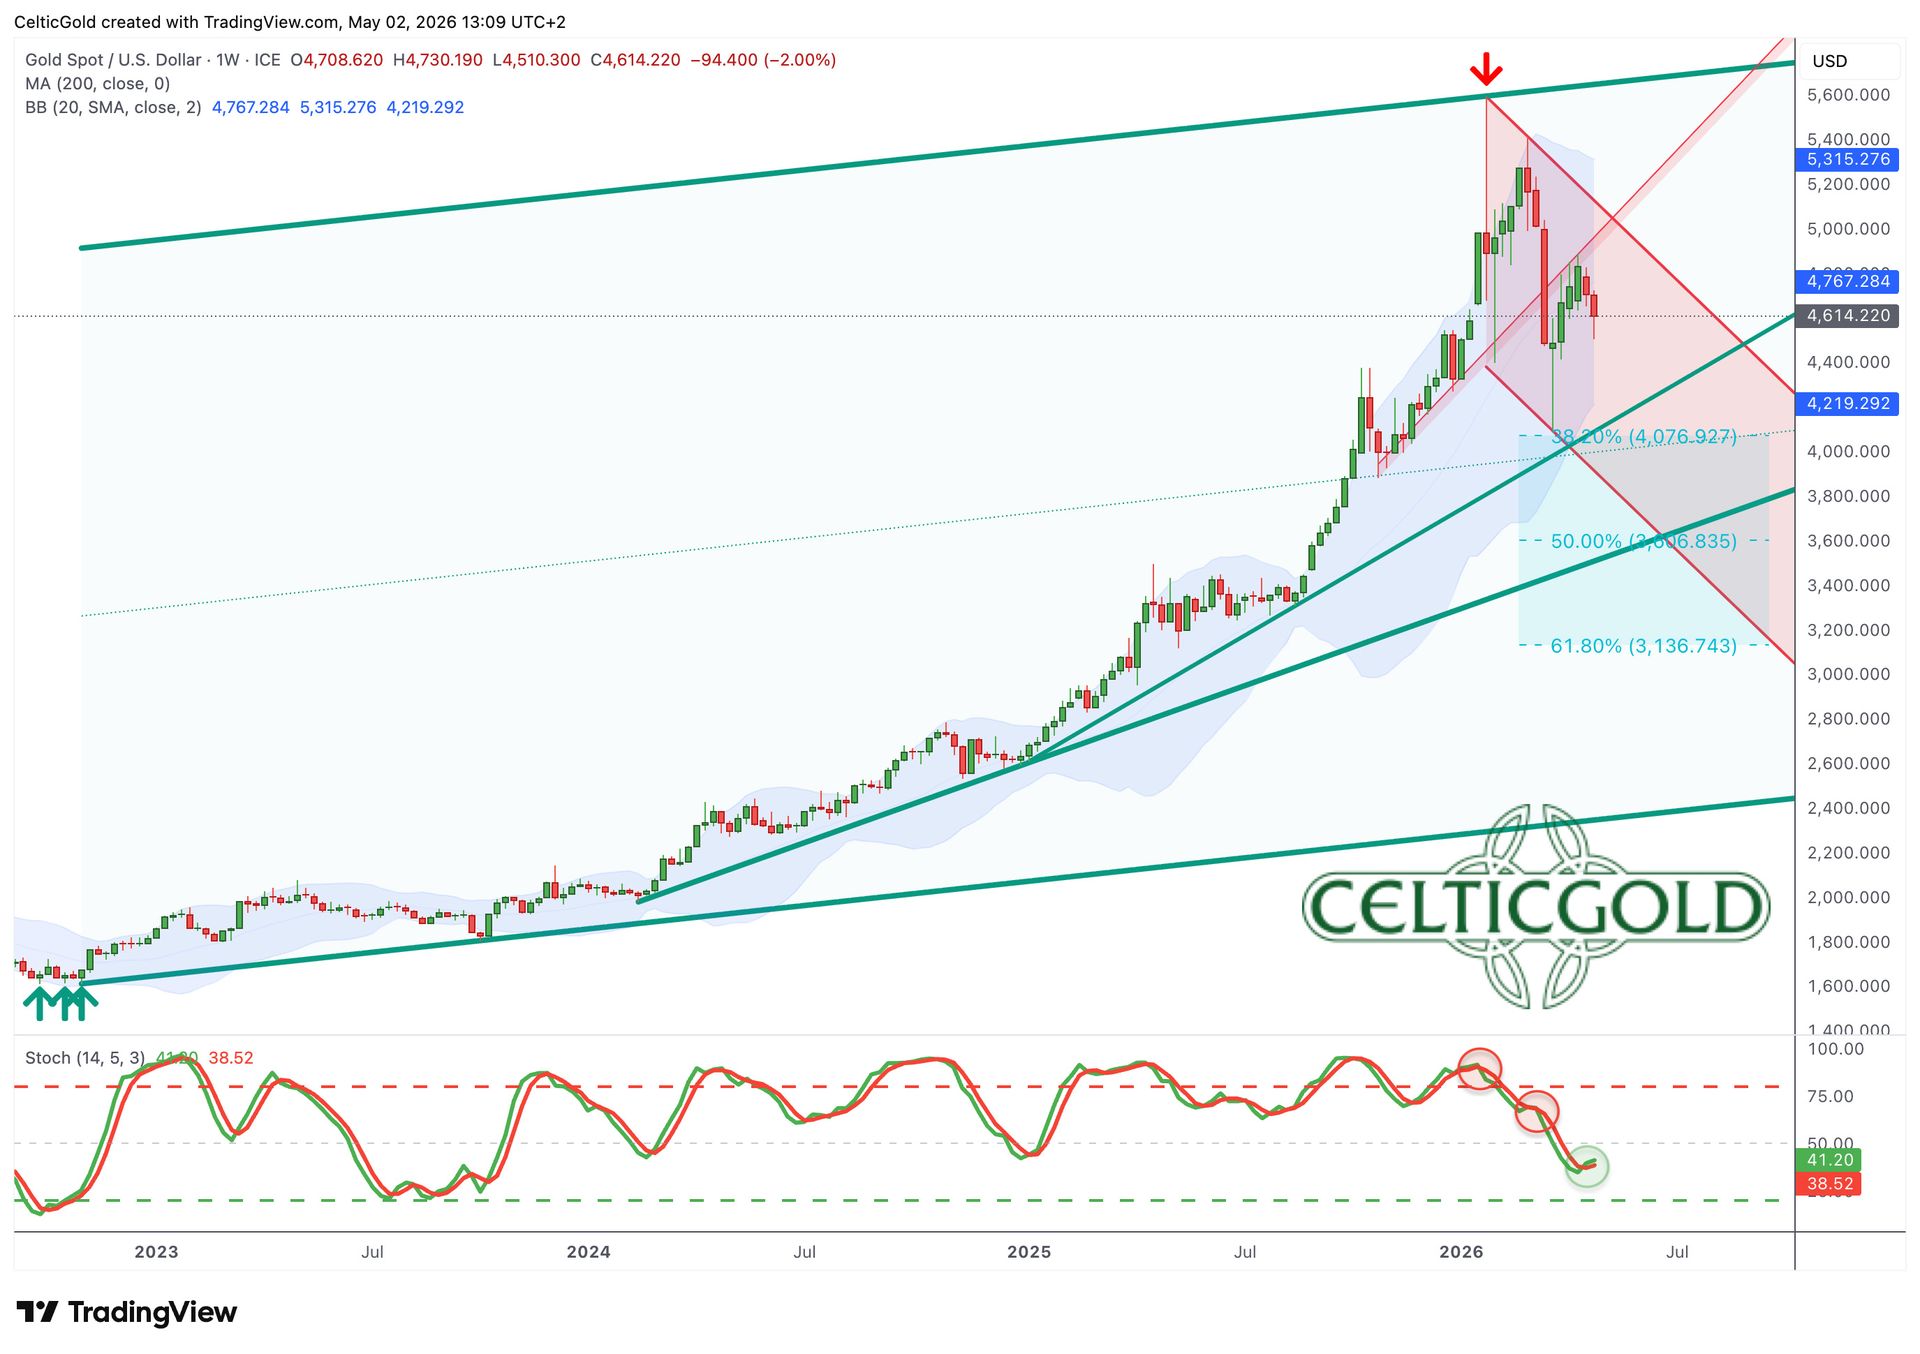
Gold in US-Dollar, weekly chart as of 2nd May 2026. Source: Tradingview
Starting from the prominent triple bottom at USD 1,615 in autumn 2022, gold surged nearly 250% to USD 5,602 by January 2026. Since then, a correction has unfolded, bringing prices down in two sharp waves to a low of USD 4,099—almost exactly the 38.2% retracement of the preceding three-and-a-half-year uptrend.
However, it is doubtful that this healthy and necessary correction is already complete. A rally of 250% over three and a half years is unlikely to be fully digested within just two months via a minimal retracement. Rather, further correction seems likely in terms of time, while on the price axis two strong support zones appear robust into summer: roughly USD 4,100–4,400 and USD 3,500–3,750.
The weekly stochastic oscillator is beginning to turn upward but has not yet reached oversold territory, suggesting the correction may still extend in a complex manner.
Overall, the weekly chart remains slightly bearish. With Bollinger Bands moving sideways (currently at USD 5,315 and USD 4,219), gold would ideally need to break out of the three-month downtrend to improve the outlook for a time-based consolidation. This would likely require a move above USD 5,000 by summer.
If, however, this week’s low at USD 4,500 is clearly broken, the decline could extend toward USD 4,250–4,350, with any summer rally starting from significantly lower levels.
2.2 Daily Chart: Gold Caught Between Key Moving Averages
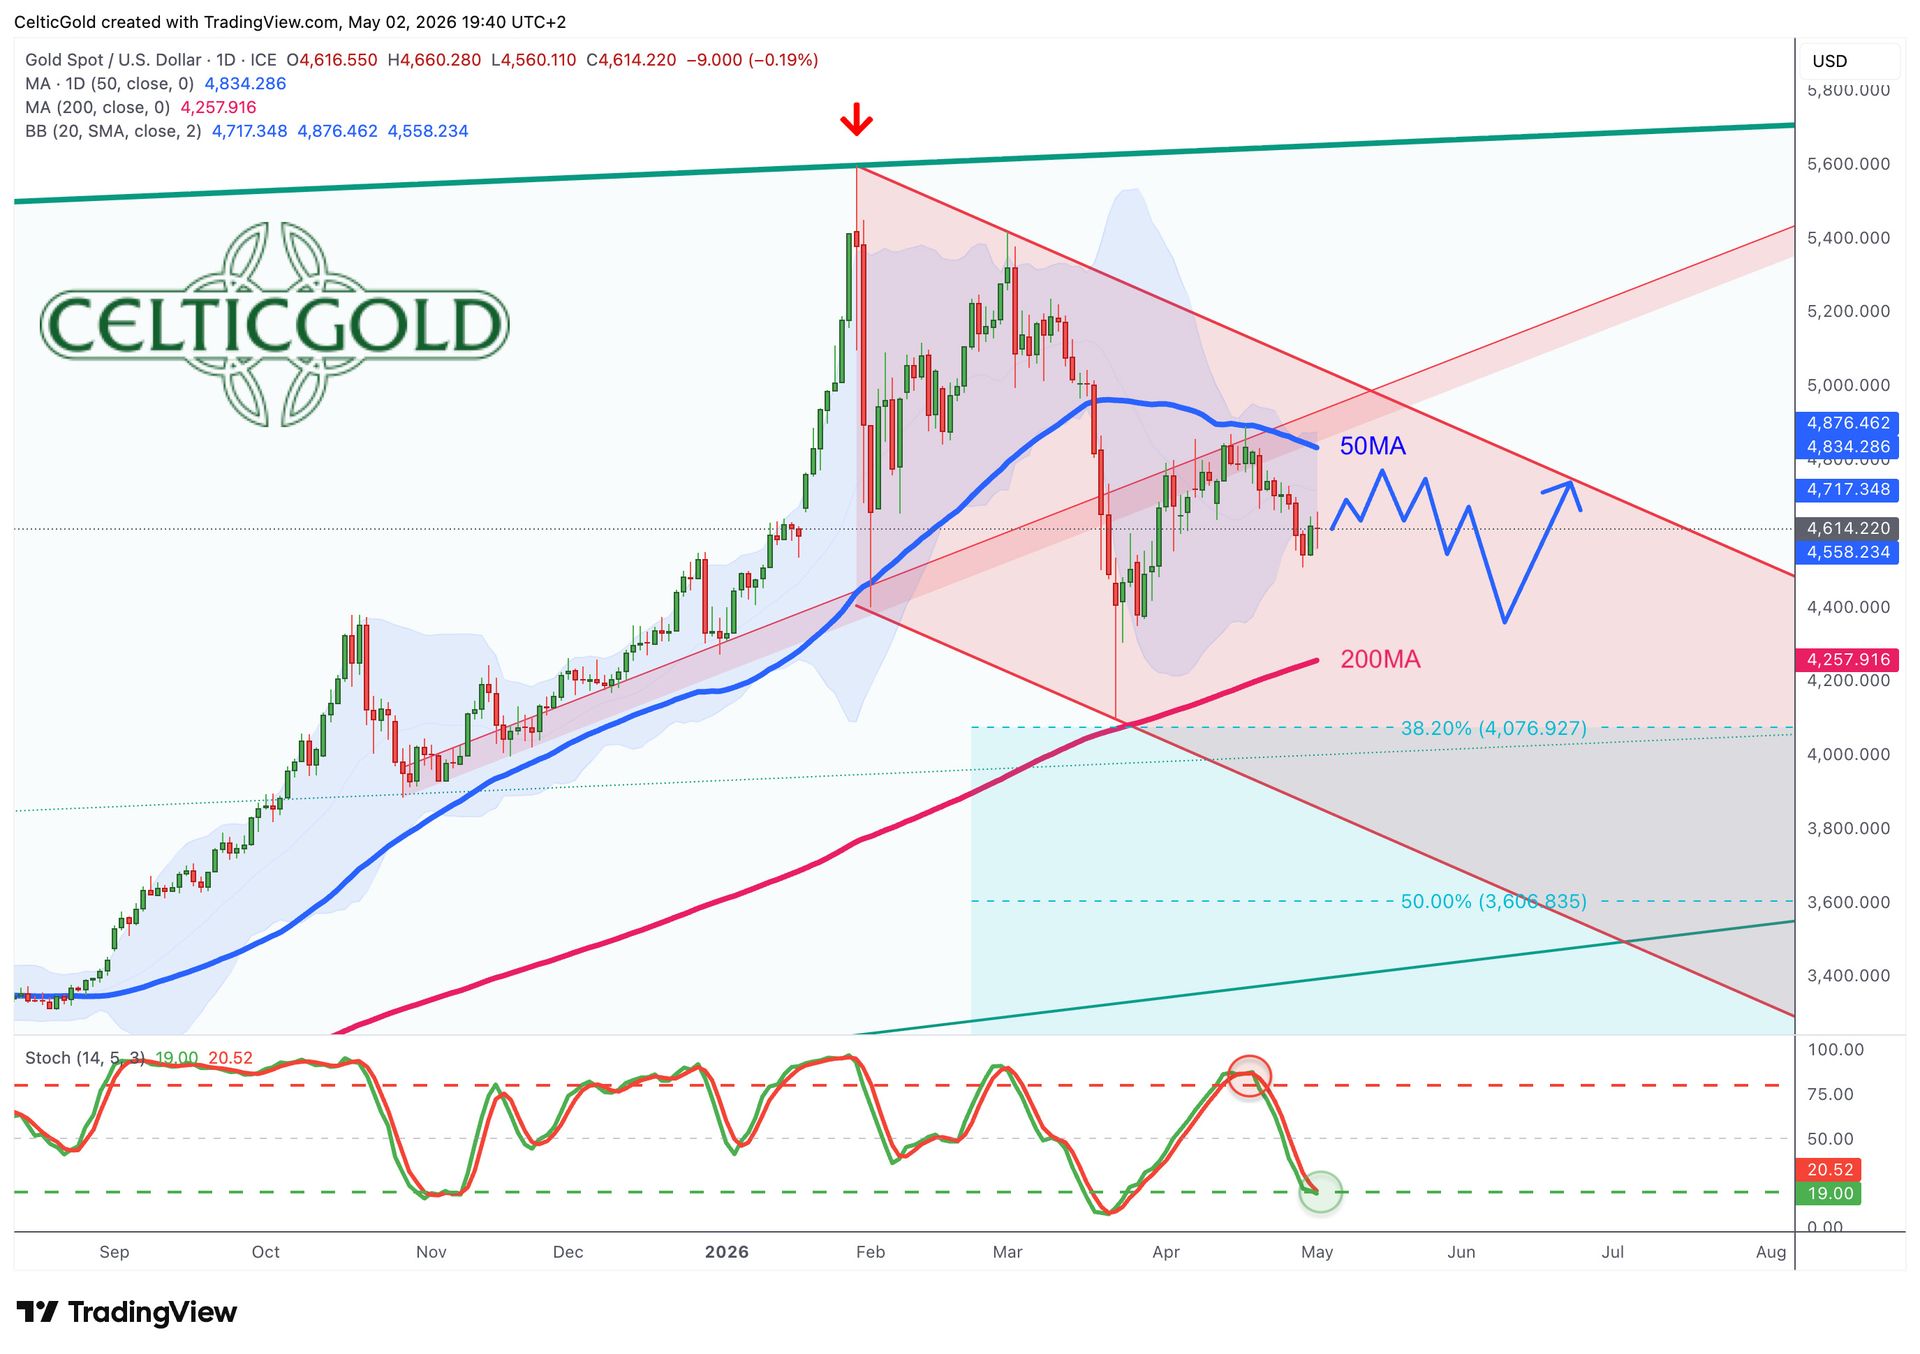
Gold in US-Dollar, daily chart as of 2nd May 2026. Source: Tradingview
On the daily chart, gold has been in a downtrend since late January. The failure at the now declining 50-day moving average (currently USD 4,834) is particularly significant. For bulls, reclaiming this widely watched level will be more difficult on the next attempt. Another failure would further deteriorate the overall picture.
At the same time, the first test of the 200-day moving average (currently USD 4,257) has not been convincing. A second test of this more important level would be typical and even desirable from a technical standpoint. Since the 200-day average is rising quickly, a retest does not necessarily require a break below the March low at USD 4,099.
2.3 Sideways Scenario
In a sideways correction scenario, gold is likely to remain trapped between the declining 50-day and rising 200-day averages into the summer, moving erratically within this range. Meanwhile, the Bollinger Bands (currently USD 4,558 and USD 4,834) are narrowing, further limiting short-term price movement.
Last week, bears briefly pushed prices below the lower Bollinger Band, but bulls managed to recover by the weekly close. Still, this is not ideal, as sideways patterns lose stability when lower bands are breached significantly.
In summary, the oversold daily chart is approaching a critical decision point. After falling from USD 4,890 on 17th April to USD 4,500, the oversold condition should trigger a recovery—ideally back above the 50-day average. Only then could a base-building process be confirmed, paving the way for a summer rally towards and above USD 5,000.
If bears instead capitalise on underlying weakness, gold remains vulnerable. In that more likely case, rebounds would probably fail at the 50-day average, while the rising 200-day average in the USD 4,300–4,000 range becomes the next downside target.
3. Commitments of Traders for Gold
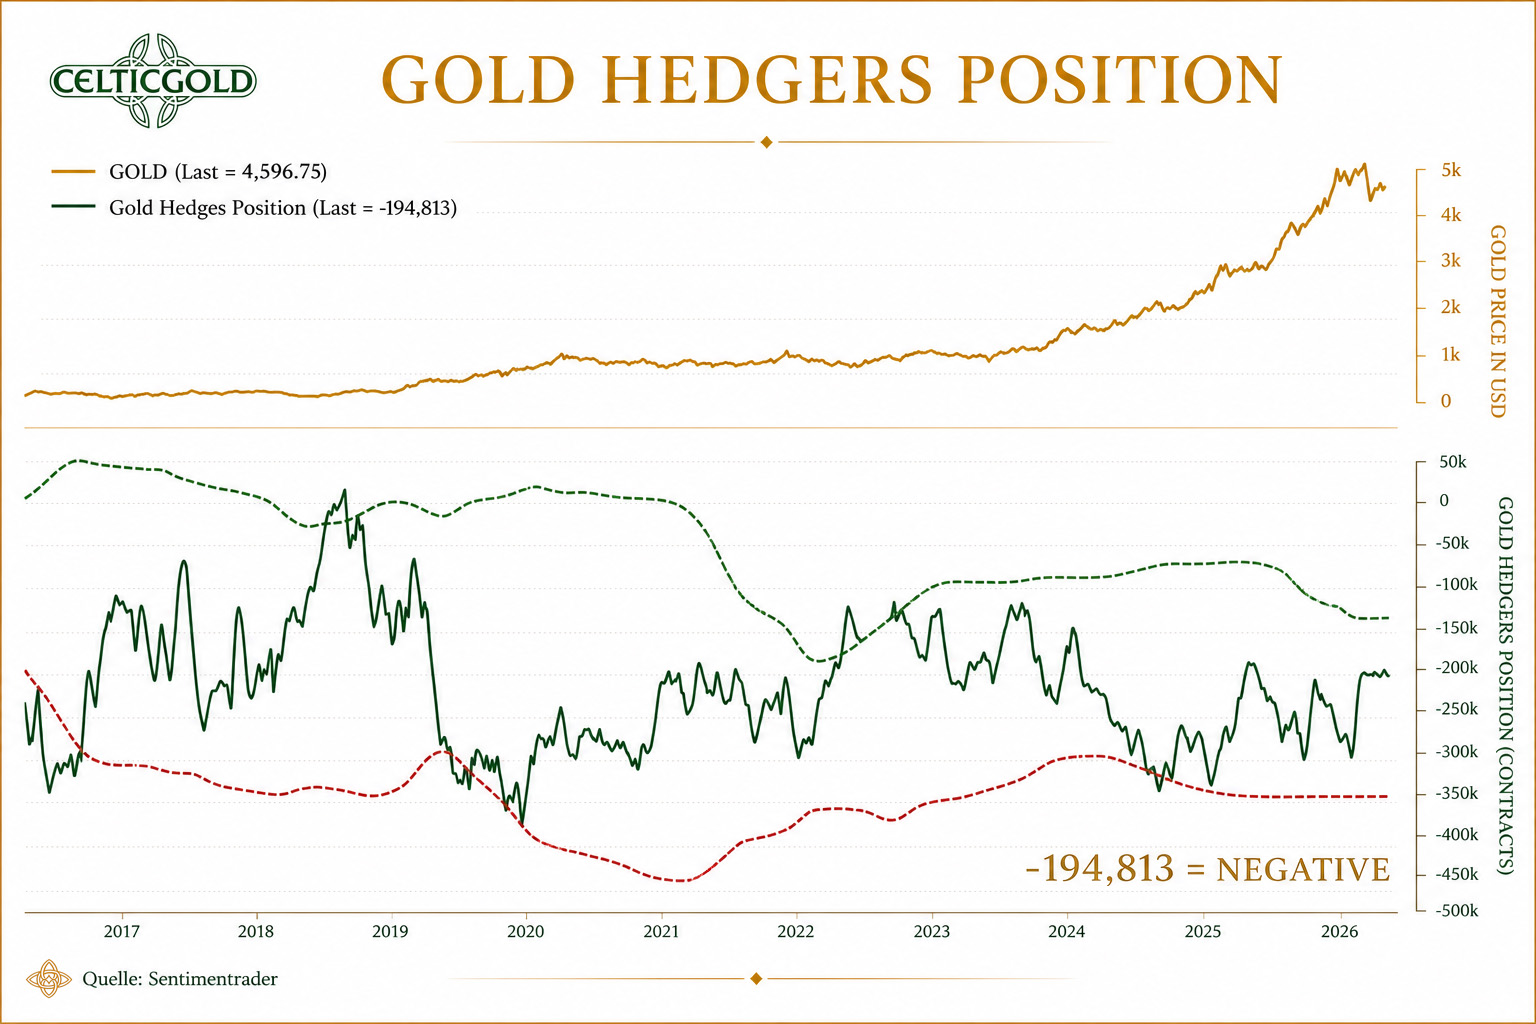
Commitments of Traders Report for gold futures as of 2nd May 2026. Source: Sentimenttrader
According to the weekly Commitments of Traders (COT) report from the CFTC, commercial traders held a cumulative short position of 194,813 gold futures contracts at a closing price of USD 4,596. The midweek decline likely improved this somewhat, but the commercial short position remains elevated in a long-term context.
Historically, strong contrarian buying opportunities have typically emerged only when short positions fall below 100,000 contracts. However, sentiment could begin to turn slightly positive around 150,000 contracts.
Overall, based on the past 22 years, the COT report still leans negative.
4. Sentiment for Gold – Neutral
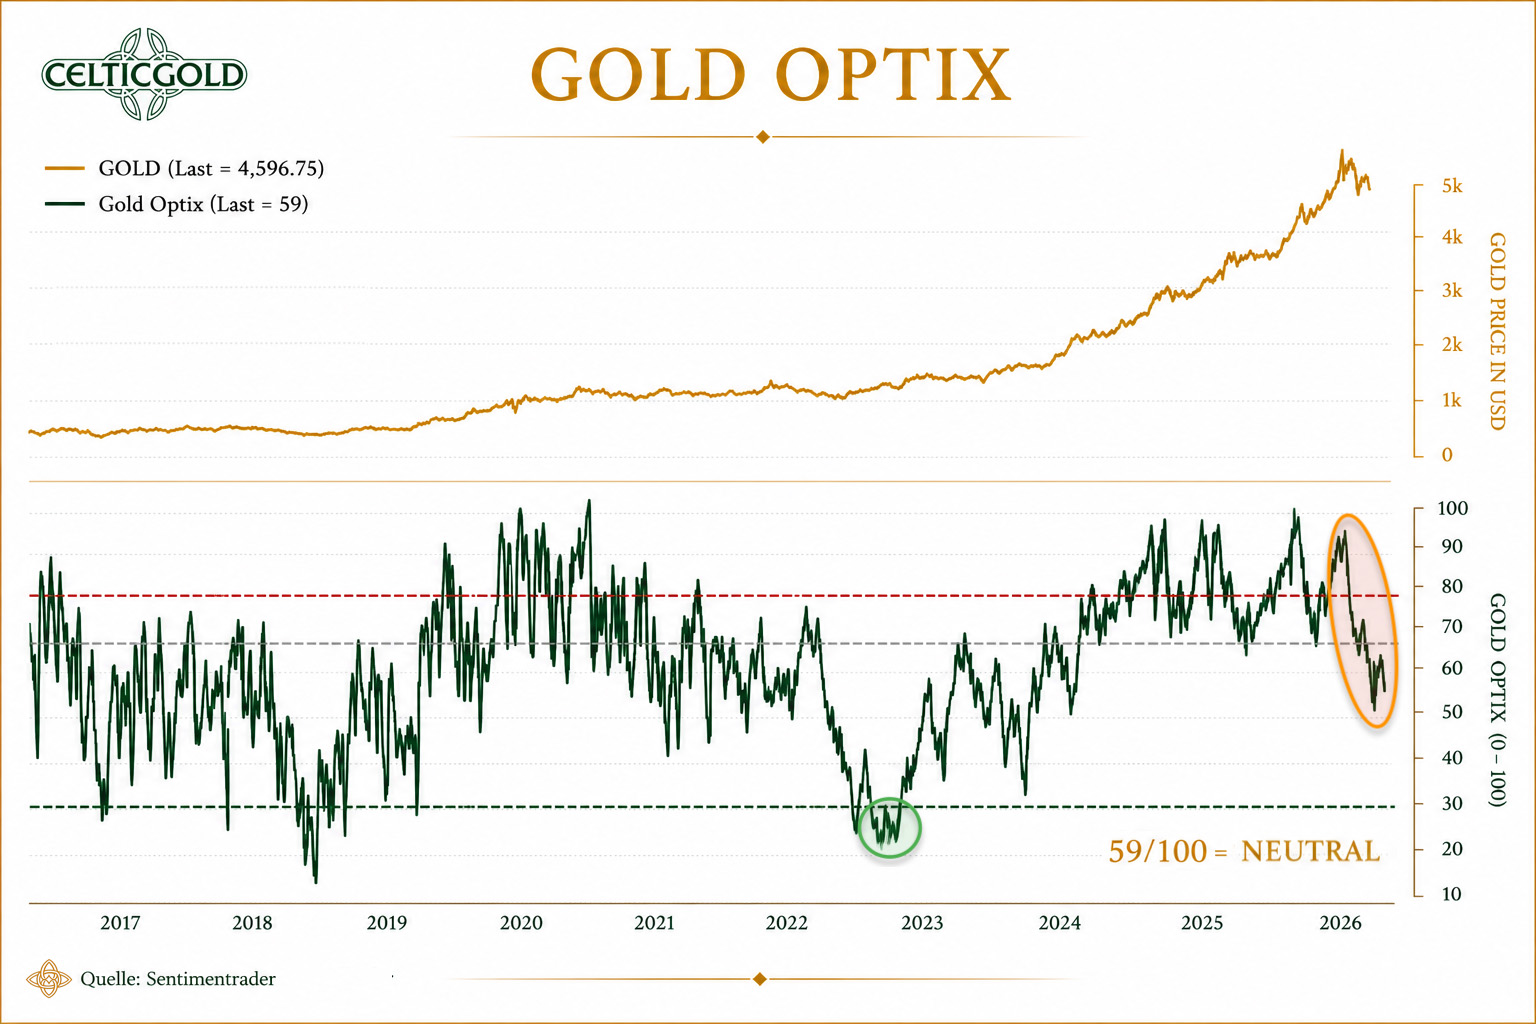
Sentiment Optix for gold as of 29th April 2026. Source: Sentimentrader
Following the all-time high at USD 5,602, market sentiment has clearly shifted. The Optix sentiment index indicates that the long phase of euphoria ended with the peak. In a worst-case scenario, sentiment could now swing to the opposite extreme—fear and panic. Alternatively, sentiment may simply continue to normalise without a dramatic washout.
At an Optix reading of 59, sentiment remains neutral. Ideally, it should turn higher again above the 50–55 range. Otherwise, the risk of an extended correction increases.
5. Seasonality for Gold – Negative until June
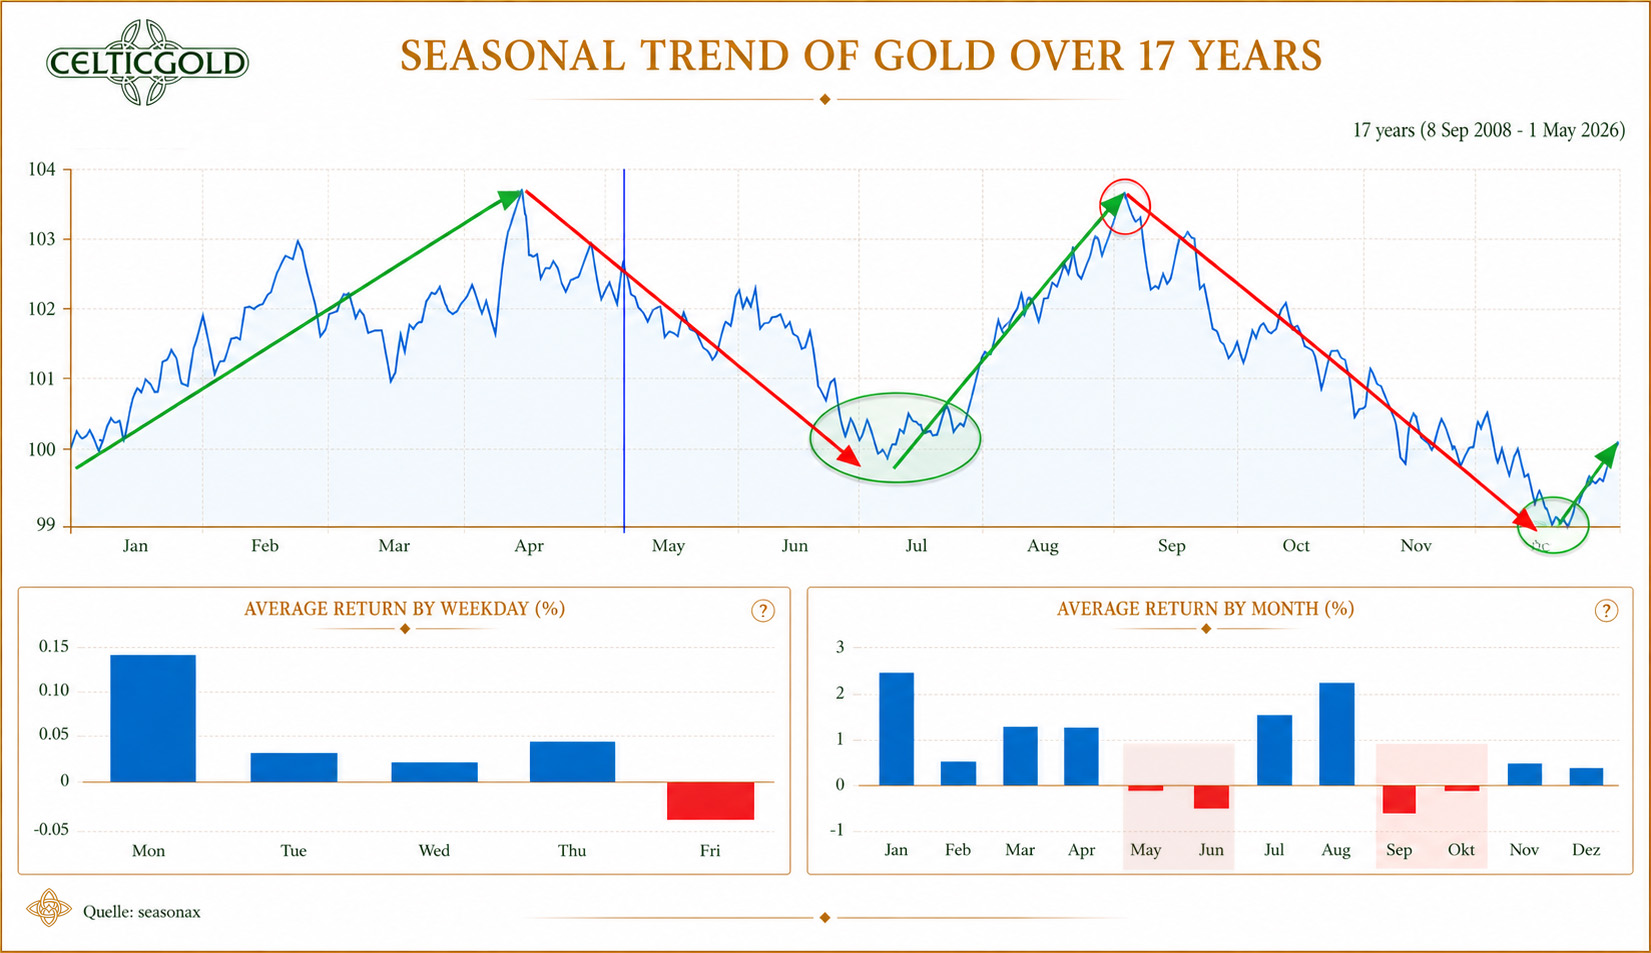
Seasonality for gold over the last 17-years as of 30th April 2025. Source: Seasonax
Seasonally, gold tends to be weak through June. The expected recovery rally carried prices higher into April, as forecast. With seasonal support now fading, the coming weeks are more likely to bring lower prices and a continuation of the correction, despite interim rebounds.
Typically, gold forms a sustainable bottom in late spring or early summer, forming the basis for a summer rally. Until then, patience is required.
Seasonal indicators remain negative at least until June.
6. Macro Update – Debt, Power, Energy, and Gold
It is no secret that the United States has lived beyond its means for decades, financing its current account deficits through foreign borrowing and the privileged role of the petrodollar. Yet a national debt exceeding USD 39 trillion is not an abstract accounting figure—it represents a magnitude that would be difficult to grasp even if one were to aggregate all profits, gold reserves, bitcoins, or tax revenues. It illustrates how deeply the American financial system has become entrenched in a logic of debt that has long since detached itself from any realistic capacity for repayment.
As this high level of public and external debt increasingly constrains financial flexibility, the United States is behaving more and more like an overleveraged state in its foreign policy—seeking to stabilise its asset and liability position through tariffs, sanctions, and geopolitical pressure. In this context, Trump’s policies are not merely an expression of power politics, but also an attempt to improve America’s net financial position through trade conflicts, energy deals, and political leverage. It is hardly surprising that the Trump family itself appears to benefit substantially in the process.
6.1 Global Wealth Imbalances
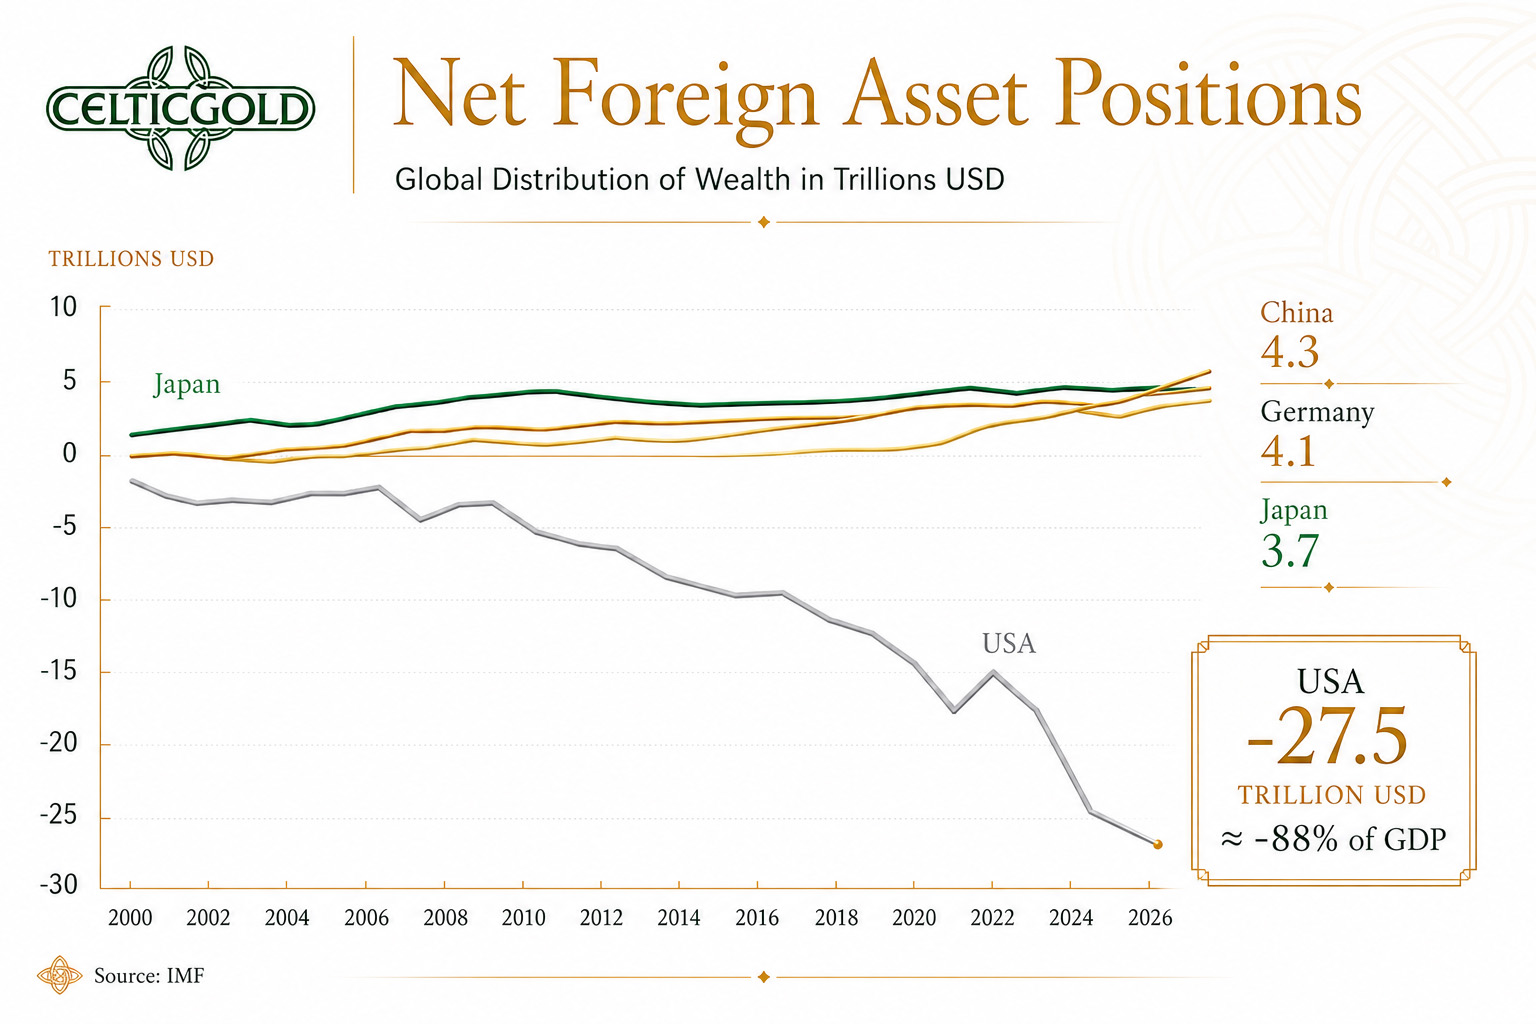
Net Foreign Asset Positions, as of 24th April 2026. Source: IMF, Prof. Sinn
The depth of the United States’ financial imbalance is clearly reflected in its net international investment position. This metric captures a country’s total net wealth vis-à-vis the rest of the world—that is, the balance between all foreign assets and liabilities held by the government, corporations, and households. While countries such as Germany, China, and Japan have accumulated substantial positive external wealth through years of export surpluses, the United States shows a deeply negative position of USD -27.5 trillion, or roughly 88% of GDP—a figure that has continued to deteriorate since 2008.
From this perspective, the global distribution of wealth becomes clear: surplus countries accumulate foreign assets, while deficit countries build up foreign liabilities. These stock imbalances shape the international order far more profoundly than short-term business cycles. For decades, the United States has sustained high levels of consumption and import surpluses, ultimately financed by foreign creditors. This imbalance forms a central backdrop to the increasingly assertive U.S. foreign economic and security policy, as well as to growing efforts to create economic and strategic dependencies. From this standpoint, current tensions are not escalating “by accident”, but reflect the behaviour of a highly indebted power seeking to stabilise its financial and geopolitical position through pressure, conflict, and control over resources.
The current global environment can no longer be adequately described using the framework of a stable postwar order. Instead, geopolitical, monetary, and institutional tensions are converging into a phase of structural uncertainty, in which old certainties lose their binding force and new centers of power compete for influence. This dynamic is particularly evident in the evolving role of the petrodollar.
6.2 The Petrodollar Under Pressure
For decades, the petrodollar has underpinned the international position of the United States by ensuring that oil and other strategic commodities are predominantly traded in dollars. As long as global energy resources are denominated in dollars, structural demand for U.S. financial assets remains high. However, this system comes under pressure when major producing nations begin to define their interests more independently and reduce their reliance on the dollar system.
6.3 Iran, Hormuz, and the Oil Shock
In this context, the conflict with Iran is far more than a regional confrontation. It directly affects one of the most sensitive chokepoints of the global economy: the Strait of Hormuz. Any disruption to supply chains, energy flows, or insurance mechanisms in this region drives not only oil prices higher but also raises geopolitical risk premiums across the global economy. The conflict therefore extends far beyond the Middle East, as it directly touches the stability of the dollar-based trade and financial system.
6.4 The UAE’s Break with OPEC
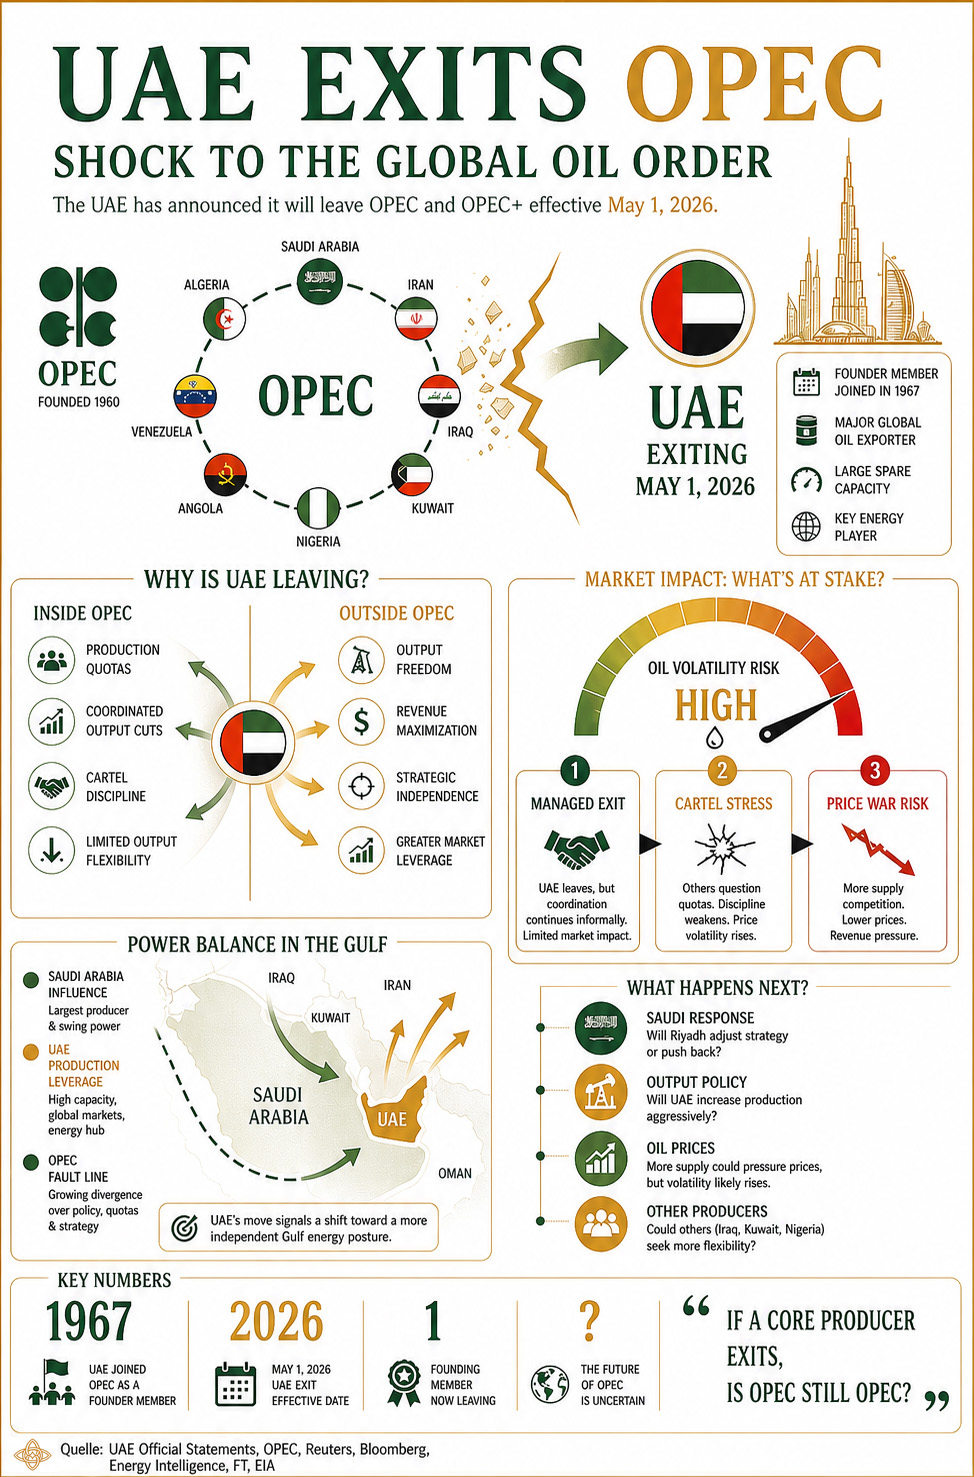
UAE exits OPEC, as of 24th April 2026. Source: UAE, OPEC, Reuters, Bloomberg, Energy Intelligence, FT, EIA
While politically significant, the UAE’s move is currently overshadowed by the far larger supply shock stemming from disruptions around the Strait of Hormuz. As long as this bottleneck persists, oil prices are likely to remain elevated and volatile. Although the UAE may increase its influence over the market through higher production in the longer term, this leverage remains limited as long as export flows themselves are constrained.
What makes this development particularly critical is that OPEC has served for decades as a key stabilising force in the oil market and an indirect pillar of the petrodollar system. As cohesion within the group weakens, individual producers gain greater flexibility to pursue more strategic and nationally driven production policies. The UAE’s increasing emphasis on national interest is therefore not merely a diplomatic detail, but a signal of a deeper shift within the global energy order.
6.5 Energy Shock Revives Gold’s Safe-Haven Role
At the same time, geopolitical tensions in energy markets can no longer be viewed in isolation. Oil, gas, aluminum, fertilisers, chemicals, and transport are tightly interconnected. Once supply disruptions occur, secondary price shocks ripple through nearly all industrial value chains. The impact is therefore not confined to the energy sector but extends across global production and trade.
In such an environment, financial flows also begin to shift. As governments, central banks, and private investors reassess their dependence on the dollar, the appeal of assets that are not merely claims on future payment—but are inherently scarce and independent of the debt system—increases. This is precisely where gold moves back into focus. Gold is not a promise to pay; it is an asset without counterparty risk.
6.6 China: Between Energy Dependence and Gold Accumulation
China embodies this dual dynamic. As the world’s largest oil importer, it is highly exposed to rising energy prices, yet it continues to expand its gold reserves. This points to a long-term strategy of reserve diversification and a gradual effort to reduce reliance on the dollar and the U.S. financial system. At the same time, elevated uncertainty in energy markets supports structural demand for hedging assets such as gold—even if a stronger U.S. dollar and weaker safe-haven demand can exert short-term pressure on prices.
6.7 Gold as an Alternative to the Debt System
Rising demand for gold should therefore not be seen merely as a reaction to speculation or panic, but as an expression of deeper mistrust in the debt-based monetary system. The more heavily public and private balance sheets are burdened with liabilities, the greater the need for a store of value that does not depend on the creditworthiness of a state or a financial institution. In this sense, gold becomes a form of insurance against monetary and geopolitical instability.
This is all the more relevant as financial markets themselves appear more fragile than headline indices suggest. Narrow market breadth, rising sovereign debt, and increasing dependence on liquidity often obscure underlying vulnerabilities. When bond markets become unsettled, energy prices rise, and geopolitical tensions intensify, the illusion of stability begins to falter. It becomes clear that valuations depend not only on earnings, but also on political and monetary credibility.
The United States finds itself in a dual bind: it must maintain its global leadership role while facing growing financial vulnerability due to high deficits, external indebtedness, and a declining willingness among other nations to absorb U.S. liabilities indefinitely. This combination creates a dangerous incentive toward escalation: those under domestic and financial pressure are more likely to adopt a confrontational stance externally.
6.8 From Dollar Dominance to Fragmentation
For this reason, the Iran conflict should not be viewed in isolation, but as part of a broader systemic crisis. The issue extends beyond regional security to the question of how long the dollar-based global order can be sustained through geopolitical dominance, energy dependence, and financial liquidity. The more this order erodes, the more important alternative assets, reserve strategies, and forms of strategic hedging become.
The future of the global economy is therefore likely to be shaped less by linear growth and more by fragmentation, bloc formation, and strategic positioning. States will seek to diversify their energy security, currency reserves, and access to raw materials. Companies will reconfigure supply chains, and investors will increasingly distinguish between nominal returns and real value preservation. This is not an environment for blind optimism.
6.9 Fragmentation Over Stability – Hence Gold
In conclusion, gold should be understood as a strategic anchor in a fragmented world. Not because it solves every crisis, but because it offers a rare constant in an environment defined by rising debt, geopolitical uncertainty, and eroding trust. In a financial system shaped by liquidity, intervention, and political tension, assets that exist outside the debt structure gain in importance. Gold is therefore less a speculative instrument than a barometer of how fragile confidence in the current global order has become.
7. Conclusion: Gold – In the Shadow of the Oil Price Shock
Despite its strong long-term fundamentals, gold currently remains a market of patience. The correction following its spectacular rally is both expected and necessary, rather than complete.
In the short term, gold is not yet in a clean uptrend but fluctuates between technical stabilisation and renewed vulnerability. Oil has become the dominant driver, with geopolitical tensions and inflation concerns shaping broader market dynamics.
The key takeaway: gold is structurally strong but tactically weakened. While the market digests recent excesses, the underlying case for gold—as a hedge against debt, fragmentation, and geopolitical risk—continues to strengthen.
For now, we expect a sideways range into early summer between the declining 50-day and rising 200-day averages, roughly between USD 4,350 and 4,850.