Gold has spent the past five months grinding through a deep and increasingly nervous correction, recently slipping below the closely watched USD 4,000 mark for the first time since last autumn. Yet beneath the surface, several technical and seasonal signals are now pointing towards an approaching bottom. In this analysis, we examine the latest price action, key chart levels, positioning data, and sentiment readings shaping gold’s near-term path — and explain why, despite mounting fragility across equity and credit markets, precious metals remain a vital strategic hedge heading into the historically stronger summer season.
1. Review – First Test of the USD 4,000 Mark
As feared, the falling 50-day moving average (USD 4,468) proved to be an insurmountable hurdle for the gold price over the past few months. Since the last rejection at this moving average on 12 May at USD 4,773, the downtrend has accelerated noticeably. In particular, the break below the round USD 4,400 mark triggered a sharp sell-off down to USD 4,023 in the first week of June.
The subsequent recovery was swift, reaching USD 4,382 within a few days, but the Fed’s interest-rate decision and the press conference that followed under new Fed Chair Warsh triggered renewed heavy selling. Within just seven days, the gold price plunged to USD 3,959. The psychologically important USD 4,000 mark could no longer withstand the selling pressure, and gold fell to its lowest level since early November 2025.
1.1 USD 4,000 as the Key Level
Even though the pace of declines has accelerated noticeably on the downside recently, the bears have overall made only slow progress to the downside. This week’s low undercut the 23 March low by USD 140 — it took the bears about three months to achieve that! At the same time, the broader correction that began at the end of January remains intact without question. The focus now shifts to the broad support zone around the USD 4,000 level.
Given the at times panicky sentiment of recent days, a bottoming process typical for early summer would certainly be plausible here. The erratic and volatile back-and-forth of recent weeks supports this view. However, considerable correction potential has built up in equity markets in the meantime, which could also weigh on precious metals prices in the event of a significant pullback.
For now, patience therefore remains the order of the day. Historically, precious metals prices often find a bottom in June or July, from which a respectable summer rally then typically follows. For this, however, the gold price would need to defend the area around USD 4,000 and the silver price the zone around USD 55. Alternatively, prices could move one level lower first.
2. Chart Analysis – Gold in US-Dollars
2.1 Weekly chart: Bottoming process in the coming days and weeks
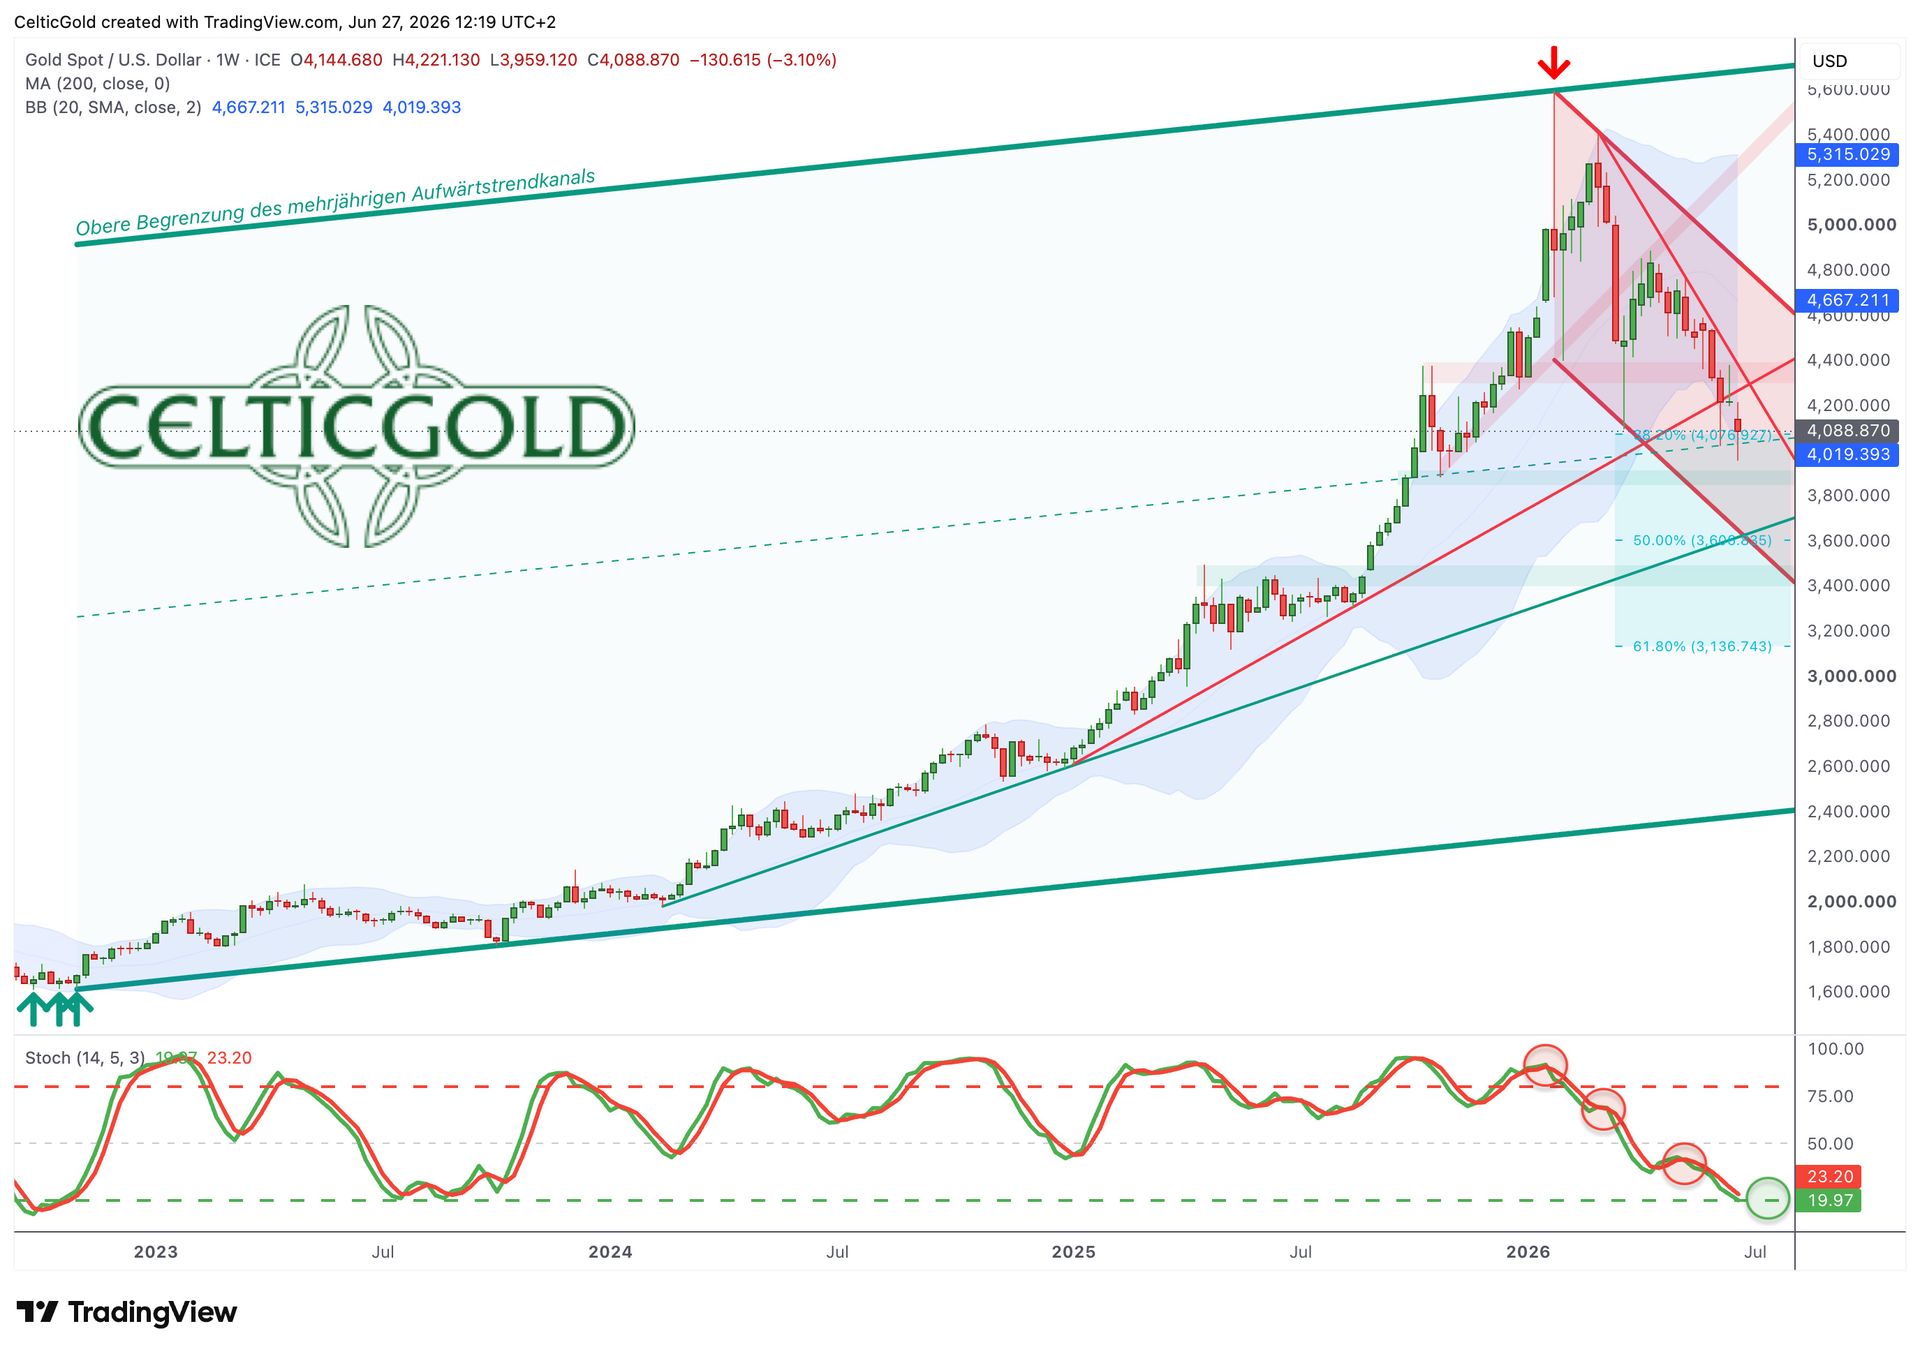
Gold in US-Dollar, weekly chart as of 27 June 2026. Source: Tradingview
Since the all-time high of USD 5,602 at the end of January, the gold market has been in a healthy, yet increasingly complex, correction phase. With the most recent low at USD 3,959, the market has now also broken below the 38.2% Fibonacci retracement of the prior up-move (from USD 1,615 to USD 5,620). The next relevant retracement levels lie at USD 3,608 (50%) and USD 3,138 (61.8%). This makes clear that the worst-case scenario we have repeatedly outlined, in the region of around USD 3,500, remains in play and still cannot be ruled out.
In the short term, the weekly candles continue to slide southward along the lower weekly Bollinger Band (USD 3,997). One to a maximum of three more weeks of strong downward pressure should, however, represent the maximum scenario for the bears’ acrobatics. After that, a bottoming process and a recovery — or a summer rally — can be expected.
At the same time, the weekly stochastic, after almost five months of correction and a price decline of over 29%, is now clearly in oversold territory. Against this backdrop too, the remaining downside risk over the coming days and weeks appears clearly limited. Should the broader correction nevertheless continue, the oscillator would first need to recover again. Accordingly, the odds are good that the gold price will form a bottom now or in July in the range between USD 3,800 and USD 4,000.
Overall, the weekly chart remains bearish but strongly oversold. A recovery or counter-move is already foreseeable and could start in July or August. In the bigger picture, however, the correction could still drag on and bring fresh lows again in the autumn.
2.2 Daily chart: New buy signal
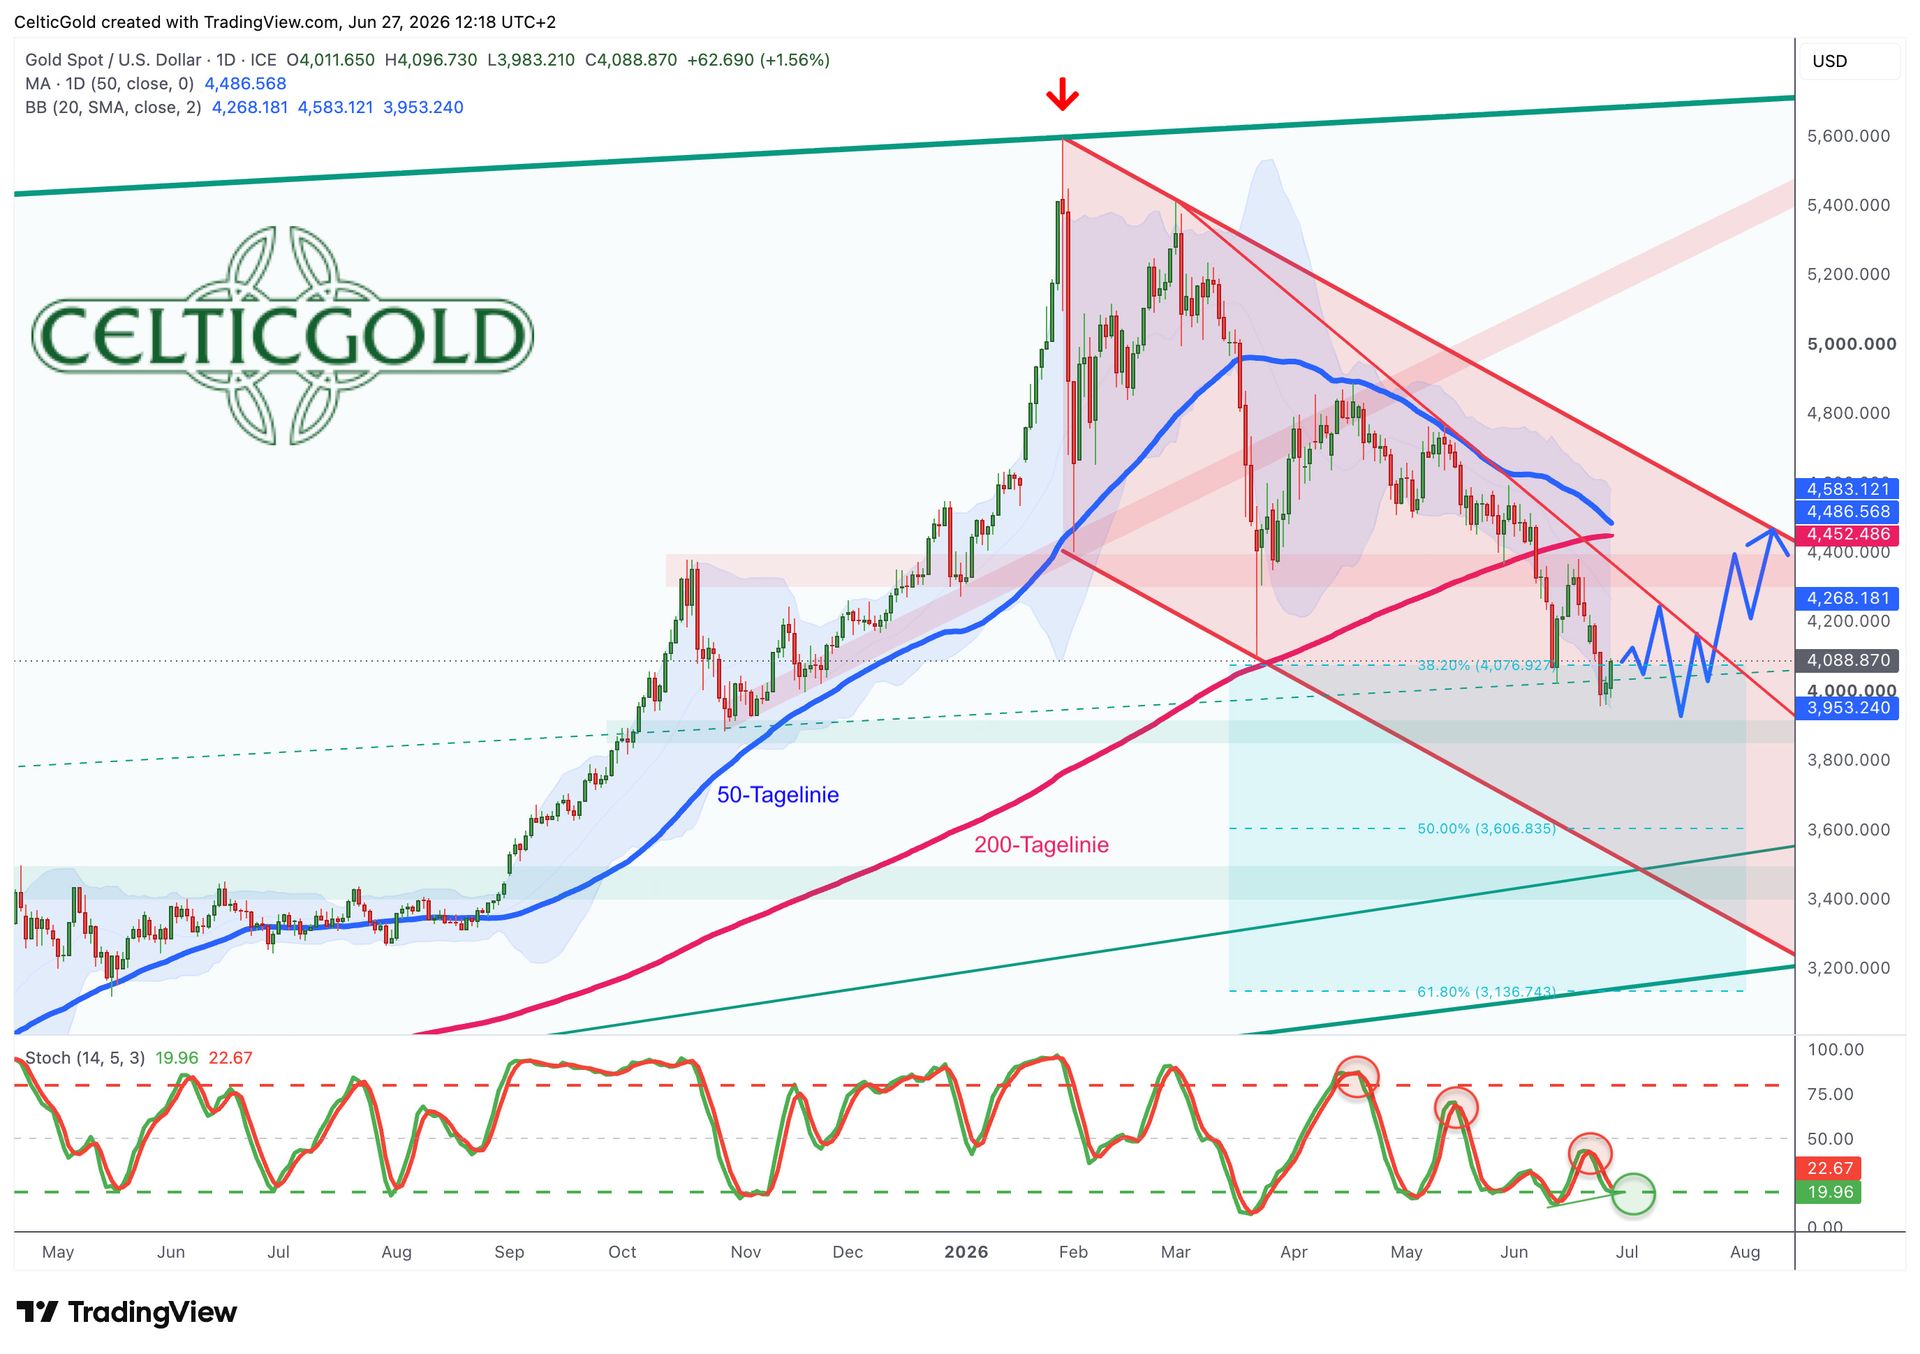
Gold in US-Dollar, daily chart as of 27 June 2026. Source: Tradingview
On a daily basis, the gold price lost contact with the still slowly rising 200-day moving average (USD 4,474) over the past three weeks. The gap widened to nearly 13% at times, underscoring the currently weakened technical condition. Only a return above this closely watched moving average would brighten the chart picture significantly.
By the end of the week, however, prices recovered noticeably and closed out the week at USD 4,088. The recovery move that has begun should initially lead into the area around USD 4,120 and, in the best case, could extend directly to around USD 4,220 without major setbacks. This is supported by the positive divergence in the daily stochastic, as the recent low at USD 3,959 was no longer fully confirmed by the indicator. In addition, the oscillator clearly reached its oversold zone. This suggests that a bottoming process may already be underway.
Nevertheless, it cannot be ruled out that, in the course of the typical early-summer shakeout, further setbacks will occur before a sustained counter-move can take hold.
Overall, the daily chart could thus be on the verge of a trend reversal. The daily stochastic has turned upward from oversold territory and offers further upside potential. A final setback below the USD 4,000 mark, into the area around roughly USD 3,840, nevertheless remains possible.
3. Commitments of Traders for Gold
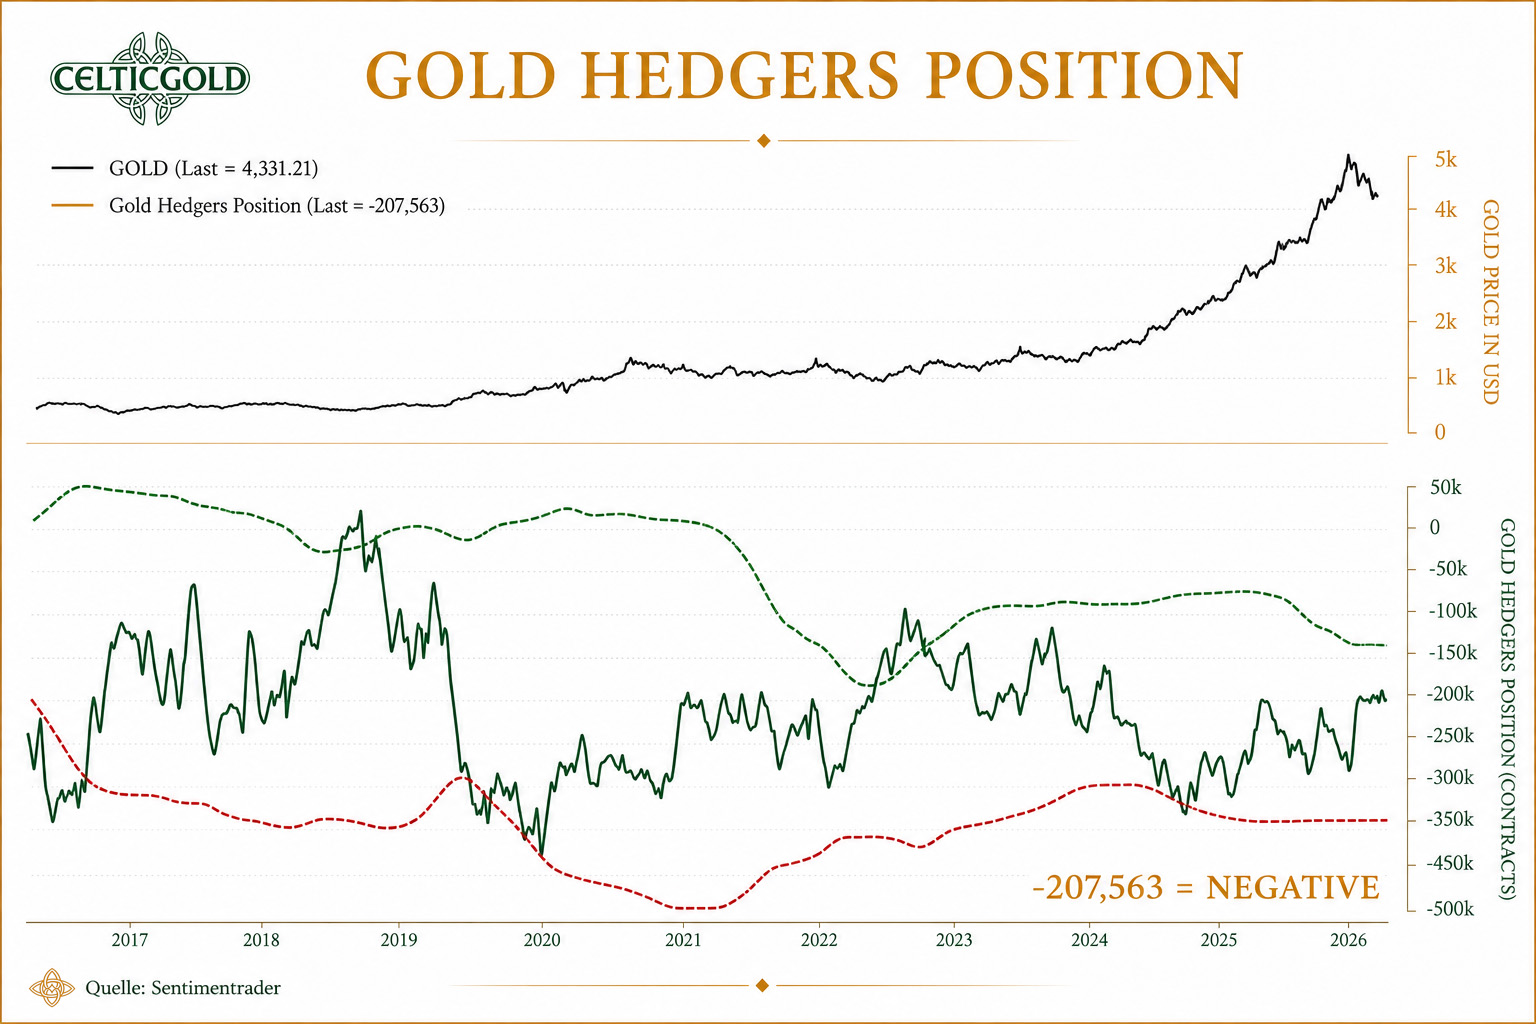
Commitments of Traders Report for gold futures as of 23 June 2026. Source: Sentimenttrader
According to the weekly Commitments of Traders (COT) report published by the U.S. Commodity Futures Trading Commission (CFTC), commercial traders held a cumulative short position of 207,563 gold futures contracts as of the 16 June closing price of USD 4,331.
The sharp price decline of recent weeks has so far not led commercial players to meaningfully reduce their short positions. Overall, there have been hardly any notable shifts since the start of the year, which supports our thesis that COMEX is increasingly losing influence.
In a long-term comparison, however, the commercial short position remains at a significantly elevated level. Based on 22 years of data, the COT report should therefore still be interpreted negatively.
4. Sentiment for Gold – Neutral
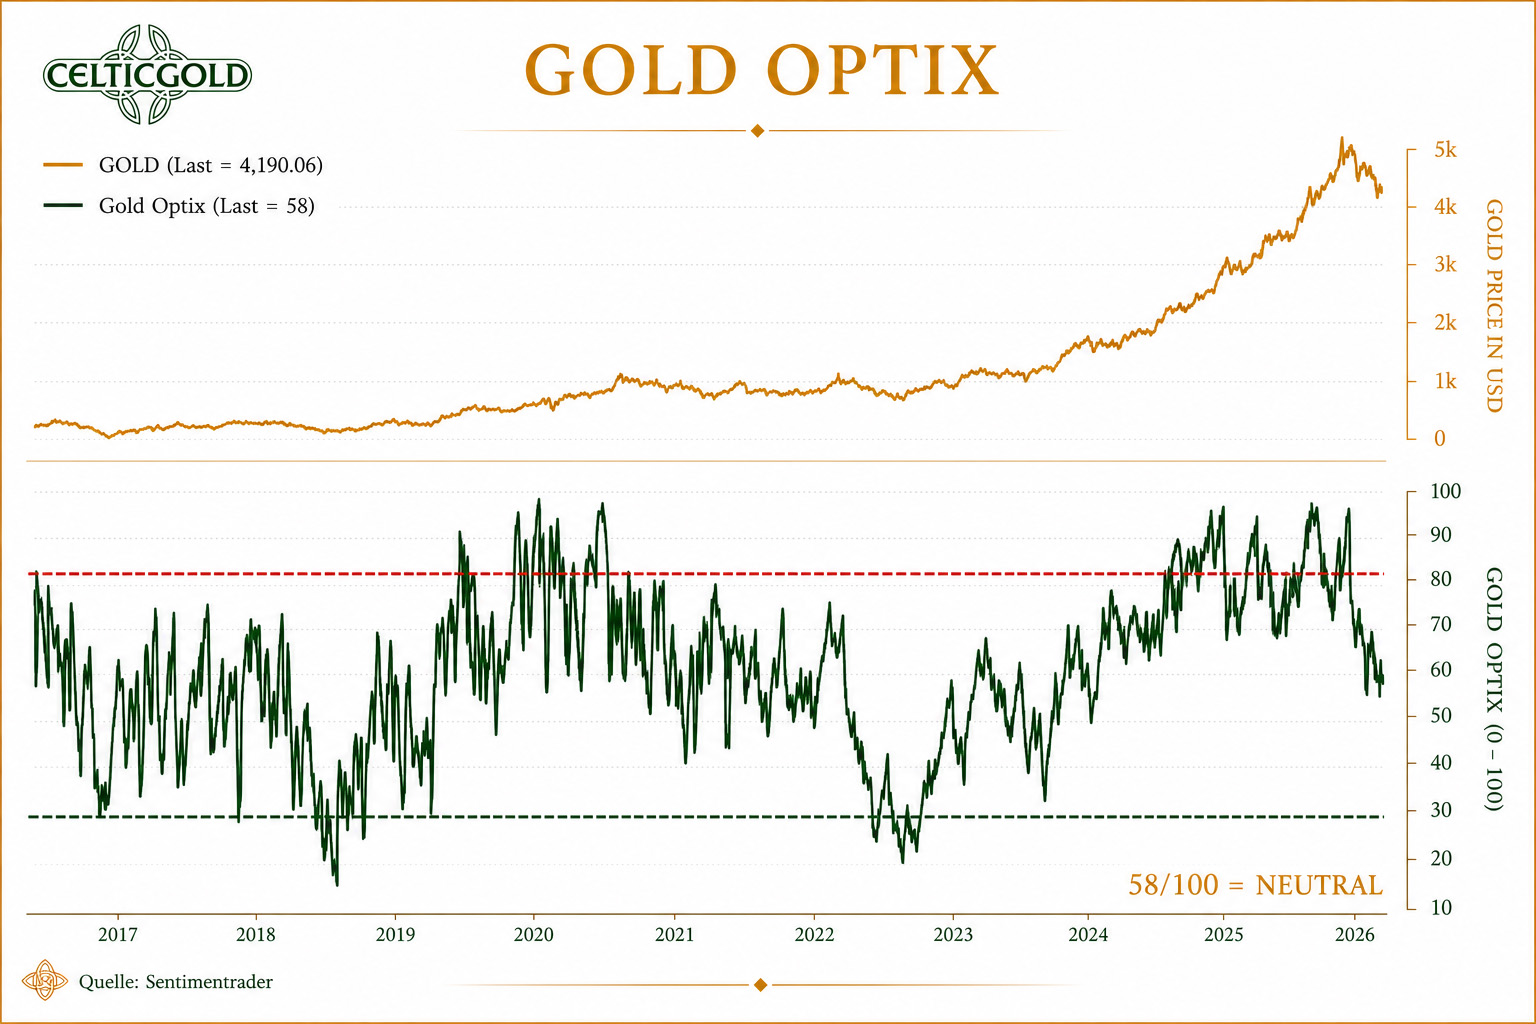
Sentiment Optix for gold as of 23 June 2026. Source: Sentimentrader
The sharp correction since the end of January has fully cleansed out the previously strongly euphoric sentiment. Since the March low, sentiment indicators have been moving in a neutral, not very meaningful range. In the worst case, the sentiment pendulum could still swing to the opposite extreme of panic and fear. However, significantly lower prices would be required for that, which we currently would only expect in the context of a pronounced stock market crash.
In summary, sentiment remains in neutral territory with an Optix reading of 58. Ideally, the Optix turns back upward soon above the 50–55 range. Otherwise, the probability of an intensifying correction rises noticeably.
5. Seasonality for Gold – Negative until June
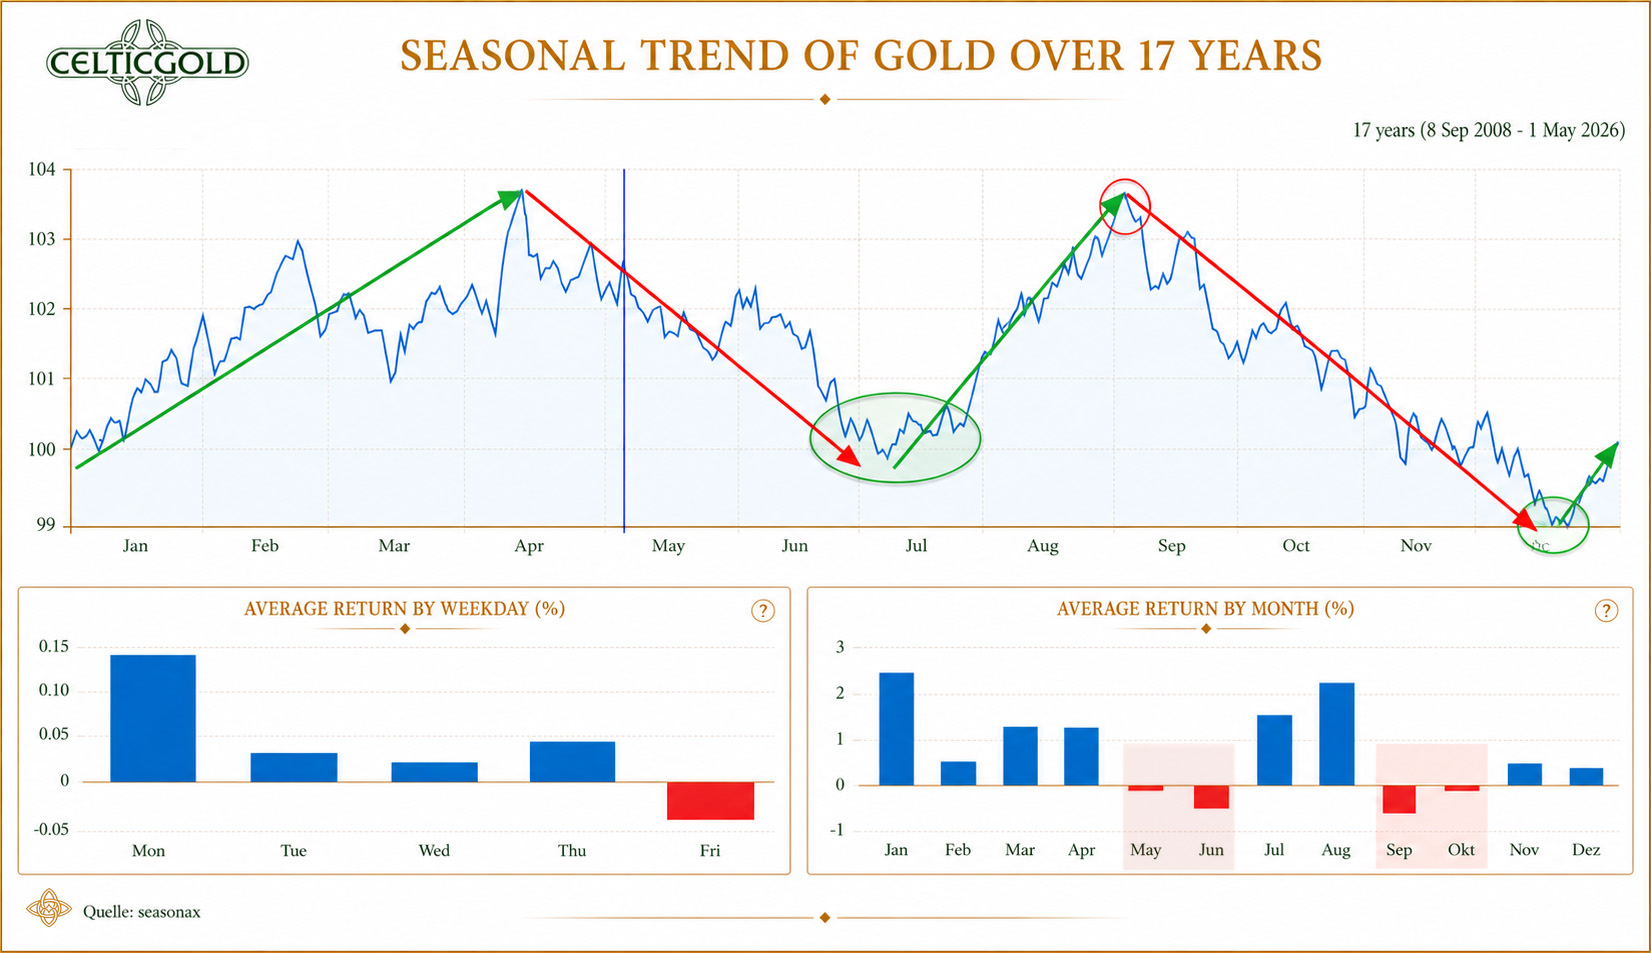
Seasonality for gold over the last 17-years as of 1 May 2026. Source: Seasonax
Typically, after its spring correction, the gold price finds a bottom in June or July and can then recover into September. With the recent low at USD 3,959 and the erratic price moves of recent weeks, such a turning point could already be forming in the coming days or weeks. August in particular has historically shown strong performance.
Overall, the seasonal traffic light is gradually shifting from red to orange — and to green from mid-July onward.
6. Macro Update – The Façade Still Holds, but the Foundation Is Increasingly Eroding
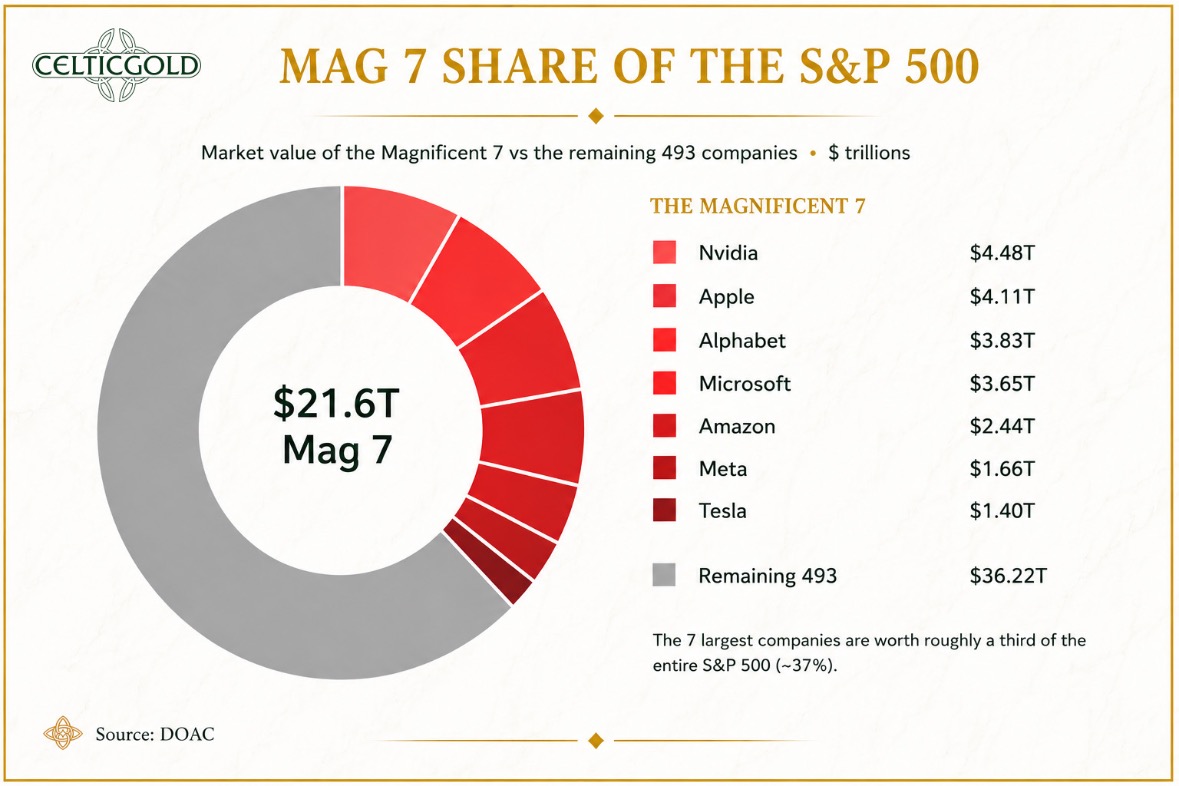
Share of the “Magnificent 7” in the S&P 500, as of 25 June 2026. Source: The Diary Of A CEO
At first glance, financial markets continue to look remarkably robust, yet warning signs are mounting beneath the surface. While the major U.S. indices trade near their record highs, market breadth has deteriorated noticeably, and numerous former market leaders — such as Oracle, Salesforce, Netflix, Palantir, Microsoft, Meta or Amazon — are already well into clear correction or bear-market phases.
For many of these high-flyers of recent years, the technical damage is now considerable. The fact that former growth and AI winners, as well as heavyweights from the mega-cap segment, have in some cases pulled back massively from their highs shows just how narrow the foundation of the still-ongoing bull market has become. The technology sector in particular, as the central driver of the boom, has therefore become highly vulnerable.
6.1 The Limits of the AI Boom
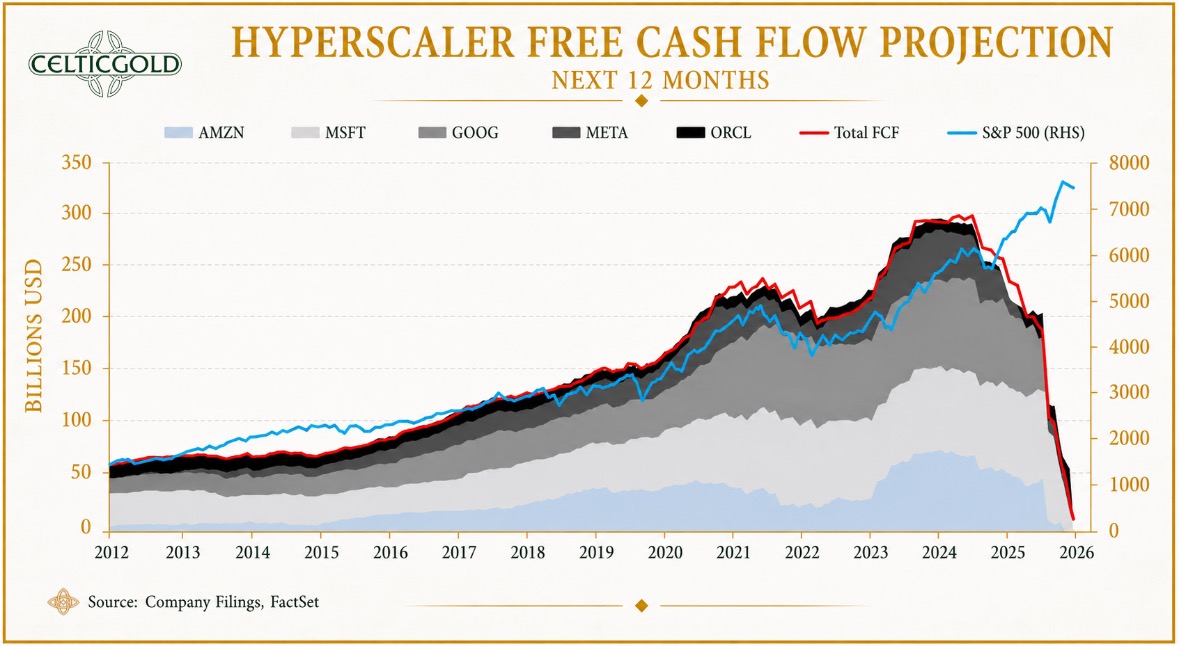
Free cash flow forecast for the hyperscalers, as of 26 June 2026. Source: Financelot
Cracks are also beginning to show in the euphoria surrounding the AI hyperscalers. Valuations now appear so stretched that the gap between free cash flow and the major indices is unlikely to be sustainable indefinitely. At the same time, declines are already being observed in AI GPU rental prices as well as in data-centre profit margins.
This points to a familiar pattern taking shape: either investment falls, revenues catch up substantially, or the market corrects. Based on everything currently visible, the third scenario appears increasingly plausible. The AI boom is being fueled not only by technological strength but also by extreme capital deployment in a very short period of time. If Chinese competitive pressure further squeezes margins and demand fails to keep pace, the hyperscalers will likely have to scale back spending sooner or later.
6.2 Speculation on Credit Is Driving the Markets
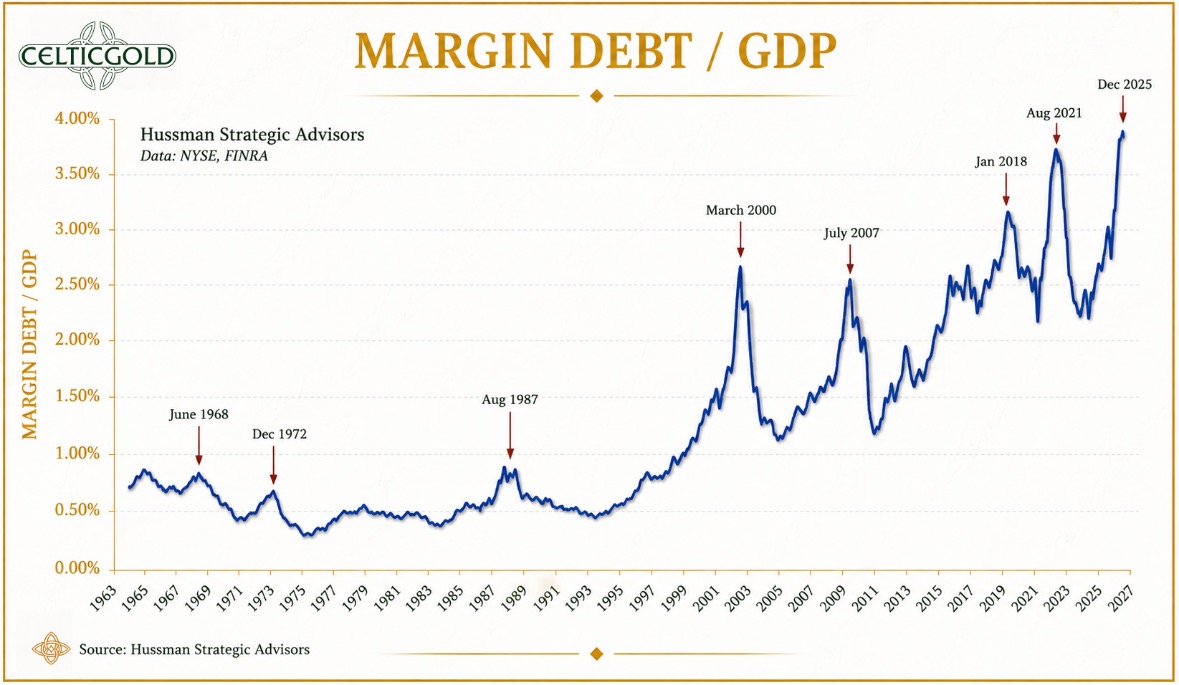
Margin debt relative to GDP at an all-time high, as of 6 June 2026. Source: Hussman Strategic Advisors
At the same time, credit-financed speculation relative to GDP has reached a new all-time high of over 4%, surpassing even the levels of August 2021, March 2000 and July 2007. Historically, such extreme readings have always been followed by significant pullbacks — not because a chart predicts the future, but because high leverage makes those who are forced to sell at the wrong moment particularly vulnerable.
This is precisely where the real danger lies: as long as prices rise, debt acts like a catalyst. As soon as the market picture turns, that same leverage becomes a risk factor and amplifies the downward move. In an environment where market breadth is already crumbling, this can significantly intensify the dynamics of a sell-off.
6.3 The Space Fantasy as a Prime Example
Most recently, the hype around the SpaceX IPO was unprecedented. It is precisely this euphoria and risk appetite in the market that, combined with its extreme valuation, make the stock a textbook example of the speculative bubble — since its highly ambitious visions of the future, AI fantasies and space dreams run far ahead of current business realities.
An IPO with an implied valuation of around USD 2 trillion and a revenue multiple of roughly 100 appears barely backed by fundamentals at all. As long as the bulk of the story rests on Starlink and on projections reaching very far into the future — such as Mars colonies, asteroid mining or space-based AI — the risk-reward ratio remains massively skewed and highly unfavorable.
6.4 Late-Cycle Characteristics Are Piling Up
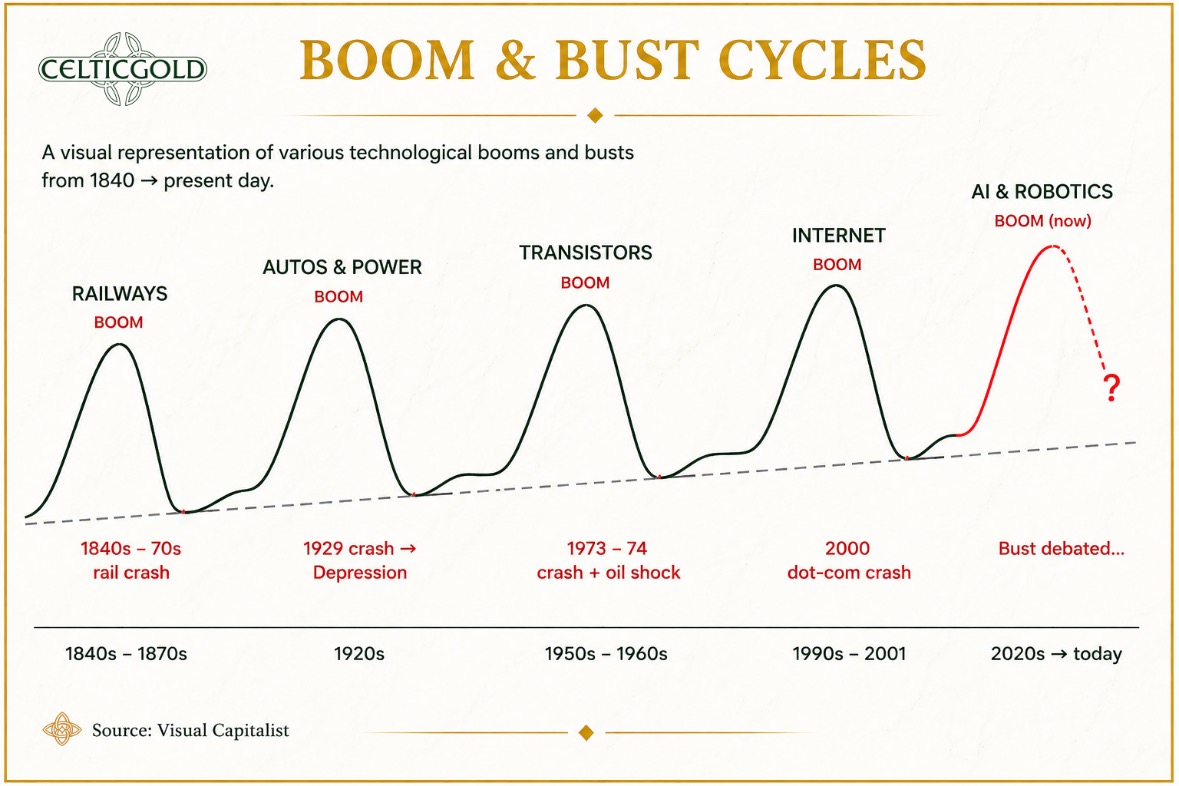
Boom & bust cycles, as of 26 June 2026. Source: Visual Capitalist
It is precisely this shrinking market breadth, combined with a “mega IPO,” that constitutes a classic late-cycle characteristic. When only a handful of mega-caps, together with rampant credit-fueled speculation, are pulling the index higher, while a broad swath of the market is already weakening and “smart money” is cashing out via IPOs, the risk of an abrupt repricing rises significantly!
Boom and bust cycles are not an exceptional phenomenon but a recurring feature of evolving economies. Markets rarely move in a straight line; instead, they oscillate between excessive optimism and excessive pessimism. Phases of strong expansion are regularly followed by overextension, rising risks and, eventually, a correction that unwinds imbalances and lays the foundation for the next upswing.
6.5 Semiconductors as a Warning Signal
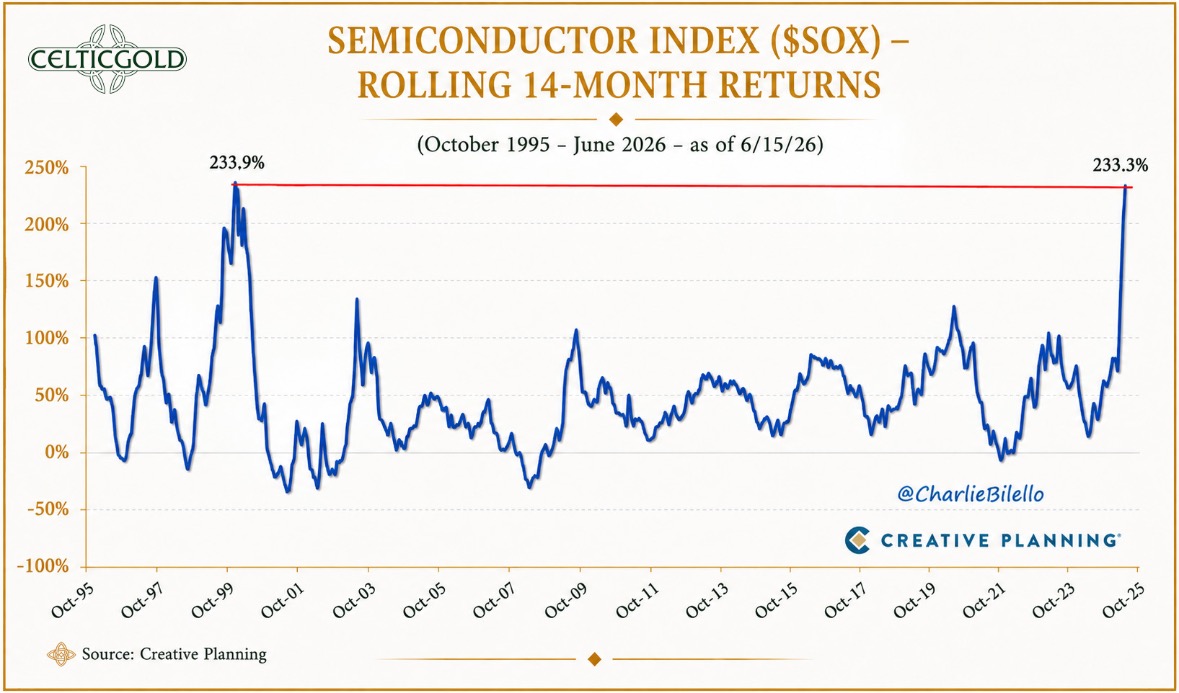
Semiconductor index, as of 16 June 2026. Source: Creative Planning
Given the parabolic rise in semiconductor stocks, history also speaks a clear language here. There have so far been only two periods in which the Semiconductor Index gained more than 230% within 14 months: from December 1998 to February 2000, and from April 2025 to today. The fact that these are precisely the two episodes underscores how extraordinary — and at the same time fragile — such parabolic advances typically are.
The warnings from prominent investors are correspondingly sharp. Ray Dalio warns of an environment reminiscent of earlier bubble phases, and Jeremy Grantham describes U.S. equity markets, given the AI euphoria, as historically expensive.
6.6 Fed Under Watch
Meanwhile, the Federal Reserve continues to keep its distance from premature easing expectations. At its most recent meeting, it held interest rates steady while simultaneously raising its inflation projections and making clear that the fight against price pressures is not yet over.
Under Kevin Warsh, the central bank is also placing less emphasis on classic forward guidance. Markets will therefore need to rely more heavily on incoming data going forward, which is likely to make monetary policy expectations more volatile and reactions in financial markets choppier. On top of that, markets often grow nervous in the first months after a change of leadership at the Fed, since the new policy stance, response patterns and communication style still need to settle in.
It is notable, however, that markets have recently interpreted the Fed as more restrictive than its projections suggest. While higher rates were priced in for the near term, the Fed’s own projections for the coming years continue to point to lower rates.
6.7 Oil Remains the Pacesetter
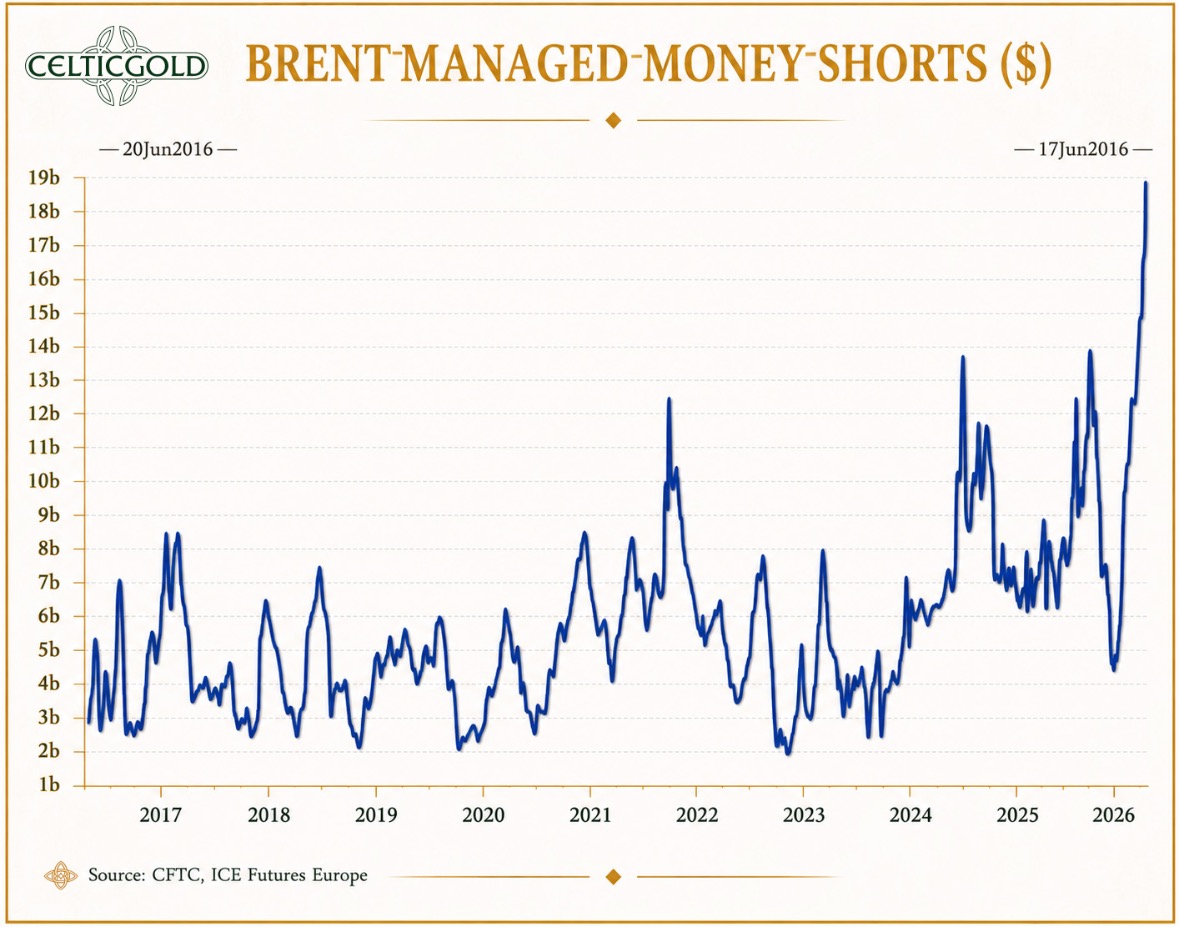
Oil short positions at a historic high, as of 22 June 2026. Source: Zerohedge
A key factor for the next phase of monetary policy naturally remains the oil price. The recent easing of tensions around the Persian Gulf and the resumption of shipping traffic through the Strait of Hormuz have put crude oil under pressure and, for now, dampened inflation dynamics. Should this trend continue, the recent inflation uptick could end up looking temporary, which would also increase pressure on the central bank to start considering rate cuts again later in the year.
Despite this easing, however, the geopolitical situation remains highly fragile. A renewed escalation in the Middle East could push oil prices sharply higher again at any time, abruptly worsening the inflation outlook.
The current oil oversupply should therefore not be mistaken for a sign of a permanently more balanced market. The additional crude volumes that have reached the market in recent weeks, the extremely low inventory levels, the still-restricted transport routes and the persistent shortage of refined products all point more toward a temporary distortion than a sustainable easing. On top of this come record-high short positions. Volatility in the oil market is therefore likely to remain elevated, and a renewed price spike is already foreseeable.
6.8 Shortages in Intermediate Products Will Feed Through to Consumer Prices
At the same time, new bottlenecks are emerging in critical intermediate products. Sulfur and sulfuric acid in particular are becoming a bottleneck for the extraction of numerous industrial metals, and therefore also for the supply of copper, nickel, uranium, cobalt and rare earths. This is not just an issue for industry, however, but also for inflation: as intermediate products become scarcer and more expensive, the effects feed through with a lag into investment, production and ultimately consumer prices.
6.9 Precious Metals as a Strategic Buffer
In sum, the signals are pointing increasingly toward a late stage of the cycle: the major indices continue to trade near their highs and still convey strength, yet market breadth, credit excesses, semiconductor euphoria, AI overextension and speculative IPO fantasies already paint a considerably more fragile picture.
Add to this a cautious central bank, a still-sensitive oil market and rising consumer prices. The environment therefore remains vulnerable to abrupt changes in direction: the façade still stands, but the foundation is already becoming noticeably more brittle.
This is precisely why real assets should continue to play a central role in portfolios. Although precious metals have been correcting for almost five months now and the weekly chart has taken on oversold characteristics, the macroeconomic environment — marked by high debt levels, inflation and political uncertainty — continues to argue for gradually building positions as a strategic store of value and liquidity buffer. Gold and silver are, and remain, important diversifiers and continue to provide the best long-term inflation protection.
7. Conclusion: Gold – Forming a Base Ahead of the Summer Rally
After more than five months of correction, the gold market should gradually be ripe for a counter-move, or recovery. The brief break below the round USD 4,000 mark may already have marked the early-summer low. Alternatively, the bears could make one final attempt in the coming weeks to push the gold price below this psychological level. Given the oversold weekly chart and the now more favorable seasonality, however, the odds favor a surprise to the upside.
The upcoming recovery could turn out to be a summer rally and target at least the area between USD 4,400 and USD 4,500. We are not yet convinced, however, of a sustained breakout from the downward channel with prices clearly above USD 4,550; it seems quite possible instead that the correction will resume after a summer rally. This is also supported by the increasingly fragile environment in equity markets, characterized by shrinking market breadth, high credit leverage, AI overextension and speculative single-stock fantasies.
Overall, the broader picture remains dominated by high uncertainty, as geopolitics, the oil price, inflation and interest rates could set markets in motion again at any time, while consumers face mounting price pressure. Precisely for this reason, gold and silver are indispensable strategic building blocks in a world whose facade still stands, but whose foundation is increasingly eroding.
"27th June 2026, Gold – Forming a Base Ahead of the Summer Rally" – analysis was initially published on 27th June 2026 by www.celticgold.de and translated into English on 30th June 2026.
Feel free to join us in our free Telegram channel for daily real time data and a great community. If you like to get regular updates on our gold model, precious metals and cryptocurrencies you can subscribe to our free newsletter.
Disclosure:
This article and the content are for informational purposes only and do not contain investment advice or recommendations. Every investment and trading move involves risk, and readers should conduct their own research when making a decision. The views, thoughts and opinions expressed here are the author’s alone. They do not necessarily reflect or represent the views and opinions of Midas Touch Consulting.
About the Author: Florian Grummes
Florian Grummes is an independent financial analyst, advisor, consultant, mentor, trader & investor as well as an international speaker with more than 30 years of experience in financial markets.
Florian is the founder and managing director of his company Midas Touch Consulting, which is specialized in trading & investments as well as consulting, analysis & research with a focus on precious metals, commodities and digital assets.
Via Midas Touch Consulting he is publishing daily and weekly gold, silver, bitcoin & cryptocurrency analysis for his numerous international readers. Florian is well known for combining technical, fundamental/macro and sentiment analysis into one often accurate conclusion about the markets.