Since early October, Bitcoin has experienced a sharp decline, wiping out all of its 2025 gains amid growing panic and selling pressure in the crypto market. Despite the current turmoil, signals point to an imminent trend reversal and a potential recovery phase ahead.
1. Review
After Bitcoin had moved sideways above USD 108,000 since early July – still bullish but with heightened volatility – it reached a marginally higher all-time high of USD 126,272 on 6th October. Immediately afterward, however, the price sharply declined to USD 103,530, from which it only managed to recover to USD 116,381.
Since 27th October, selling pressure intensified, pushing Bitcoin to a seven-month low of USD 80,537 on last Friday. Although the market saw an initial reaction, with Bitcoin recovering around 9.3%, currently it is trading at roughly USD 86,400.
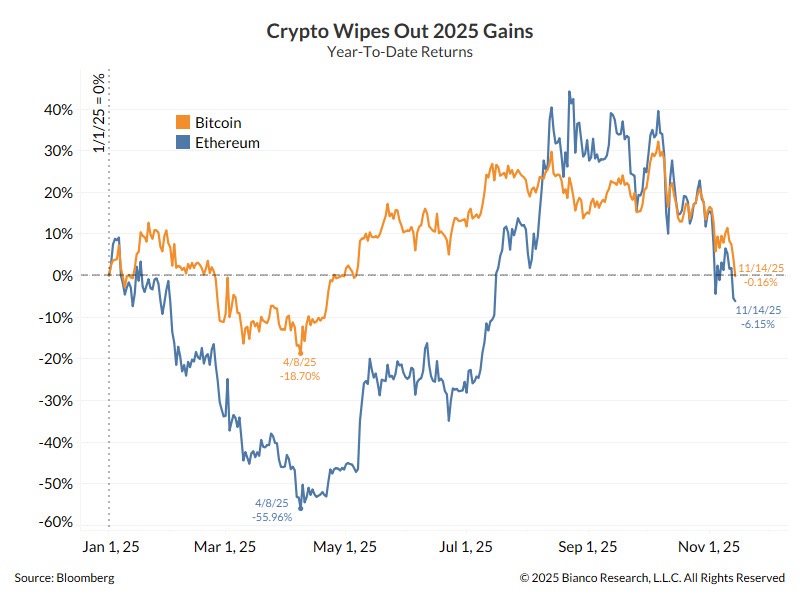
Crypto erased all 2025 gains as of November 15th, 2025. Source: businessinsider
Overall, since the start of the year, Bitcoin has lost almost 15% at its peak. Many altcoins have fared considerably worse. In contrast, Ethereum, with prices just above USD 2,875, remains slightly positive year-to-date.
2. Technical Analysis for Bitcoin in US-Dollar
2.1 Weekly Chart: Oversold Weekly Stochastic
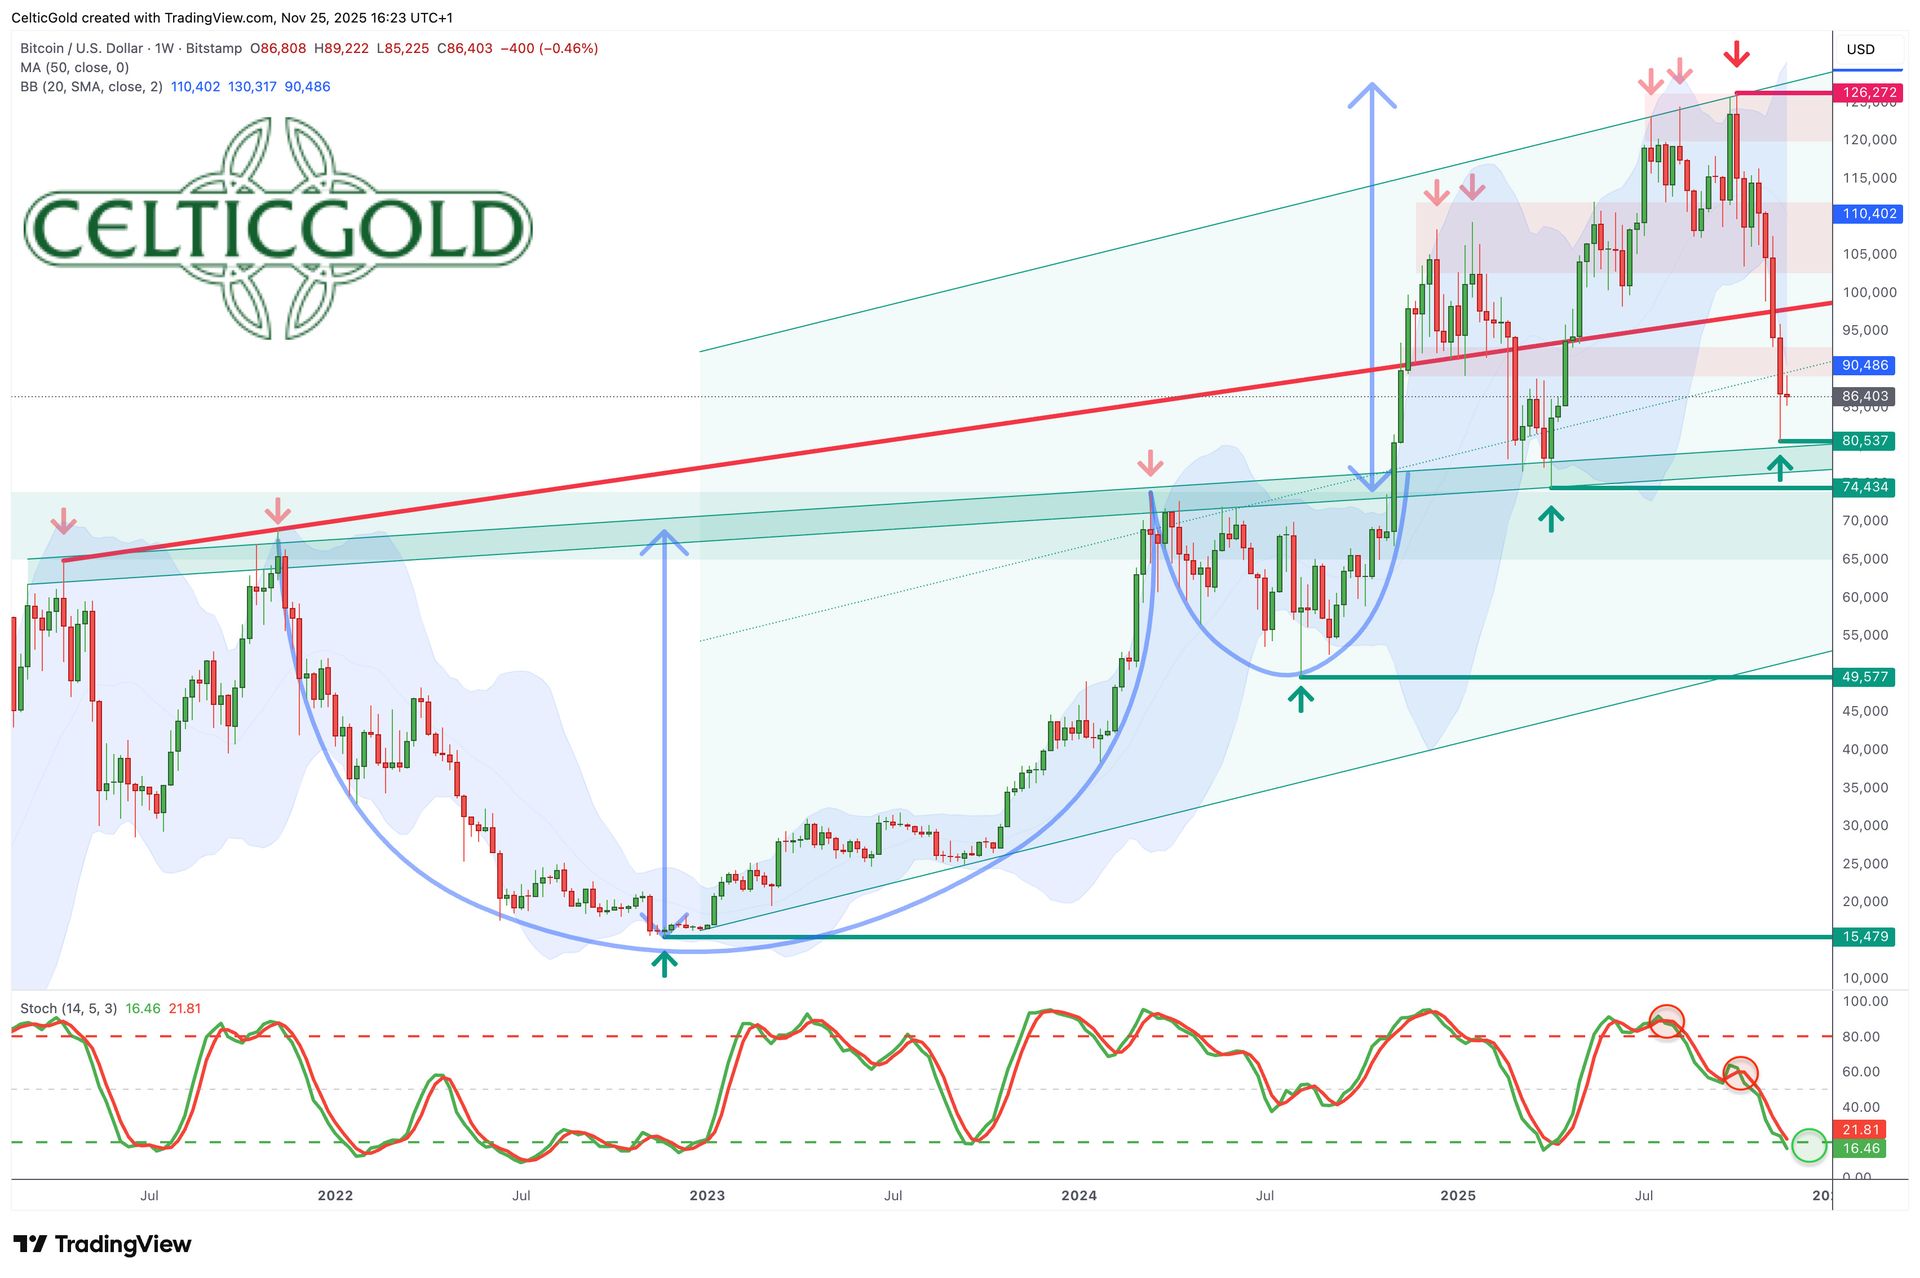
Bitcoin in USD, weekly chart as of November 25th, 2025. Source: Tradingview
With USD 126,272, Bitcoin hit a new all-time high on 6th October. Since mid-July, however, the climb to new highs had become increasingly sluggish. Ultimately, however, the target out of the large cup-and-handle formation was completed in textbook fashion.
Nevertheless, this slow upward progress prompted a sell signal from the weekly stochastic in late July, creating an increasingly negative divergence on the weekly chart over the summer months. The sharp decline in recent weeks was thus a logical consequence.
The downturn led Bitcoin, with a low of USD 80,537, back to the neckline of the former cup-and-handle-pattern. Nevertheless, it can be argued that the overarching uptrend since late 2022 remains intact. At the same time, the weekly stochastic is oversold for the first time since late March.
In sum, the weekly chart is bearish due to the steep losses. But the oversold situation, combined with support around USD 80,000, makes the remaining short-term downside seem limited. Therefore, a multi-week recovery is likely.
2.2 Daily Chart: Turning Point and Trend Reversal
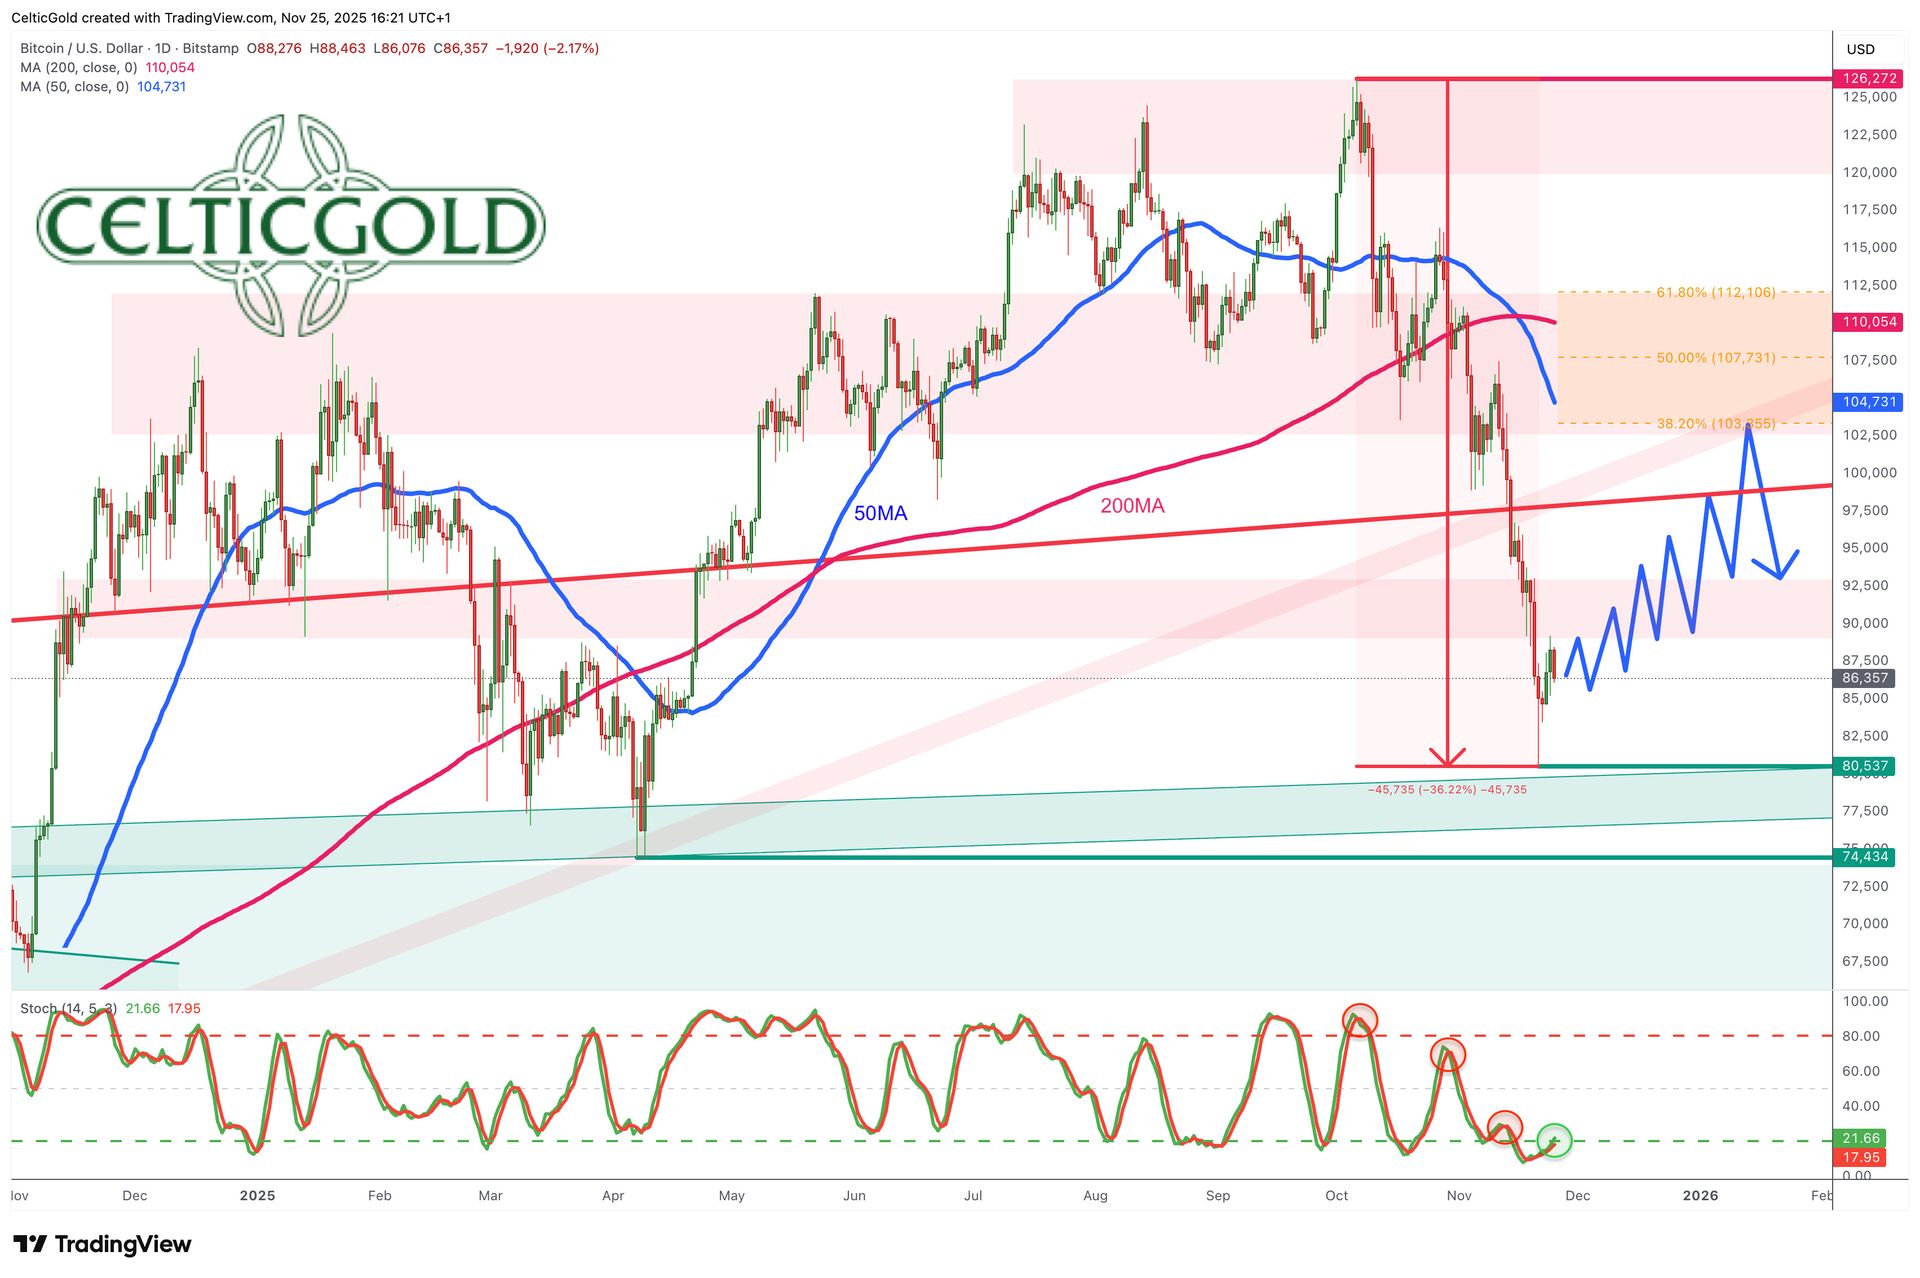
Bitcoin in USD, daily chart as of November 25th, 2025. Source: Tradingview
On the daily chart, bears pushed Bitcoin down nearly 30% in the past six weeks. Since the new all-time high on 6th October, Bitcoin has lost over USD 45,700. The daily chart is now completely oversold, and the price dynamics of the past 12 days since breaking below USD 100,000 suggest capitulation.
Since Friday, Bitcoin has bounced to around USD 89,250. Most likely, Friday marked the correction’s low and a recovery is beginning.
However, the path upward is lined with strong resistance. The first resistance sits around USD 90,000. Above that an old resistance line around USD 97,500, followed by the psychological USD 100,000 mark together with the 38.2% retracement around USD 98,000 will see string resistance by the bears. The distance to the flat 200-day moving average (USD 110,054) is a hefty 26.5%. Nevertheless, the 200-day moving average together with the 61.8% retracement (USD 108,875) would be the logical and best case target within a larger recovery.
In conclusion, Bitcoin most likely hit an important low last Friday and should now set out for a significant recovery, as the strongly oversold daily stochastic provides ample room for a robust reaction.
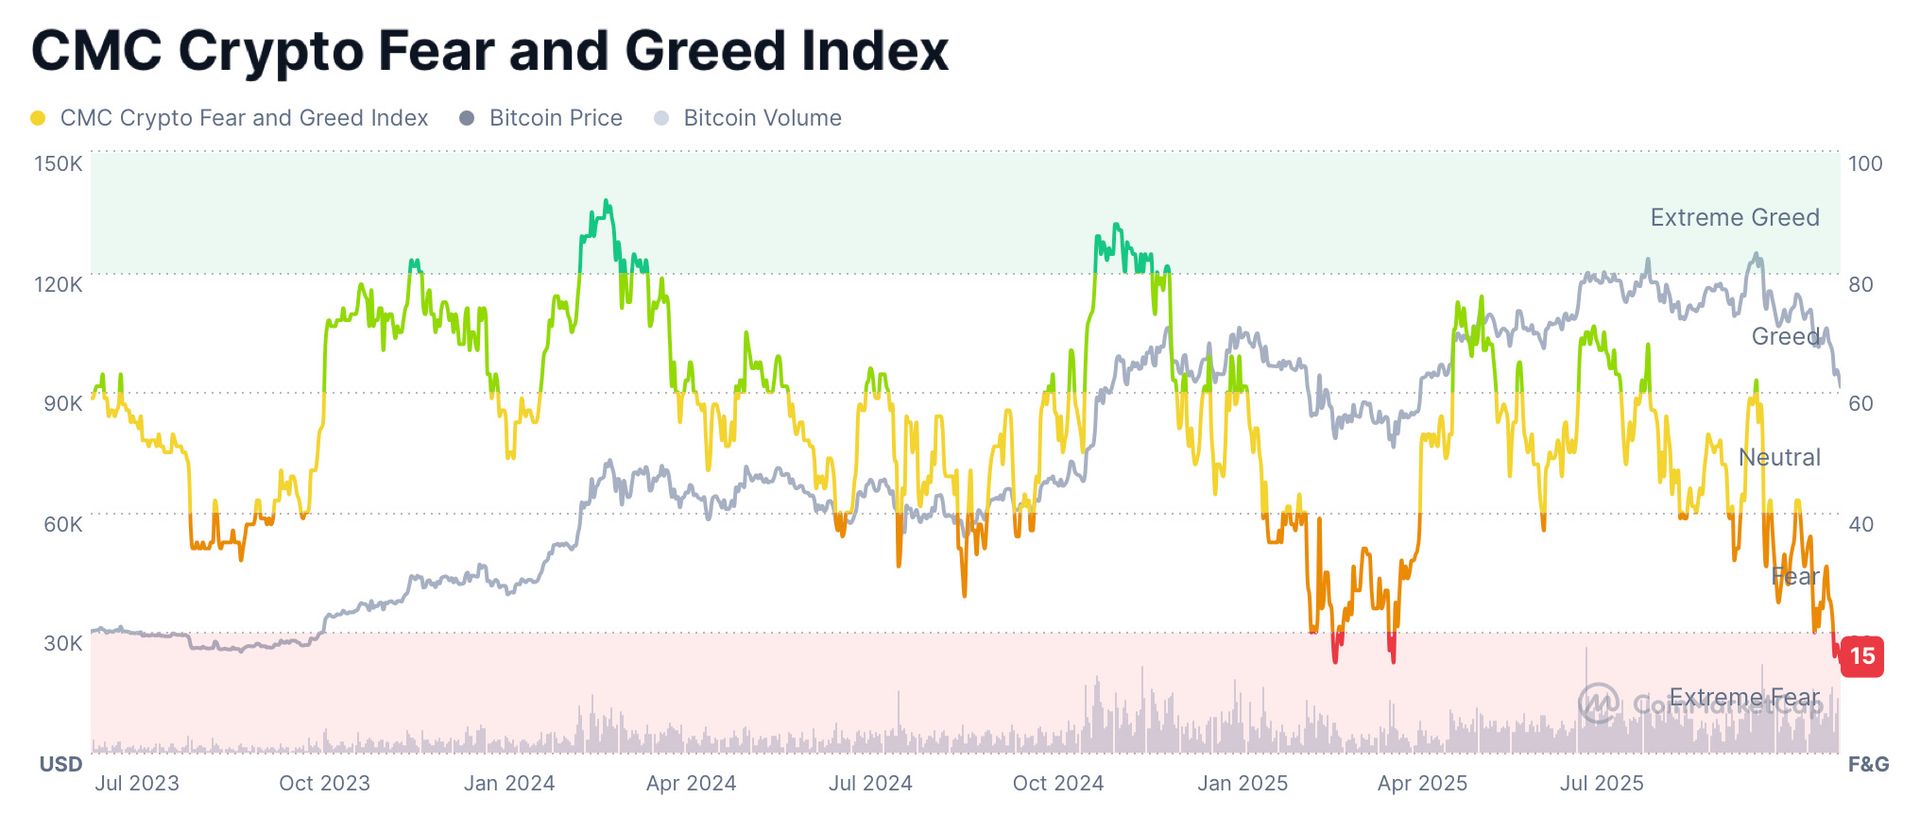
3. Bitcoin Sentiment – Utterly Bombed Out Mood
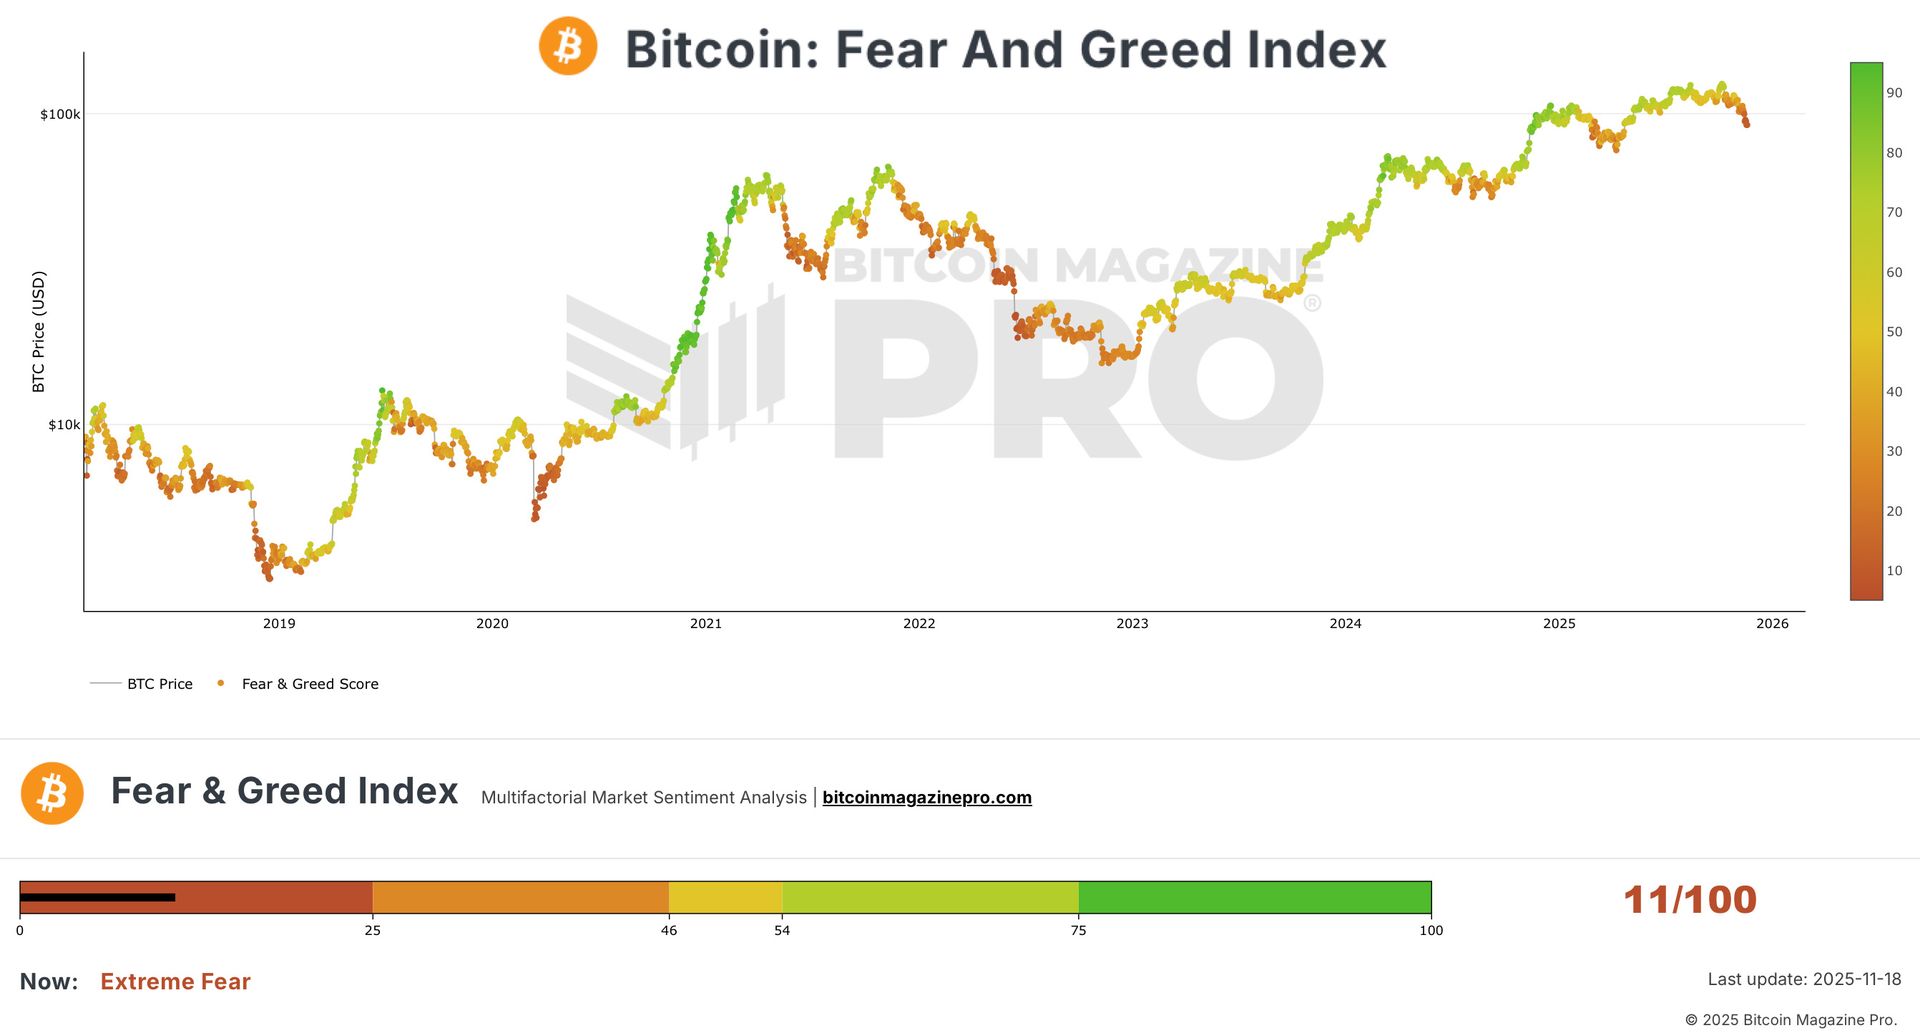
Crypto Fear & Greed Index, as of November 18th, 2025. Source: Bitcoin Magazine Pro.
The Crypto Fear & Greed Index came in at 11 out of 100, signaling extremely high levels of fear and panic among crypto investors. Such a low figure—the lowest in over two years—reflects ongoing uncertainty triggered by a series of negative events: regulatory crackdowns in several countries, collapses of smaller altcoins, liquidations in the derivatives markets worth billions, and Bitcoin’s ongoing price spiral below USD 95,000. Many retail investors, who were euphoric above index values of 80 in the summer, are now pulling out or hedging positions.
Historically, such extreme fear often marks trend reversals. In the past, panic phases were frequently followed by powerful relief rallies within two to twelve months. Whether the recent low at USD 89,189 is already a turning point—or if more selling lies ahead—remains to be seen; what’s clear is that the market is now enduring maximum emotional stress, with rational analysis often overwhelmed by sheer fear.
CMC Crypto Fear & Greed Index, as of November 18th, 2025. Source: Coinmarketcap
The CMC Crypto Fear & Greed Index echoed this panic with a reading of 15.
In summary, the crypto market is in a state of capitulation. Sentiment is more bombed out than at any point since spring; historically, these extreme fear levels have repeatedly laid the groundwork for some of the strongest and most sustainable rallies.
4. Bitcoin Seasonality – Turning Point delayed towards Mid-November?

Bitcoin Seasonality as of July 17th, 2025. Source: Seasonax
Bitcoin’s market cycle follows distinct seasonal and cyclical patterns influenced by the four-year halving cycle. Historically, bull markets peaked 12–18 months post-halving (the last occurred in April 2024), typically in early-to-mid June, followed by a summer correction and a bottom or trend reversal from early autumn to mid-October.
In 2025, however, there’s been a remarkable shift of about a month: the expected peak, often reached in June during previous cycles, unfolded in multiple waves in July, August, and finally early October, stretching out the period of euphoria. This delay—likely due to institutional ETF inflows, delayed macro effects, and a prolonged accumulation phase—means that the classic autumn correction and the phase of “extreme fear” may bottom out in mid-November rather than October.
Thus, there is a good chance the crypto market is on the verge of an important bottom, with the beginnings of a recovery that could extend into next spring.
All in all, seasonality signals green, suggesting a multi-month recovery phase for Bitcoin could soon be underway.
5. Sound Money – Bitcoin vs. Gold (Bitcoin/Gold Ratio)
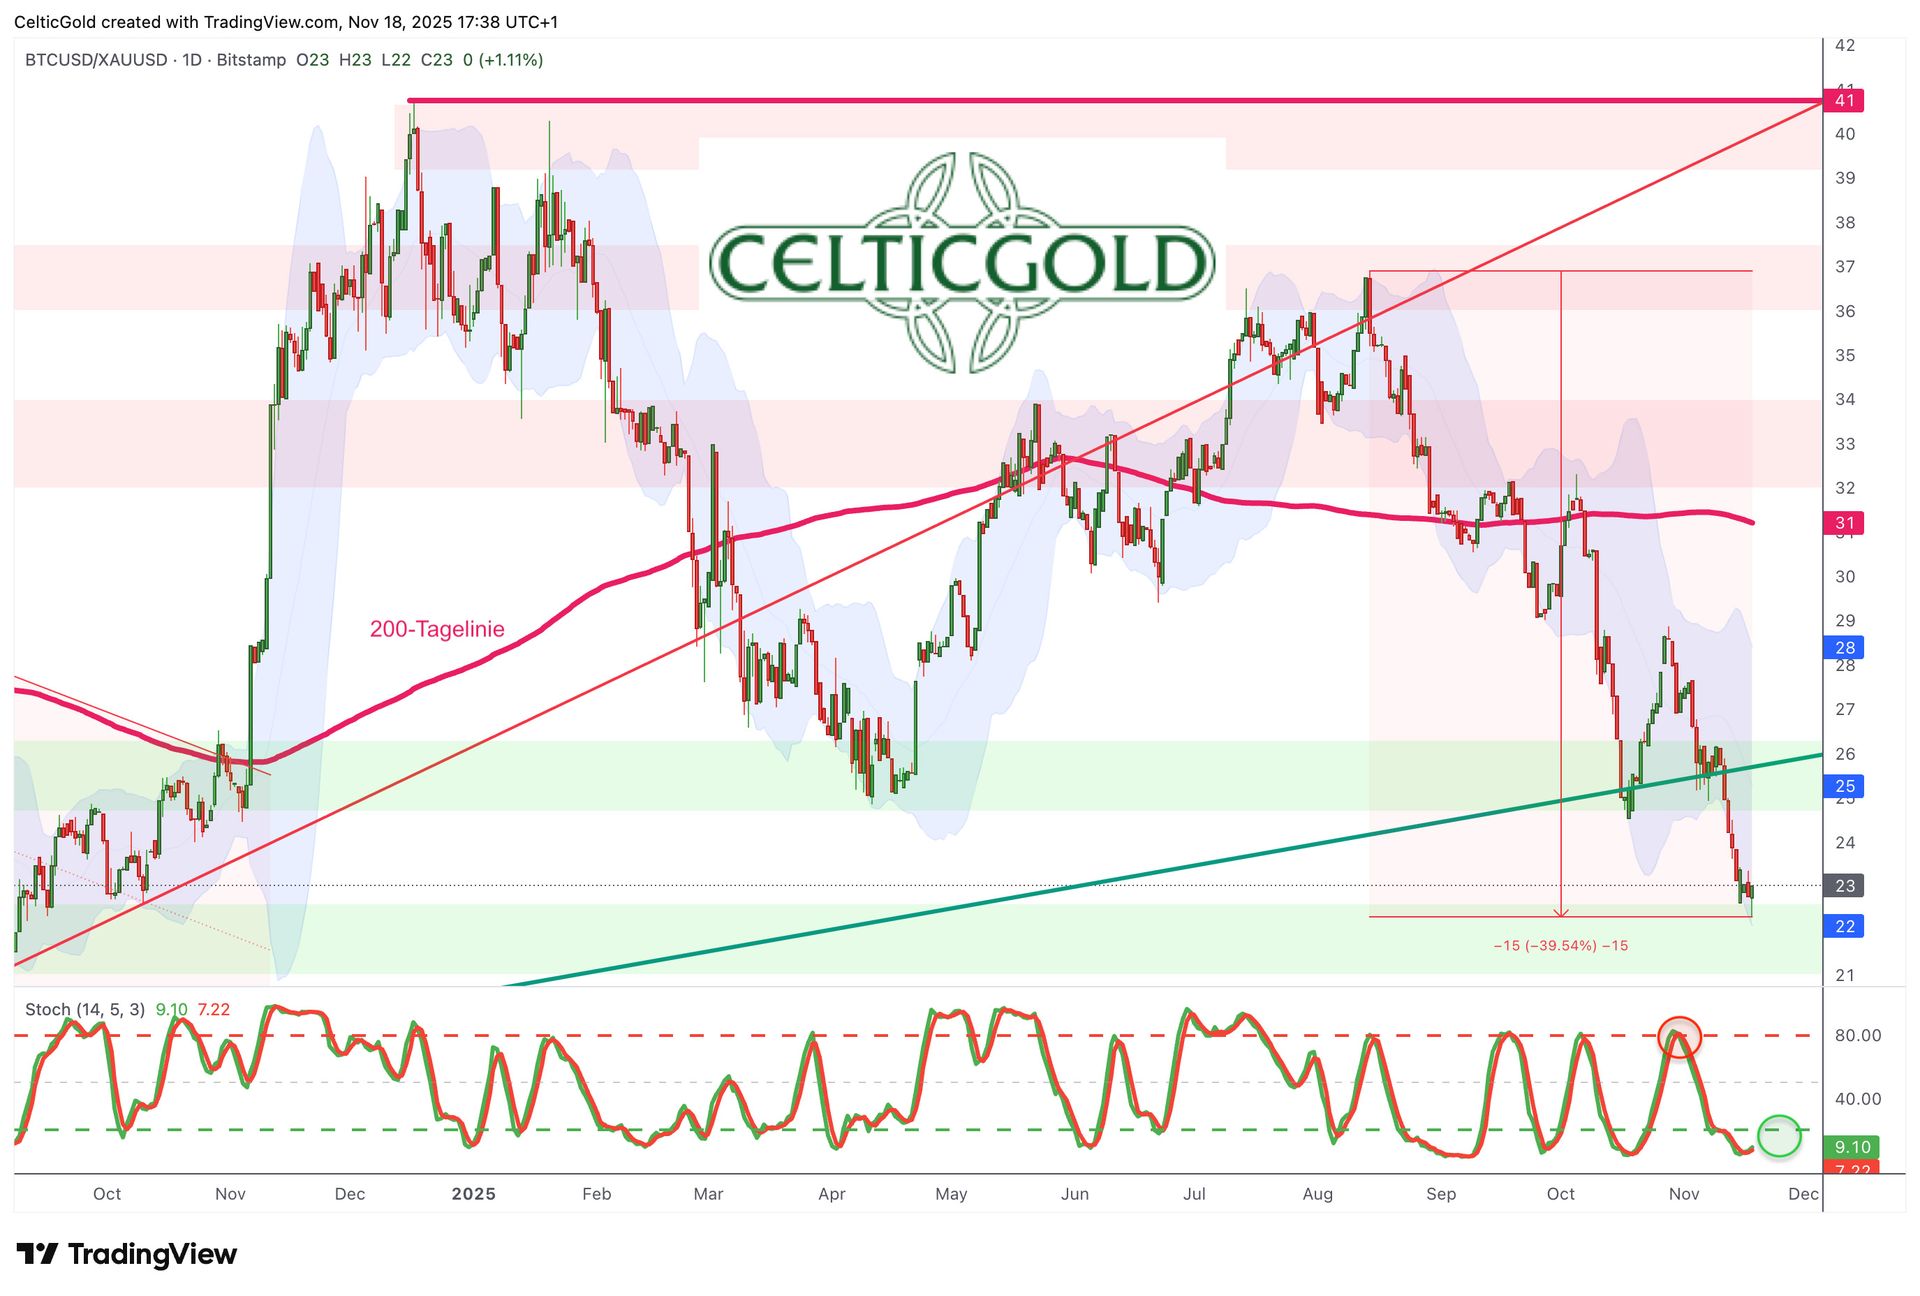
Bitcoin/Gold-ratio, daily chart as of June 1st, 2025. Source: Tradingview
With Bitcoin at about USD 86,400 and gold at roughly USD 4,130 per ounce, one Bitcoin currently equals around 20.9 ounces of gold. Conversely, an ounce of gold costs about 0.047 Bitcoin. Bitcoin has plummeted more than 40% against gold since the last trend reversal on 14th August.
Gold hit a new all-time high of USD 4,381 in October due to central bank purchases, geopolitical tensions, and inflation fears, while Bitcoin has fallen roughly 36.2% since its own peak.
This massive outperformance by gold highlights the current risk-off environment: investors are fleeing to safe-haven assets while risk assets like Bitcoin are being severely punished. Amid this great rotation, gold is outperforming almost everything, a trend likely to continue, regardless of any Bitcoin or tech rebounds, for the next one to two years.
Short-term, however, the oversold stochastic on the daily and weekly Bitcoin/Gold ratio should soon trigger a reversal in Bitcoin’s favour. Given the extreme fear (Fear & Greed Index at 11), seasonally strong November–January pattern, and shifted 2025 cycle, the odds of experiencing a turning point right now, with the ratio recovering toward approximately 30, are significantly rising.
In summary, the Bitcoin/Gold ratio is heavily oversold and suggests a recovery move in Bitcoin’s favour.
6. Macro Update – Capital Rotation in Favour of Gold Continues
Global financial markets stand at a historic turning point. The decades-long credit cycle, fueled by zero rates, liquidity surges, and financial innovation, appears to be ending naturally. Early cracks are emerging in key stock indices, top US tech stocks (“Magnificent Seven”), and the crypto market. Euphoria is giving way to nervousness, momentum to skepticism, and capital is quietly but firmly heading back to a millennia-old refuge: gold.
Credit Bubbles and Late-Cycle Psychology
Signs of an inflating credit bubble are unmistakable. In the US, margin debt has climbed to a record over USD 1.18 trillion—a clear marker of speculative excess. Stock prices, especially in tech, have long departed from fundamentals, with fashion trends mattering more than value (“meme-coins” as a case in point). Yet confidence is more fragile than ever: Bitcoin, the ultimate “easy money” expression, has lost almost 30% in six weeks.
Repo Markets as Early Warning
Simultaneously, stress in the US repo market is flashing warning signs as short-term funding rates swing nervously—classic symptoms of shrinking liquidity. The Federal Reserve’s planned end to quantitative tightening (QT) on December 1 is not a sign of strength, but a desperate attempt to avert a bigger crash. Liquidity is drying up while global debt surges. Risk assets are hit first when liquidity is lacking.
Inflation as “Silent Confiscation”
The core issue remains the structural imbalance between debt and productivity. Global broad money (M2) has reached a record USD 137 trillion, making any claim of monetary normality absurd. The result: persistent inflation, with real assets losing value and investors seeking tangible assets, particularly gold, which benefits more by holding its value while all else is shrinking.
The Turning Point in Investor Behaviour
While some market players still believe in Wall Street’s “soft landing,” major investors are reallocating. Stan Druckenmiller’s move from US equities to real assets and structural growth themes is telling. Central banks worldwide continue to hoard precious metals.
End of the “Everything Bubble” Era?
The last few years saw the so-called “Everything Rally” where stocks, bonds, cryptos, real estate, and art all rose in tandem. But this correlation was artificial, driven by credit expansion. Now, rotation signals a new order: where substance alone will endure. Gold acts as a valuation anchor in a world that has largely lost touch with real economics.
Politically Induced Crisis of Confidence
Alongside market dynamics, mistrust in the political manageability of the financial system is growing. State interventions—like digital central bank currencies or asset registers—inspire fears of creeping expropriation. As freedoms and money become ever more intertwined, precious metals stand not just as investments, but as the last vestige of personal sovereignty.
Gold as a Mirror of Geopolitics
Gold’s strategic weight is rising in the global context too. The West faces budgetary overreach, while emerging economies use gold to break away from the US dollar. China, India, and Russia are consistently buying physical reserves and building modern payment infrastructure for gold-backed systems. This points to a multipolar financial world where precious metals regain monetary significance.
Retreat to the Tangible
After decades of relying on “paper money comfort,” investors are rediscovering the virtue of the tangible. In times of crisis, physical gold has the one property that no paper promise can offer: finality. Unlike Bitcoin or treasuries, its value is not contingent on anyone’s solvency or accessibility.
Between Liquidity Trap and Crisis of Confidence
There is also a growing deflation risk if credit expansion stalls. In a system that generates growth only via new debt, every liquidity squeeze turns existential. Central banks are trapped: printing more money means more inflation; printing less means systemic collapse. Either way, gold wins as a hedge against loss of control.
Historical Parallels and Strategic Outlook
Whether the parallel is to the 1920s or 1970s, the pattern repeats: over-indebtedness, displacement of the real economy, loss of trust, and ultimately, flight to metals. The rotation into gold is not a fad but a return to economic reason. The longer the debt-based system is prolonged artificially, the harsher the adjustment will be.
Markets Force the Next Rate Cut
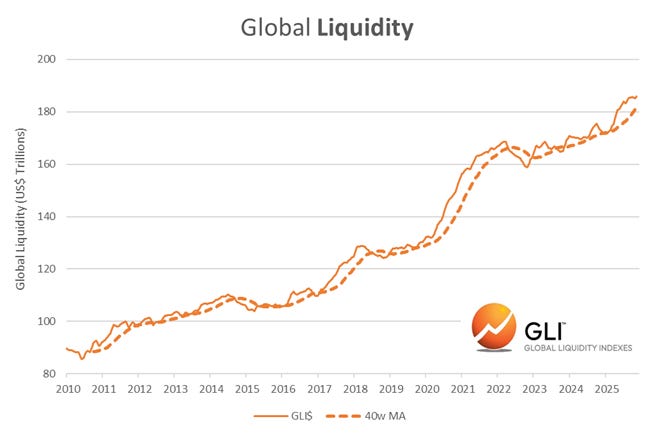
Global Liquidity, as of November 17th, 2025. Source: Michael Howell
For farsighted investors, now is the time for preparation, not panic, as the “playing for time” policy approaches its limits. While the Fed ends QT on 1st December, the US readies another USD 2,000 stimulus payment per citizen. Japan’s package amounts to USD 110 billion, China’s to over USD 1 trillion. Canada is also returning to quantitative easing, and global rate cuts have topped 320 within two years. Money supply records new highs.
These measures signal not stabilisation but the forced capitulation in the face of an imminent credit crunch. The longer collapse is delayed, the more painful the outcome. The markets are dictating the path back to cheap money and the inevitability of a new inflation wave.
Gold Will Continue to Outperform Bitcoin
Bitcoin and especially gold & silver are the last bulwarks against this coming paper money flood. As paper assets like stocks, bonds, and insurance lose substance and evaporate in the coming reset, precious metals retain their value, shielded from both expropriation and the control of digital central banks. It is expected that gold and silver will reach new record highs after their current pauses, again outpacing all paper investments.
At the same time, global liquidity expansions should create a favorable environment for Bitcoin as well. The current capitulation in the crypto market—bigger than the COVID crisis or the FTX disaster—has cleared the excess leverage, paving the way for Bitcoin’s next bull run. In nominal terms (USD/EUR), significant gains are expected, but measured in gold, Bitcoin is likely to remain flat, underscoring the ongoing monetary dominance of precious metals.
In essence: Once the US pulls the trigger on another round of quantitative easing, the stage is set for the final act—ending in an inflationary spiral reminiscent of the Weimar hyperinflation.
Conclusion: Bitcoin – Panic Triggers Turning Point
After a steep plunge, the crypto market is in crisis, characterized by high uncertainty and an oversold state. The current capitulation in Bitcoin is even greater than during the COVID or FTX episodes. Nonetheless, the purge of speculative excess now sets the foundation for a sustainable recovery that could see Bitcoin not only climb back over USD 100,000 in the coming months but also target the 200-day moving average around USD 105,000 to 110,000.
In precious metals, the bull market should resume by mid-December or, at the latest, January, driven by geopolitical tensions, a flight to safe havens, and the unresolved global debt crisis. While Bitcoin is likely to appreciate again in USD and EUR terms, its value in gold will at best remain stable, underlining the continued role of precious metals as monetary anchors.
The long-term capital rotation continues to favor gold and silver as robust hedges against looming inflation and increasingly fragile paper assets like stocks, bonds, and insurance. Fresh liquidity injections and expected stimulus programs worldwide are pushing central banks back toward rate cuts. The next tide of fiat money will inevitably fuel another inflation wave. These conditions support another strong surge in precious metal prices in the coming months and years—a trend that will leave most traditional financial assets trailing behind.