Year-to-date, bitcoin is currently up more 100% against the USD. Despite the first few months until April, Bitcoin has been mainly caught in a consolidation over the course of this year. However, since the low on July 19th the bulls have been able to push prices to a new all-time high. Now they do hold all the trump cards in their hands for a strong finishing of 2021. Bitcoin – New all-time highs in sight!
Review
Our last Bitcoin analysis from September 28th was clearly way too pessimistic. Although especially the stock markets came under significant pressure in the following two weeks, Bitcoin was able to turn around at US$39,750 after bottoming out for several days and has since then rallied strongly. At the same time, the collapse of the Chinese real estate market is by no means resolved. Instead, it continues to smolder in the background and hangs like a sword of Damocles over the financial markets.
However, Federal Reserve Chairman Jerome Powell’s announcement that they “have no intention of banning cryptos” together with the heavily oversold situation led to a clear trend reversal for Bitcoin at the beginning of October. The ensuing rally saw Bitcoin prices explode by 73.8% in just six weeks to a new all-time high of US$69,000 (Bitstamp). Since November 10th, this steep rise has now been corrected and Bitcoin temporarily pulled back by 22.5% down to US$53,308.
Over the last four days, Bitcoin was able to recover significantly from this low and traded back above US$59,000. Currently Bitcoin is consolidating once again between US$56,000 and US$58,000.
Overall, after a six-month breather the crypto bull market has been clearly confirmed with the new Bitcoin all-time high in November! Bitcoin – New all-time highs in sight!
Technical Analysis For Bitcoin in US-Dollar
Bitcoin Weekly Chart
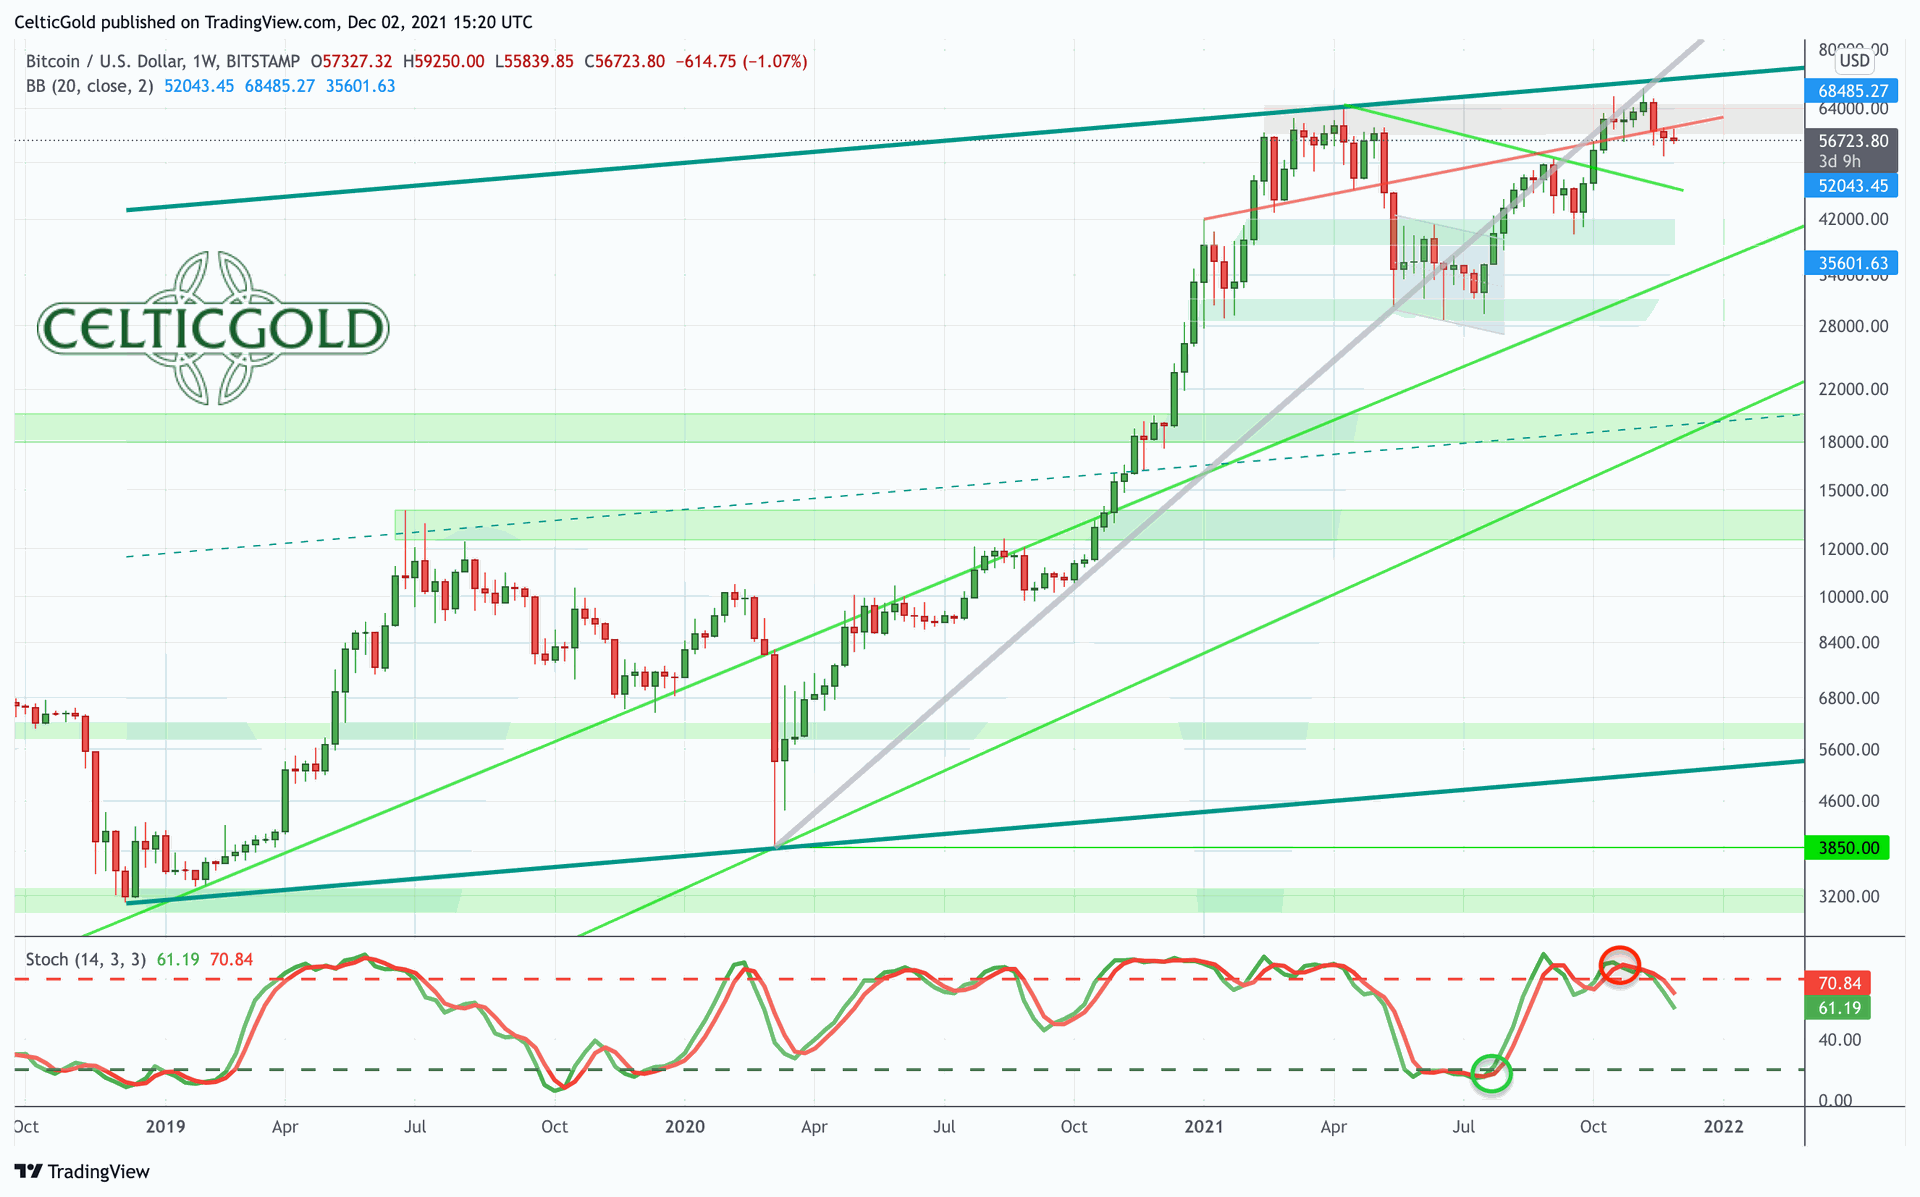
Bitcoin in USD, weekly chart as of December 2nd, 2021. Source: Tradingview
Since the spring high on April 14th at US$64,895, bitcoin has been in a consolidation phase. Only with the new all-time high on October 20th, the bull market was confirmed and resumed. Meanwhile, the latest new all-time high sits almost exactly at US$69,000, while prices are currently trading a good US$12,500 USD or 18% below that. Thus, not much is missing for a final breakout to the upside.
However, the stochastic oscillator on the weekly chart currently provides a sell signal, while the upcoming march through the strong resistance zone between US$60,000 and US$70,000 will likely be a tour de force for the bulls. On the downside, however, a drop below the last low at US$53,308 would probably activate a larger pullback. In that case, a retracement back towards the 200-day moving average line (US$46,101) as well as the old downtrend-line (currently also around US$46,000) would become very possible. So far, however, there are only very few technical arguments for this bearish scenario on the table.
In total, it is currently much more likely that bitcoin will gradually push to the upper end of the broad resistance zone (US$60,000 to US$70,000) over the coming weeks. On top, the breakout above US$70,000 should unleash massive momentum and spark a steep rally towards the round number of US$100,000. After all, bitcoin prices have been going through quite some compression and energy has been building up over seven months!
Bitcoin Daily Chart
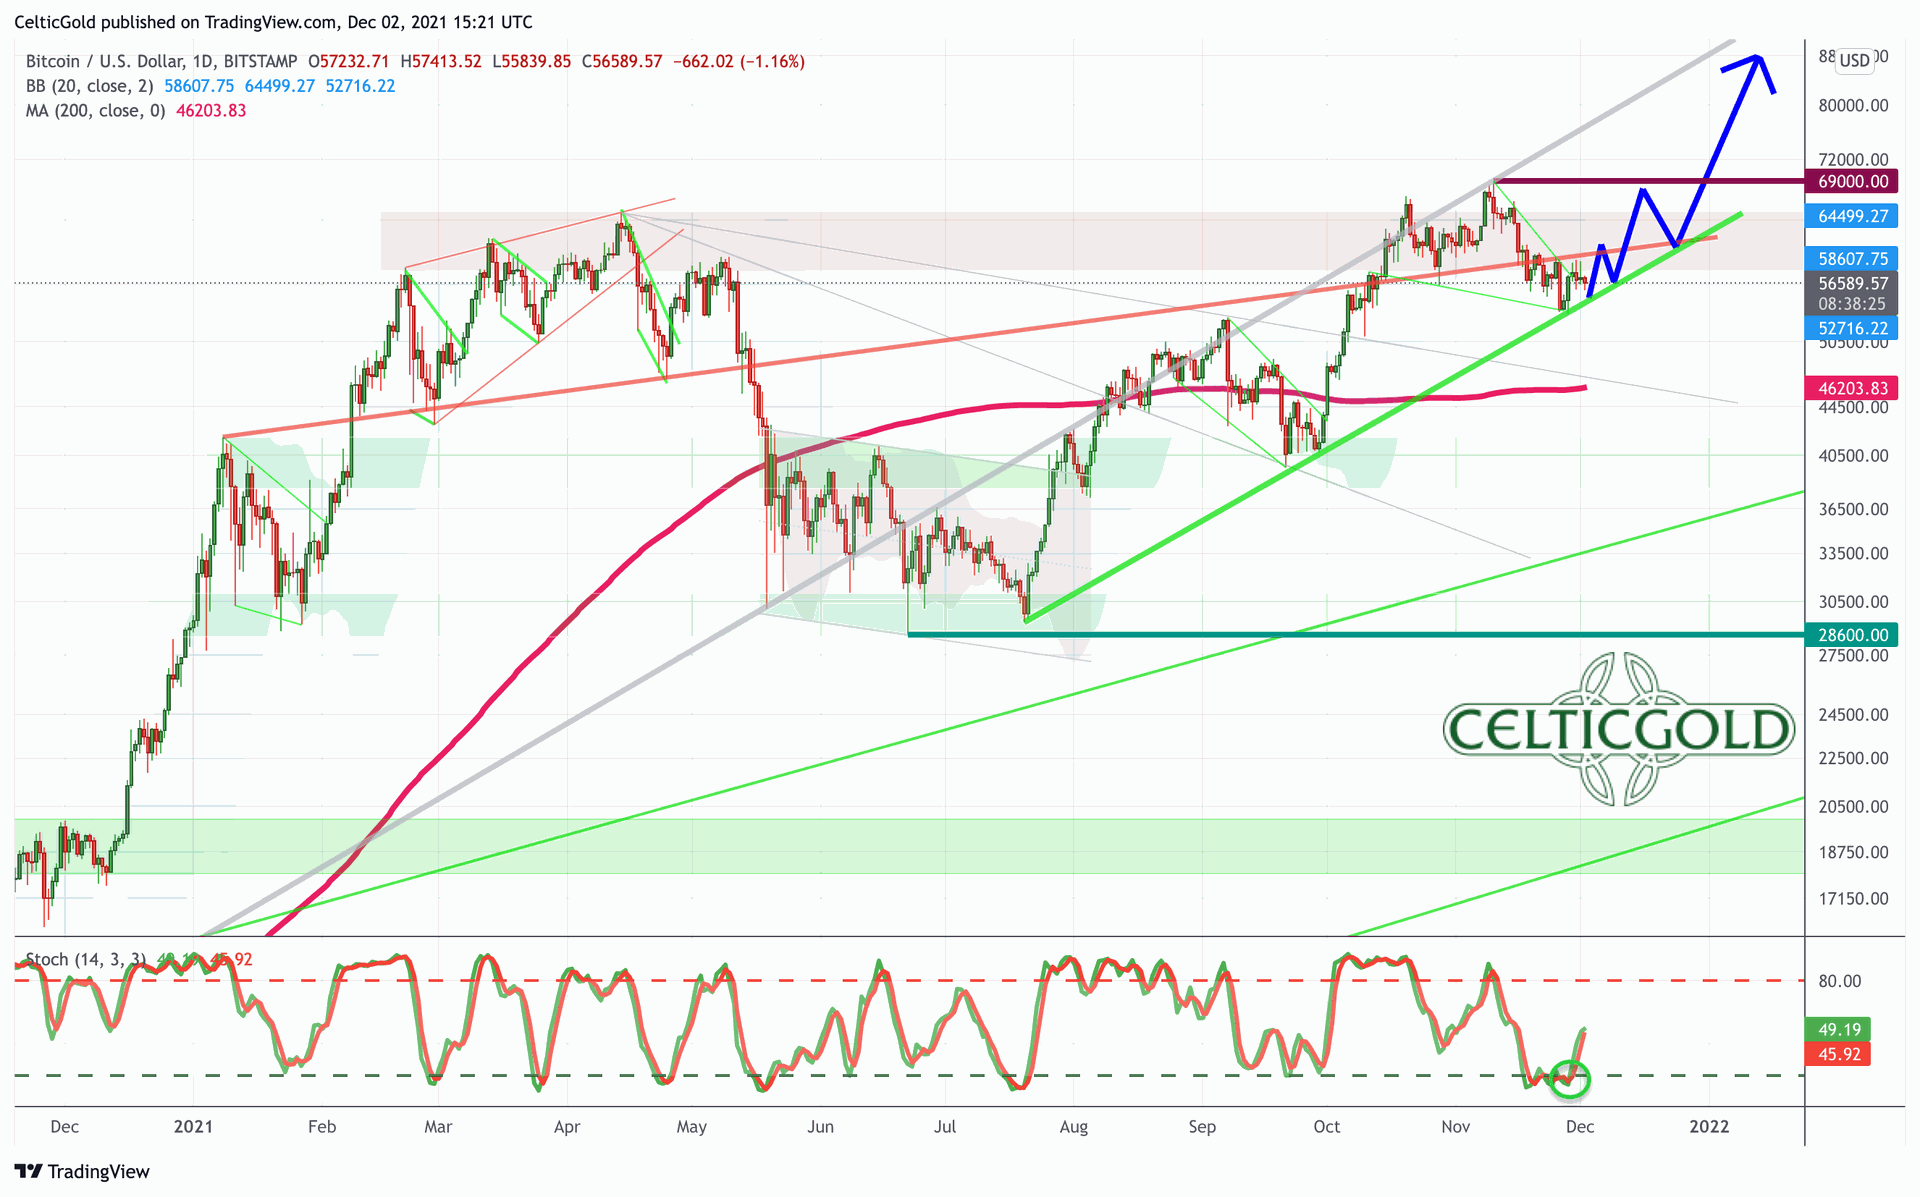
Bitcoin in USD, daily chart as of December 2nd, 2021. Source: Tradingview
On the daily chart, the set-up is already much more bullish, as the last pullback has created an oversold situation and a classic test of the uptrend-line of the last few months. Starting from the last low at US$53,308, bitcoin has already posted a first clear move up, which the stochastic oscillator confirms with a new buy signal. Now, the daily chart would have enough air again to advance further into the broad resistance zone (US$60,000 to US$70,000).
In summary, the daily chart is bullish. On the way up, a connecting line of the last few months (US$59,500 to US$60,000) as well as the upper Bollinger Band (US$66,075) will likely proof to be a strong hurdle that will take some time.
Sentiment Bitcoin – New all-time highs in sight!
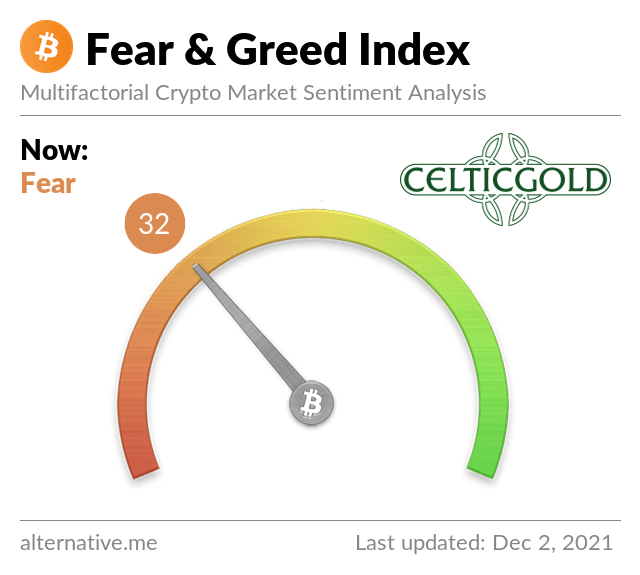
Crypto Fear & Greed Index as of December 2nd, 2021. Source: Crypto Fear & Greed Index
The pullback over the last three weeks provided at least a rudimentary shakeout in the crypto sector. The euphoria from early November is certainly gone. However, extreme fear levels did not occur in the pullback.
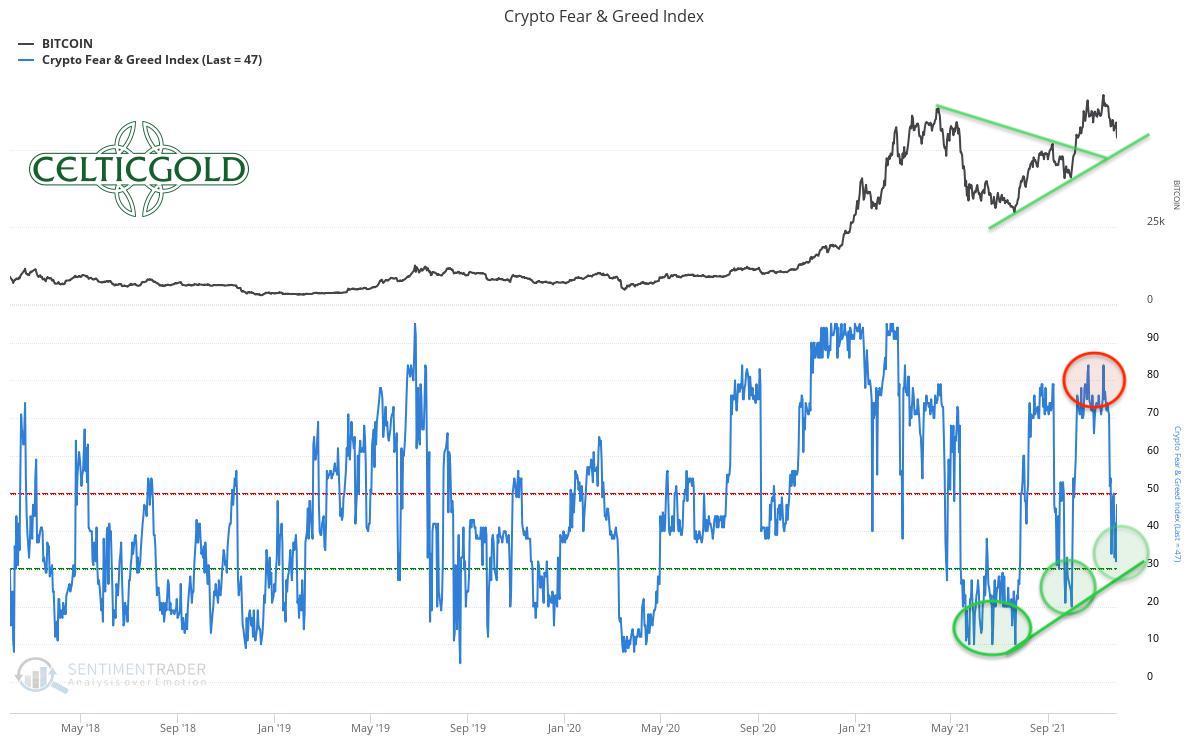
Crypto Fear & Greed Index long-term as of November 29th, 2021. Source: Sentimentrader
In the bigger picture, the three pullbacks during this year (from April 4th to June 21st = -55%, from September 6th to September 21st = -25%, and from November 10th until November 28th = -22.5%) each completely cleared the sentiment and did create a contrarian buying opportunity. The last two pullbacks were significantly smaller in percentage terms, which also means that the sentiment adjustment was less pronounced. At the same time, the thesis can be built that buyers are now coming back into the market at an earlier stage. Hence, a merciless and deep correction will only become possible again after a very extreme sentiment exaggeration on the upside.
Bitcoin – New all-time highs in sight!
In the short term, the sentiment has likely turned since the sell-off last week. The lows for Bitcoin should therefore have been seen on Sunday at US$53,308. In the next step, the sentiment pendulum should now swing back into the other direction. This should bring a sentiment high during the coming months. Overarching, sentiment analysis continues to suggest an extreme and parabolic exaggeration phase on the upside has still to come.
Sound Money: Bitcoin vs. Gold
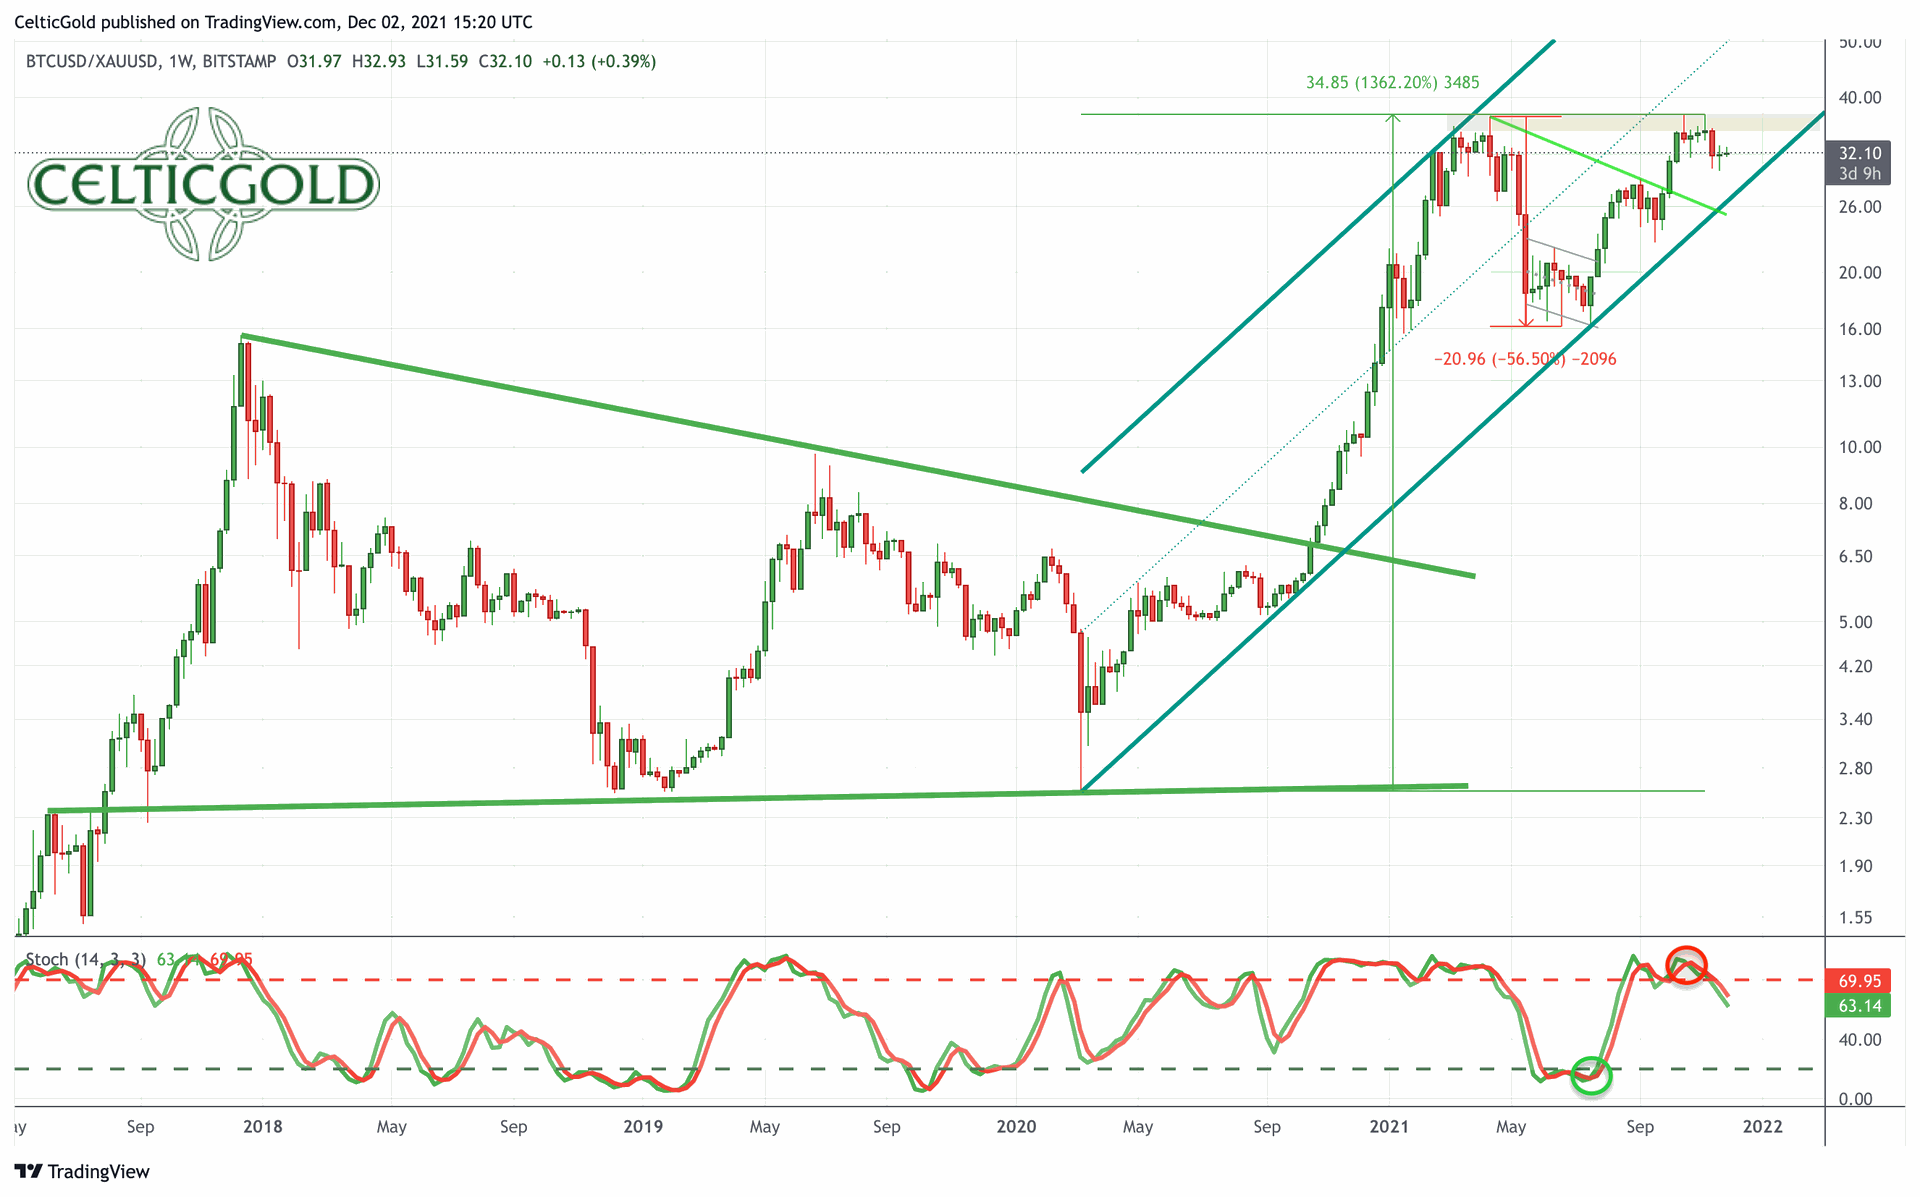
Bitcoin/Gold-Ratio as of December 2nd, 2021.Source: Tradingview
With current prices of around US$$57,000 for one Bitcoin and $1,770 for one troy ounce of gold, the Bitcoin/Gold-Ratio is trading at 32.2. That means you have to pay more than 32 ounces of gold for one Bitcoin. Put another way, one troy ounce of gold currently costs about 0.031 Bitcoin.
Once again, gold has depreciated mercilessly against Bitcoin over the past two months. In the meantime, the Bitcoin/Gold-Ratio has already reached its highs from spring at around 37. The trend in favor of Bitcoin is intact despite the pullback in recent weeks. Moreover, the ratio is running into an ascending triangle, whose upward resolution is probably only a matter of time. If it comes to that, Bitcoin could easily rise to 80 to 95 ounces of gold.
You want to own Bitcoin and gold!
Generally, buying and selling Bitcoin against gold only makes sense to the extent that one balances the allocation in those two asset classes! At least 10% but better 25% of one’s total assets should be invested in precious metals physically, while in cryptos and especially in bitcoin one should hold at least between 1% and 5%. If you are very familiar with cryptocurrencies and bitcoin, you can certainly allocate much higher percentages to bitcoin on an individual basis. For the average investor, who is primarily invested in equities and real estate, a maximum of 5% in the still highly speculative and highly volatile bitcoin is a good guideline!
Overall, you want to own gold and bitcoin since opposites complement each other. In our dualistic world of Yin and Yang, body and mind, up and down, warm and cold, we are bound by the necessary attraction of opposites. In this sense, you can view gold and bitcoin as such a pair of strength. With the physical component of gold and the pristine digital features of bitcoin you have a complementary unit of a true safe haven for the 21st century. You want to own both! – Florian Grummes
Over the coming months, Bitcoin should continue to outperform gold. While the bull market in crypto may stage its final parabolic run, gold and silver are still trapped in their consolidation/correction that has been ongoing since August 2020. Only once Bitcoin reaches a major top and gold at the same time ends its corrective cycle could the precious metals sector regain ground.
Macro Update: Inflation on the rise worldwide.
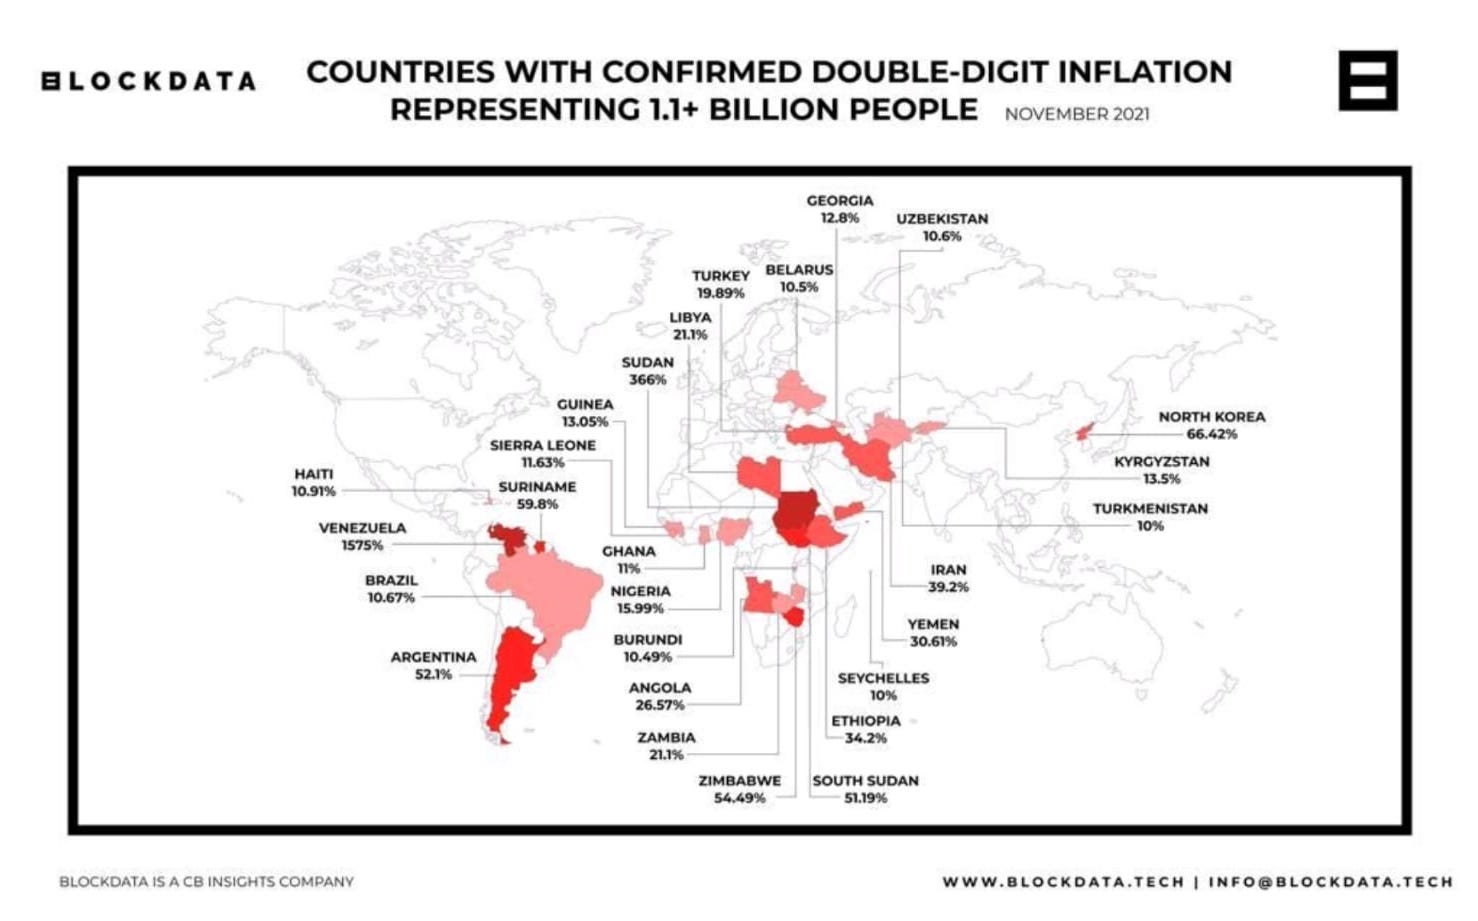
Countries with double-digit inflation in November 2021. ©Blockdata
In addition to the boiling problems surrounding China’s real estate sector and the never-ending Corona crisis, rampant inflation remains the main topic in the financial markets. In mid-November, 27 countries around the world had double-digit inflation rates! More than 1.1 billion people are affected by this, especially in poor countries.
Inflation in Germany from 29.November 2021. ©Holger Zschaepitz
In Germany, the official inflation rate has risen to its highest level in more than 30 years. Measured by the harmonized consumer price index, inflation was at 4.6% in October and already at 5.2% in November. In December, it could rise even further to over 5.5% or even 6%. The last time inflation reached such heights was in the early 1990s. At that time, however, the Bundesbank’s interest rate was at 8.6%. Today, the ECB’s interest rate is at 0%, expropriating savers in real terms. Especially in Germany, this development is a sensitive issue. Almost every German has heard the stories of his ancestors about the hyperinflation in 1923. Back then the savings of the vast majority of Germans were mercilessly destroyed.
Inflation in Spain on November 29, 2021. ©Holger Zschaepitz
In Spain, inflation is also accelerating to its highest level in almost 30 years due to rising food prices. Here, the consumer price index rose by 5.6% in November, the highest level since September 1992. Due in part to ongoing supply bottlenecks across the European continent, inflation expectations were once again clearly exceeded.
ECB balance sheet total, as of Nov. 19, 2021 ©Holger Zschaepitz
Meanwhile, in its ivory tower in Frankfurt, the ECB continues to expand its balance sheet. As of November 19th, a new record high of 8,442.3 billion EUR was reported. Total assets increased by another 27.9 billion EUR within a week. The ECB’s total assets are now equivalent to 81% of eurozone GDP, compared to 37.4% at the Fed, 41% at the Bank of England and 134% at the Bank of Japan. Central bankers also continue (and just as they did in the 1920s) to deny a link between balance sheet expansions and ever-increasing inflation.
Overall, an end to the loose monetary policies around the world is impossible. Likewise, supply bottlenecks will remain in place for the time being. As a result, inflation will continue to be fueled both monetarily and by shortages. On top, the dangerous psychological spiral of rising inflation expectation is already in place and will boost inflation even more.
Bitcoin is diametrically opposed to this macro dilemma and represents hope for more and more people on this planet. And so, since the end of September, it has once again disproved all doubters. Despite the numerous headwinds, bitcoin sailed to a new all-time high of US$69,000. Just in time, we abandoned our overly pessimistic stance at the beginning of October and accepted the market’s word.
Now, Bitcoin prices are facing the large and decisive resistance zone between US$60,000 and US$70,000. The march through this cluster could succeed quickly. In the context of this year’s character, however, it would be more likely that this undertaking could drag on a bit. However, as soon as the range between US$65,000 and US$70,000 is being approached, the fulminant breakout to the upside can no longer be stopped.
All in all, new all-time highs are already in sight. Likewise, the expectation remains that the bull market, which has been running since March 2020, can only end in a parabolic “Grande Finale”. In the short term, there might still show up some confusing swings, but the low at US$53,308 should hold.
Feel free to join us in our free Telegram channel for daily real time data and a great community. If you like to get regular updates on our gold model, precious metals and cryptocurrencies you can subscribe to our free newsletter.
