Bitcoin’s recent decline highlights a deeper shift unfolding beneath the surface of global markets: the growing tension between optimistic financial narratives and tightening physical constraints. As liquidity fades and energy, capital, and geopolitical realities take centre stage, Bitcoin is increasingly acting as an early signal of this changing macro regime.
1. Review
Starting from the low of USD 59,930 on 6th February, and following a two-month base-building phase, Bitcoin indeed managed the anticipated recovery back to its declining 200-day moving average in early April. This move was also driven by strong inflows into Bitcoin spot ETFs (approximately USD 2.44 billion net in April) as well as growing institutional interest.
1.1 ETF-Driven Recovery Fades
However, the upward movement already came to a halt at USD 82,833 on 6th May. Since then, the bears have regained control, pushing Bitcoin down to as low as USD 59,104.
The primary drivers were record outflows from U.S. spot Bitcoin ETFs, including a nine-day streak totalling around USD 2.8 billion, as well as the highest monthly net outflows in May (approximately USD 2.3–2.85 billion). This development effectively erased April’s inflows and added further downward pressure amid a broader risk-off environment.
1.2 Liquidity Drain and Macro Pressure
The decline was reinforced by ongoing geopolitical tensions, particularly related to the U.S.–Iran conflict, rising U.S. bond yields, a stronger U.S. dollar, and capital rotation into AI and technology stocks. Capital was likely withdrawn on a large scale from liquid risk assets such as Bitcoin to finance upcoming mega equity rounds, including SpaceX, OpenAI, and others. In other words, investors are even selling long-term positions like Bitcoin to free up liquidity for the largest IPO wave since 2000.
Overall, price action remains clearly bearish, especially as the temporary recovery did not even reach the 38.2% retracement (USD 85,064) of the entire decline from the all-time high of USD 126,272.
1.3 Structure vs. Leverage – Survival in a Bear Market
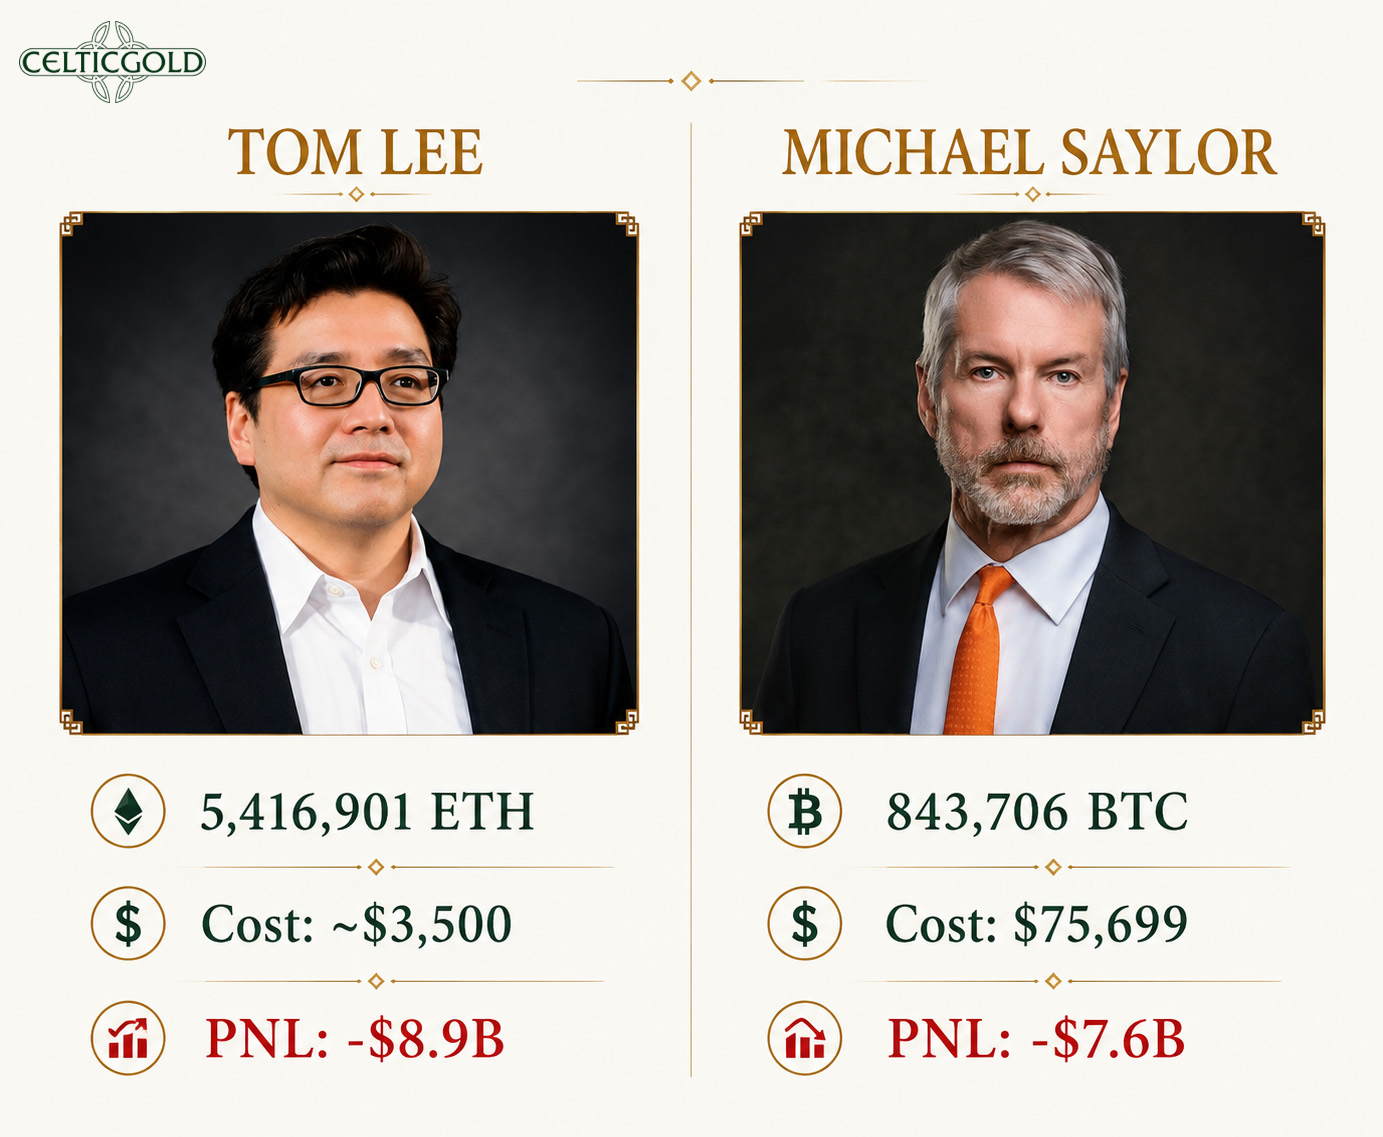
Tom Lee vs. Michael Saylor – Who Will Win, 3rd June 2026. Source: Dani R. Escudero
The overarching downtrend since the October 2025 highs remains intact. It will be interesting to see how two of the sector’s most prominent figures handle ongoing losses and selling pressure. Tom Lee is betting on Ethereum via Bitmine, while Michael Saylor continues to bet on Bitcoin through Strategy. Both are sitting on massive unrealised losses in the billions. While Saylor manages a complex, dividend-driven structure with increasing financing pressure—and is even considering Bitcoin sales for the first time—Lee at least benefits from real cash flow through ETH staking, which offers somewhat greater stability in declining markets. Both pursue the same strategy—raising capital and accumulating scarce assets. However, in a bear market, structure matters more than vision: those who are not forced to sell will survive. At present, Lee’s model appears somewhat more resilient, while Saylor’s system is increasingly under strain.
2. Technical Analysis for Bitcoin in US-Dollar
2.1 Weekly Chart – Support Between USD 57,000 and 60,000
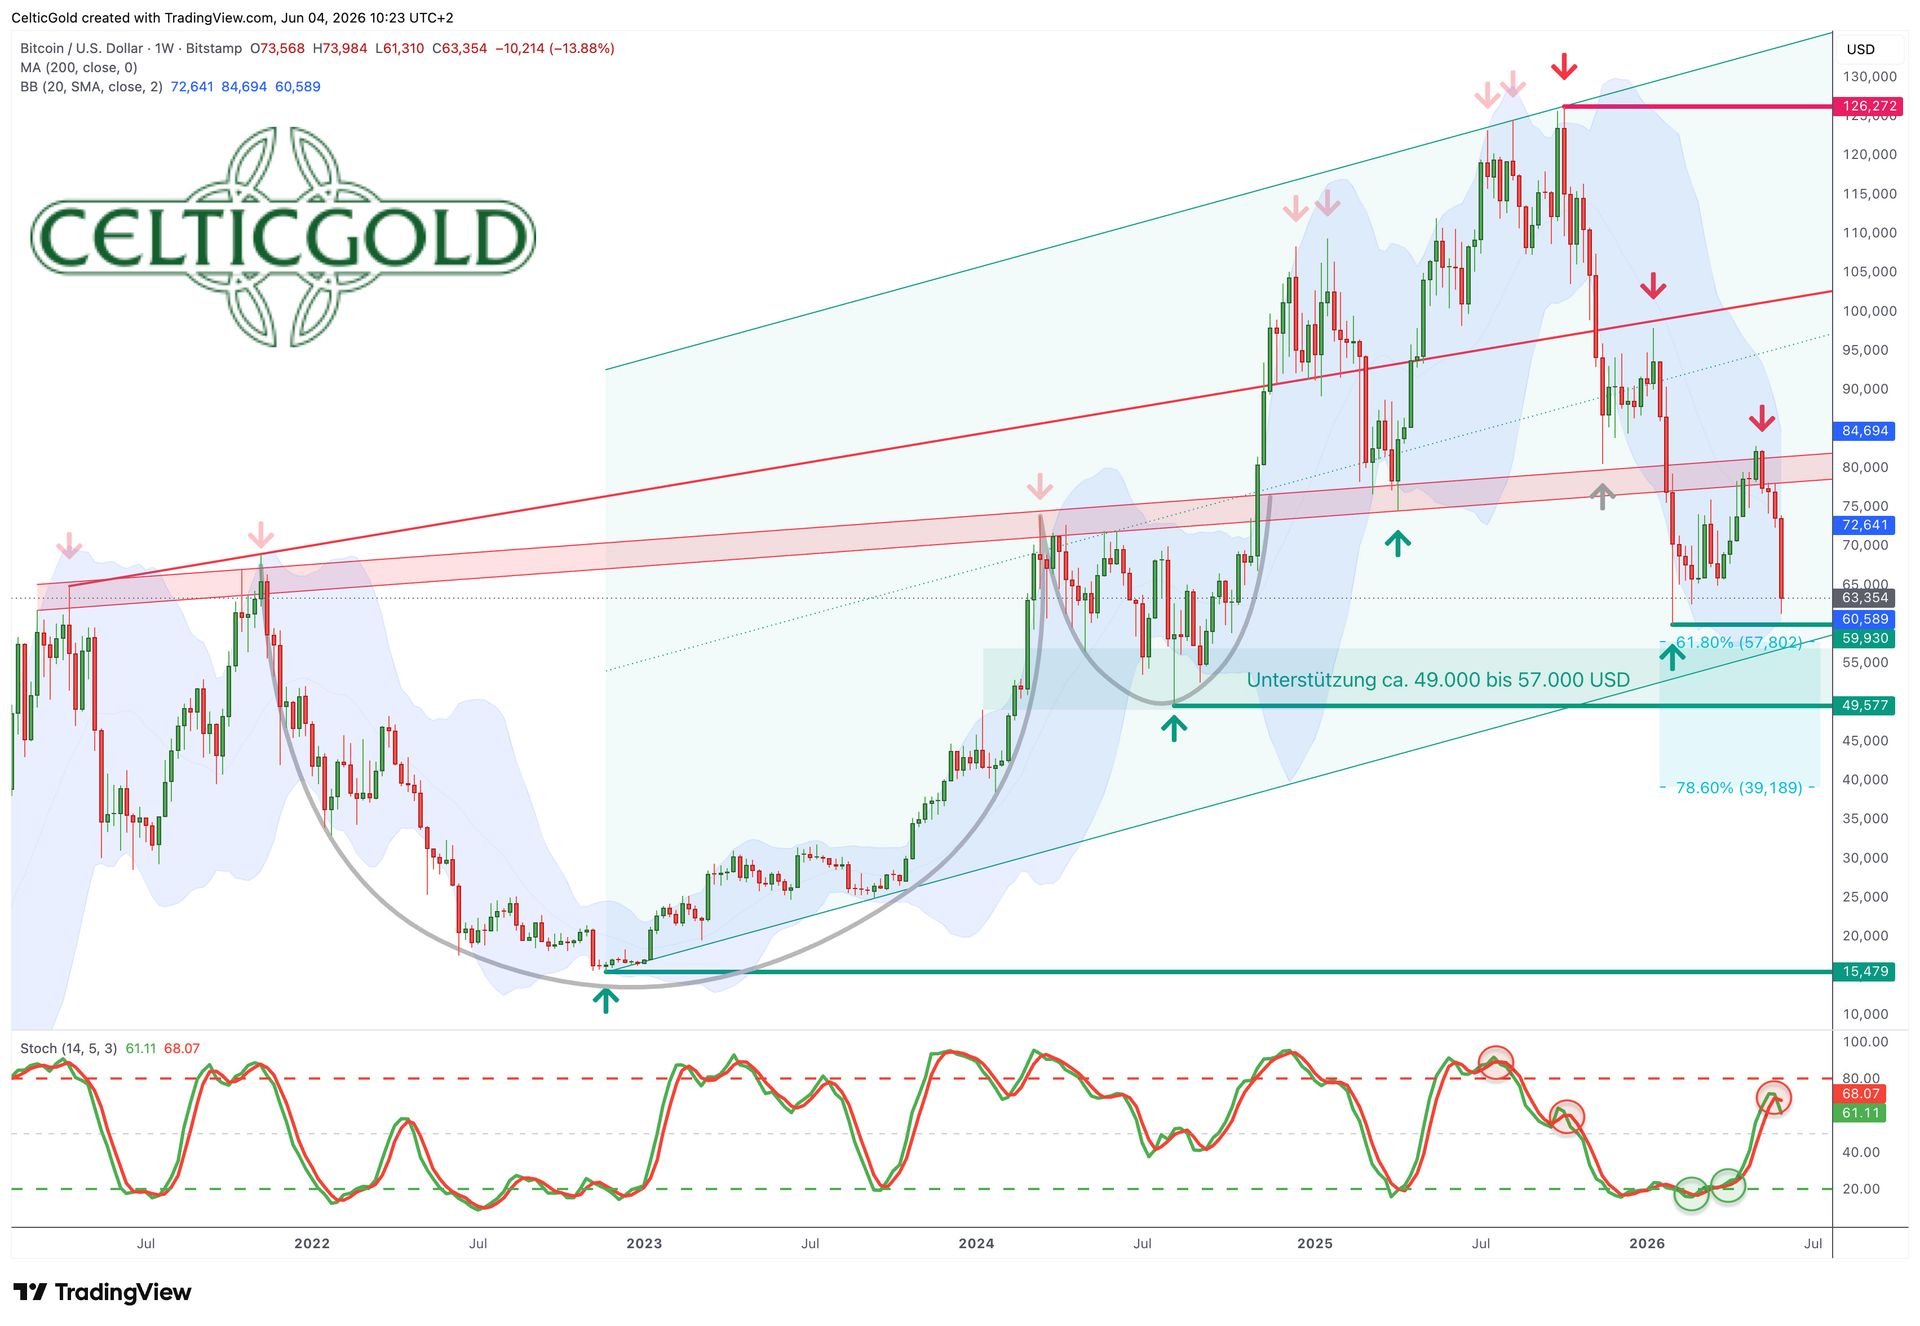
Bitcoin in USD, weekly chart as of 4th June 2026. Source: Tradingview
At a current price of USD 63,900, Bitcoin is roughly 50% below its all-time high of USD 126,272 from 6th October 2025. The entire seven-month decline must be interpreted as a clear correction following the preceding three-year rally. Interim recoveries have mostly reached only minimal targets and remained weak. The weekly chart therefore signals a sustained and deep phase of weakness—especially compared to the continued strength of technology and AI stocks.
The clear rejection at the former neckline of the cup-and-handle pattern has recently intensified the downtrend. Moreover, the psychologically important USD 70,000 level has been decisively broken. The February low of USD 61,310 has already been more or less retested.
While the lower Bollinger Band (USD 60,700) leaves limited room for further downside in the weekly chart, the broader upward channel still allows for a move towards approximately USD 57,000 over the coming days to weeks. This zone must be defended by the bulls; otherwise, further sell-offs towards USD 39,000–45,000 could follow during the summer.
The weekly stochastic oscillator has also turned downward again and still has significant room before reaching oversold territory.
Overall, the weekly chart remains strongly bearish and offers little hope for a sustainable recovery in the short term. A further decline towards and below USD 60,000 appears likely. Only a move above USD 80,000 would materially improve the technical outlook. Otherwise, further downside risks or a prolonged sideways phase into late summer should be expected.
2.2 Daily Chart – Oversold but Weak
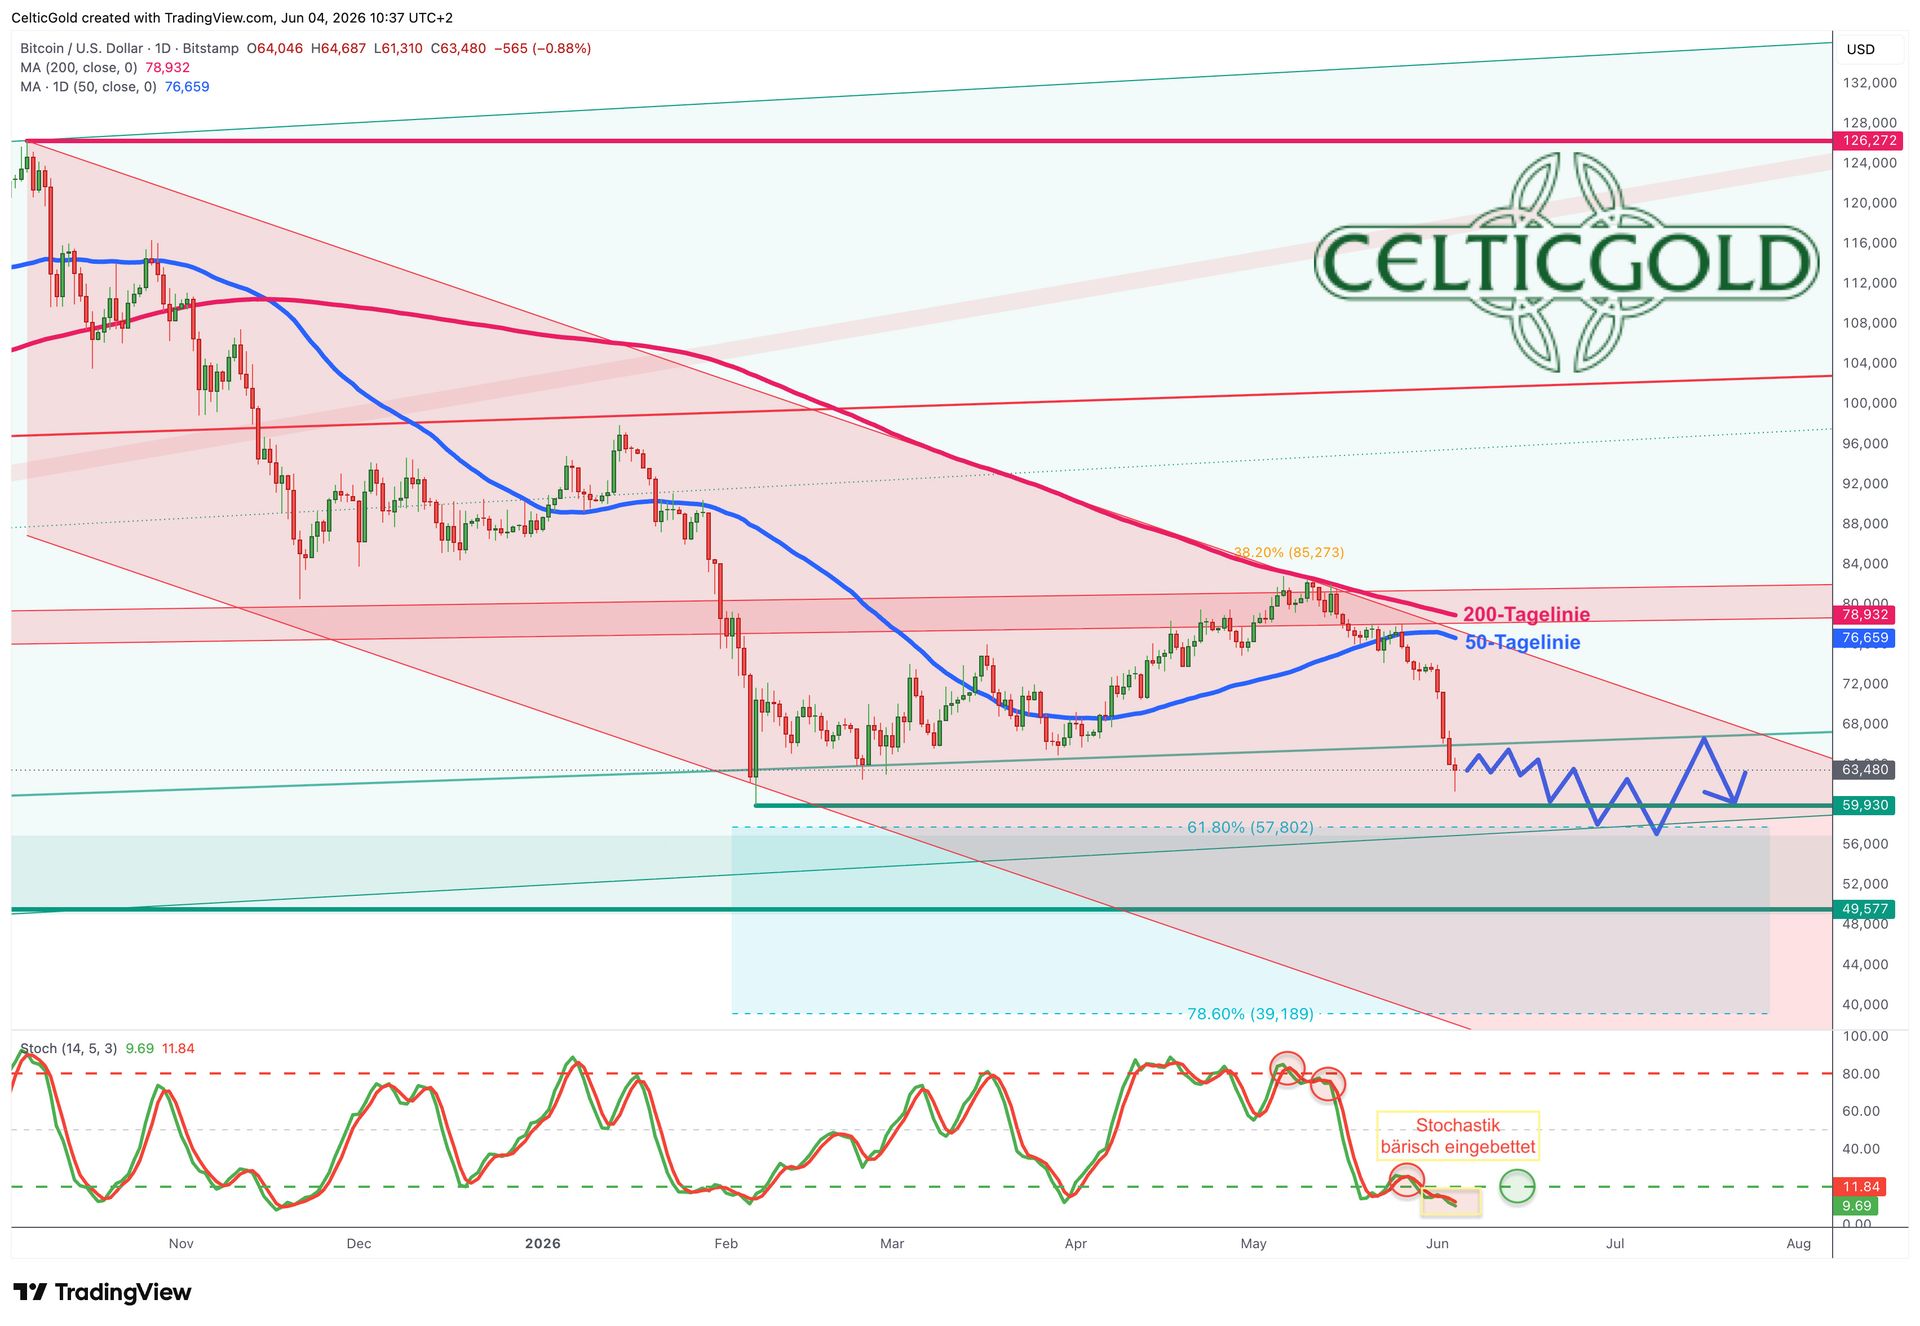
Bitcoin in USD, daily chart as of 4th June 2026. Source: Tradingview
On the daily chart, Bitcoin failed exactly as expected at the still rapidly declining 200-day moving average (USD 78,934). The 50-day moving average (USD 76,665) only briefly slowed the bears. This leaves the broad support zone around USD 60,000 as the key short-term level, which Bitcoin has already approached.
The strongly oversold daily stochastic is generally a positive signal, as it could trigger a sharp rebound at any time. However, concrete signs of such a move are still lacking. Instead, the two signal lines have remained below the 20 level for three consecutive days, meaning the indicator no longer signals oversold conditions but rather reinforces the ongoing downtrend.
In summary, while the daily chart is clearly oversold, it remains embedded in a bearish structure. Regardless of any short-term counter-moves, a break below USD 60,000 appears to be only a matter of time.
3. Market Sentiment – High Pessimism
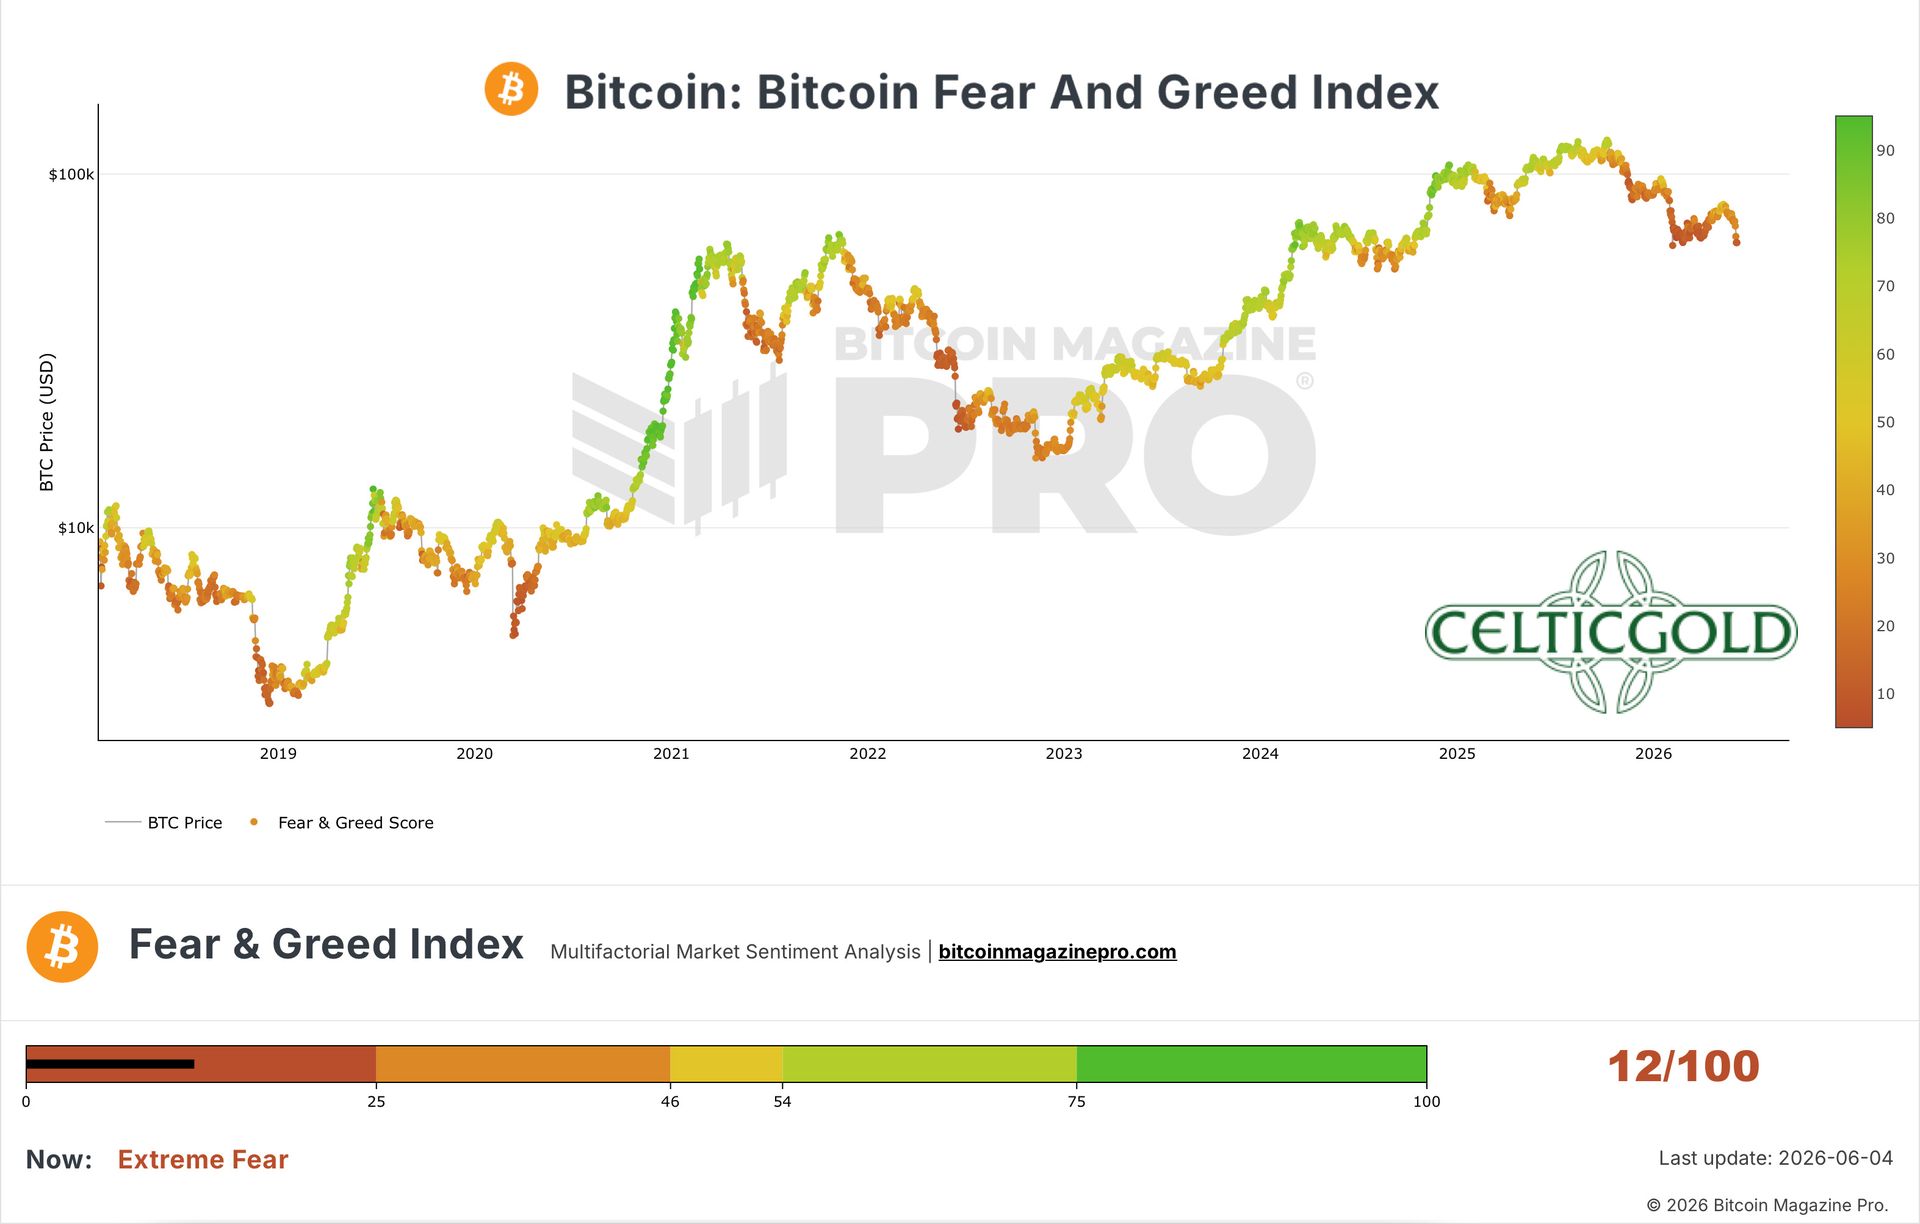
Crypto Fear & Greed Index, as of 4th June 2026. Source: Bitcoin Magazine Pro.
The Crypto Fear & Greed Index currently stands at just 12 out of 100, reflecting renewed panic and capitulation in the crypto sector. For contrarian investors, such extreme readings are an important signal for a potential rebound. Although the final bottom has most likely not yet been reached, sentiment analysis suggests a good probability of a recovery move, as confidence in Bitcoin is currently extremely low.
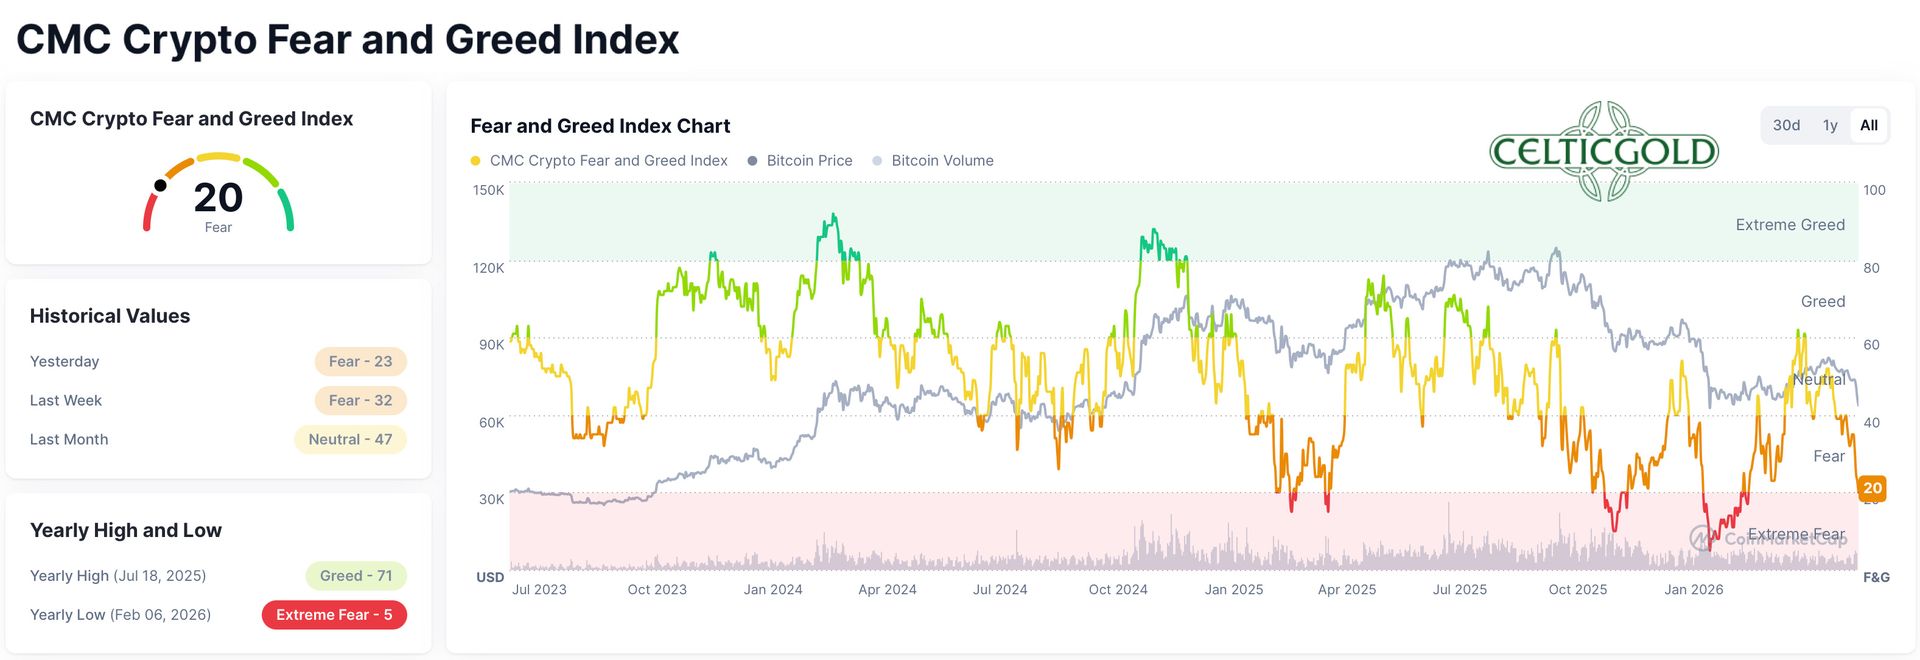
CMC Crypto Fear & Greed Index, as of 4th June 2026. Source: Coinmarketcap
The CoinMarketCap Crypto Fear & Greed Index, which reflects the broader crypto market, stands at 20 out of 100 and confirms prevailing pessimism. Indicators such as market volatility, momentum, social media activity, surveys, and Bitcoin trends are approaching contrarian buy zones.
Overall, sentiment analysis points to pronounced pessimism and thus signals the emergence of initial contrarian buying opportunities.
4. Seasonality – Weak Until Early October
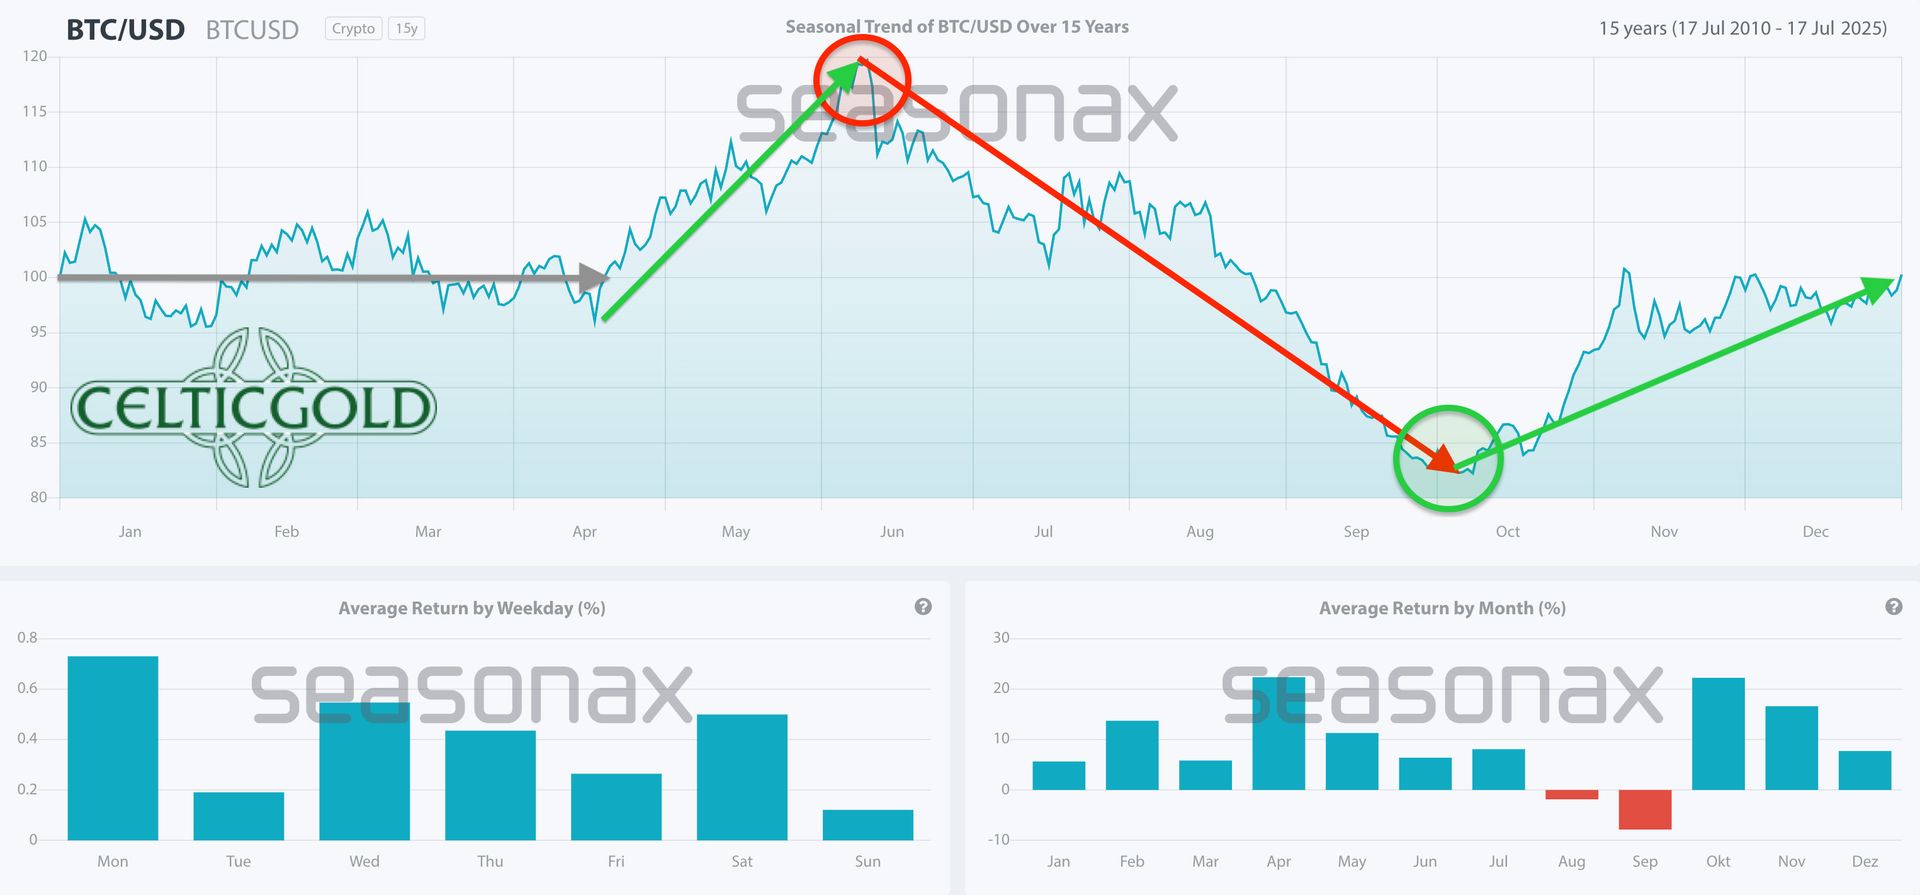
Bitcoin Seasonality as of 1st April 2026. Source: Seasonax
With the turning point on 6th May, this year’s recovery phase was significantly shorter than typical seasonal patterns would suggest. Based on the clearly defined high, a pronounced period of weakness lasting three to four months is now likely. Bitcoin typically finds its low between mid-September and mid-October before initiating a new upward trend.
Seasonality therefore argues for patience, as it clearly points towards a continuation of the correction.
5. Bitcoin vs. Gold (Bitcoin/Gold Ratio)
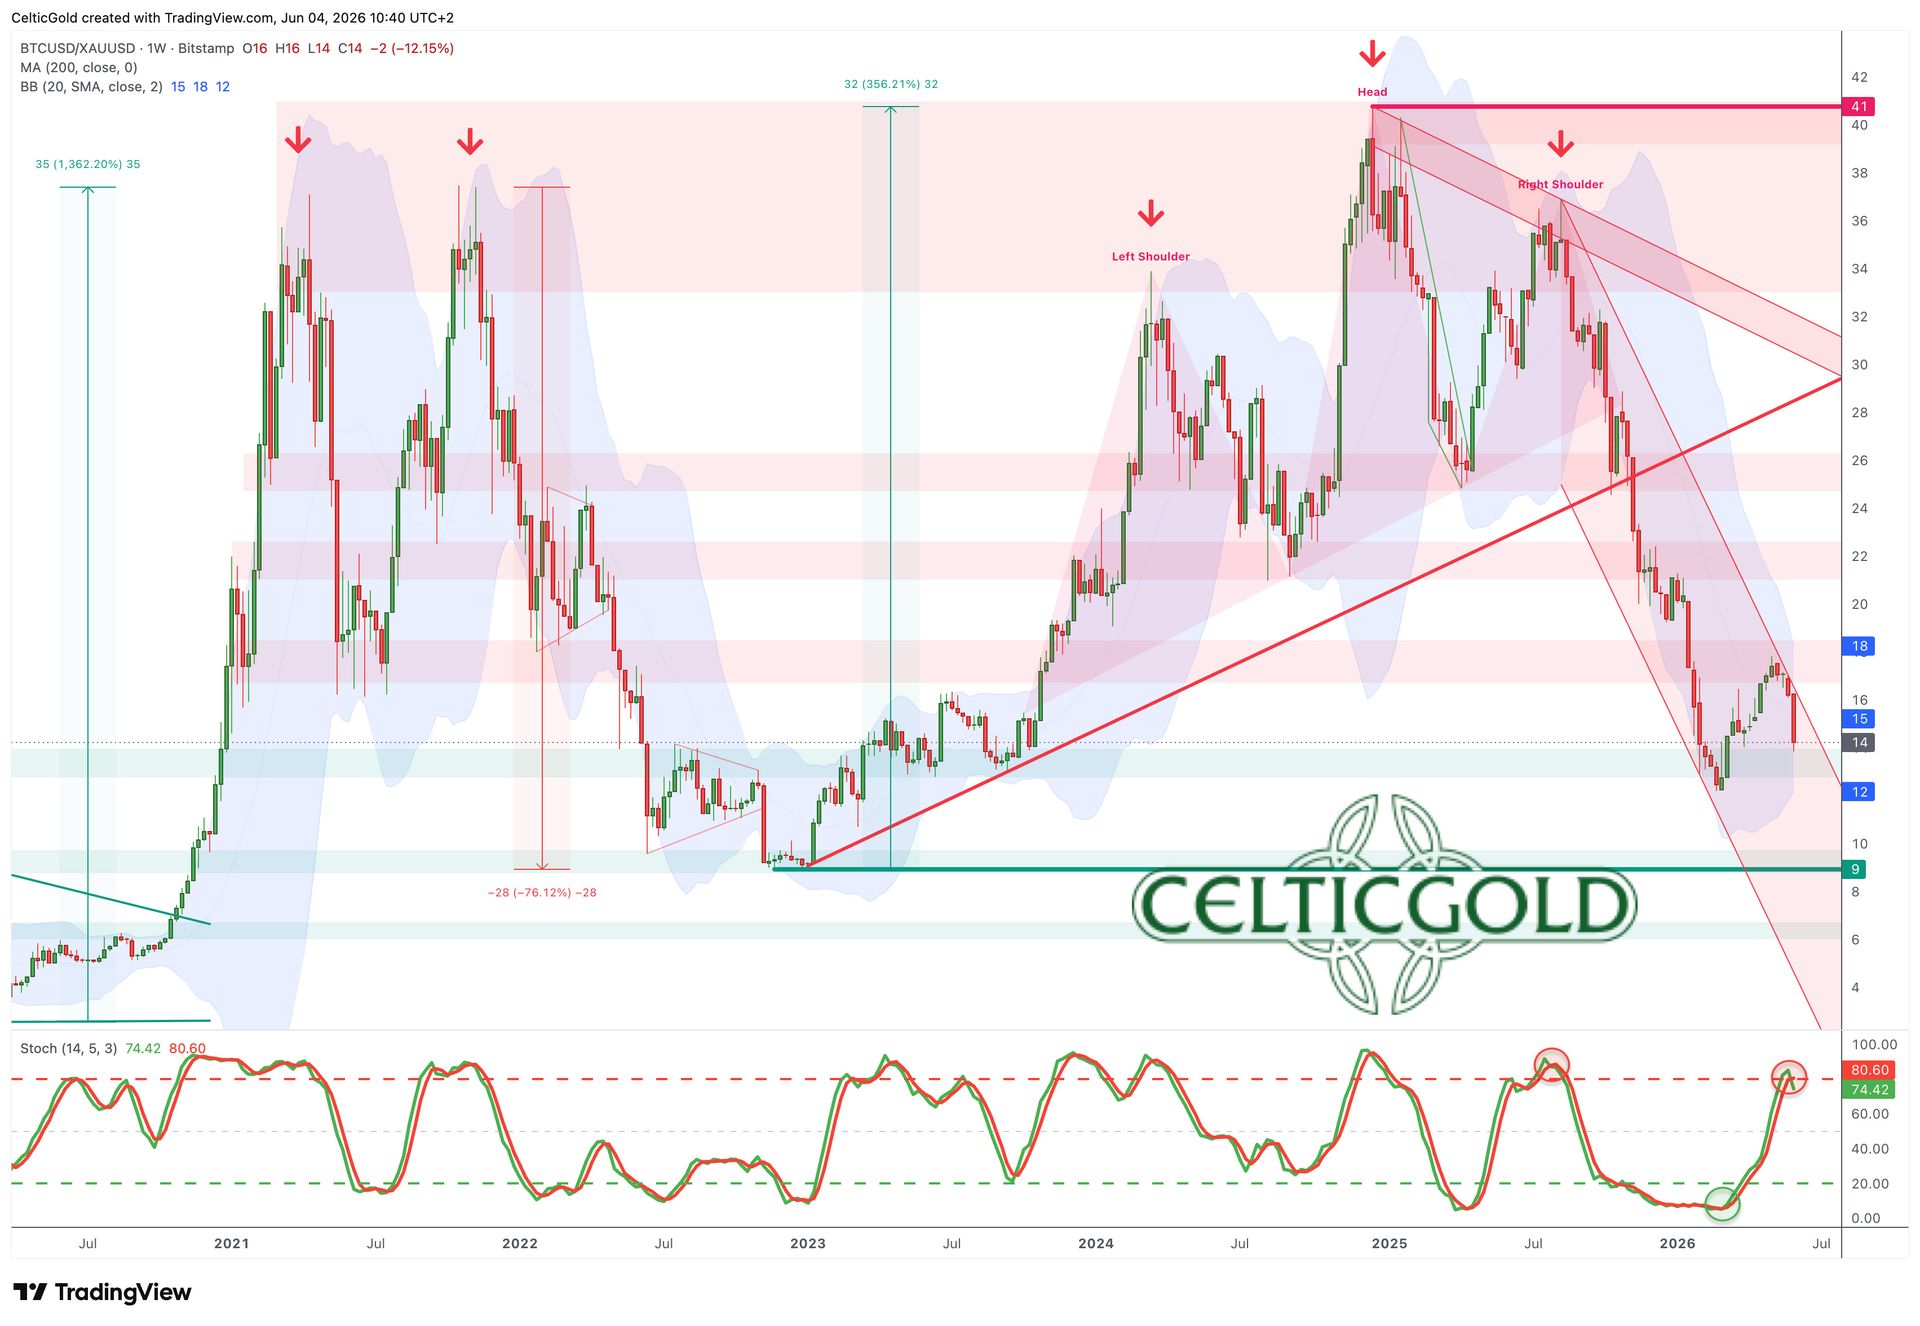
Bitcoin/Gold-ratio, daily chart as of 4th June 2026. Source: Tradingview
At approximately USD 63,500 per Bitcoin and USD 4,463 per ounce of gold, one Bitcoin currently equals about 14.23 ounces of gold. Conversely, one ounce of gold equals roughly 0.07 Bitcoin.
Bitcoin managed a modest recovery against gold until early May within its steep downtrend channel. However, this rebound has not proven sustainable. Instead, it resulted in an overbought weekly stochastic and a new sell signal from the oscillator. The Bitcoin/Gold ratio is therefore likely to continue declining towards the target derived from the head-and-shoulders top formation, around 10.
In summary, the Bitcoin/Gold ratio continues to confirm the ongoing crypto winter. The attempted trend reversal has failed, and there is currently no reason to increase Bitcoin allocation relative to gold.
6. Macro Update: The Great Decoupling – Why Bitcoin Prices Reality While Markets Still Trade Narratives
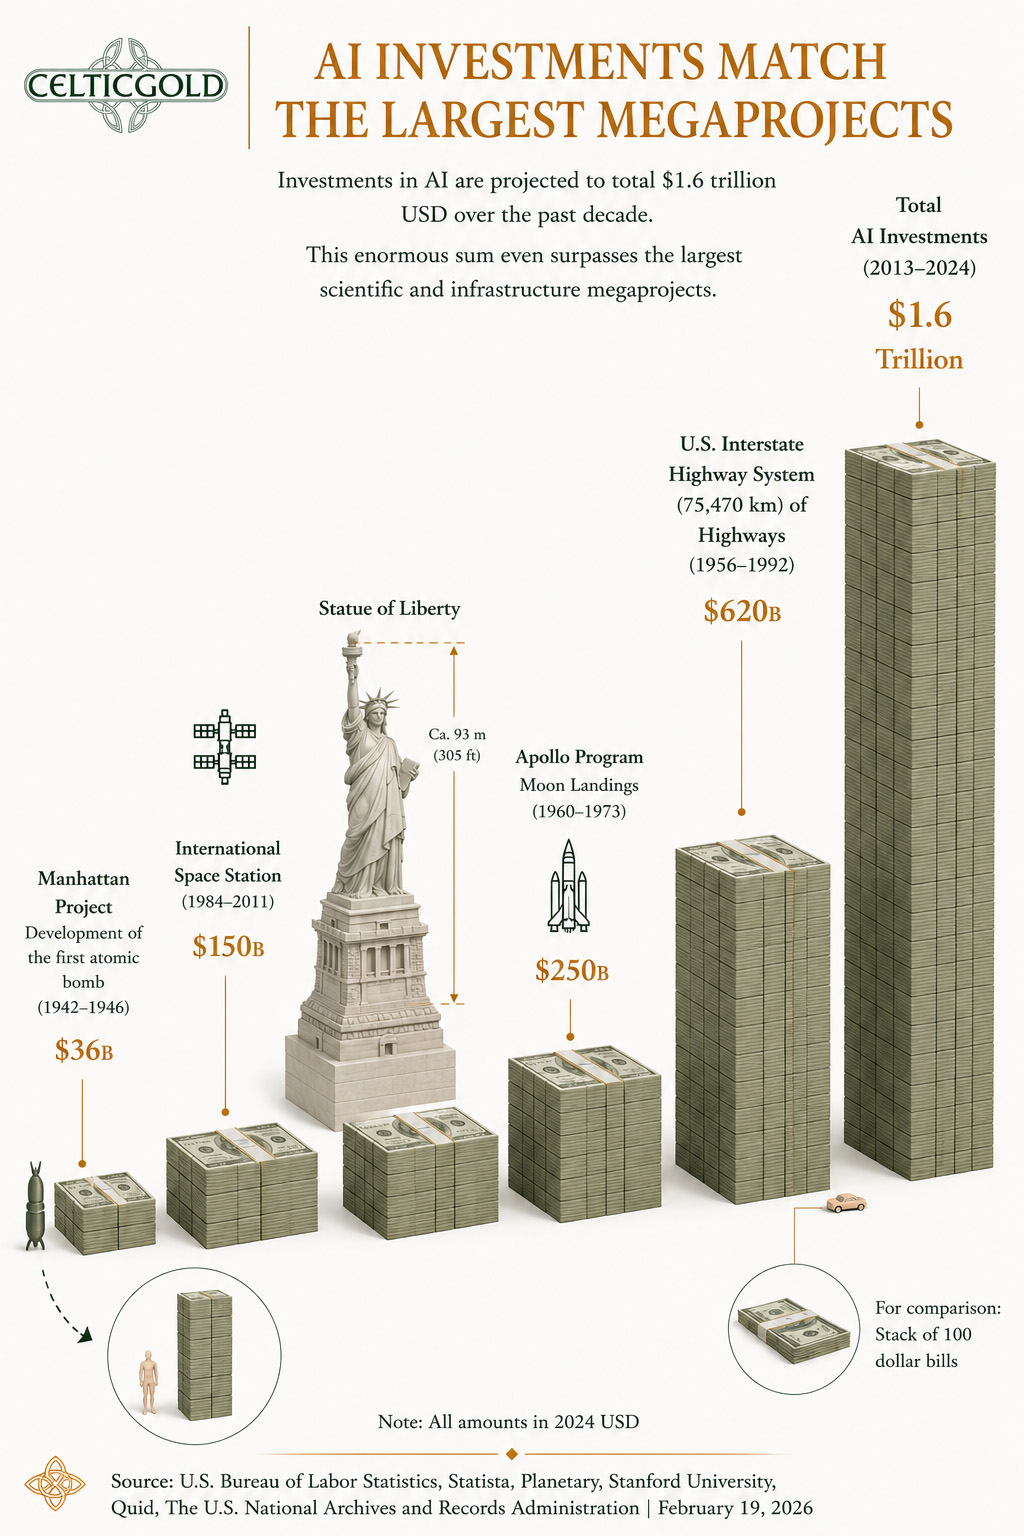
AI Investments Surpass the Largest Megaprojects, 19th February 2026. Source: Al Jazeera
For over a decade, global capital allocation was based on a seemingly simple assumption: digital intelligence, software, and platforms scale faster than the physical world that underpins them. Capital increasingly flowed into a narrative of limitless scalability, while energy, raw materials, and industrial capacity were treated as mature and outdated sectors. This view is now increasingly clashing with reality, as the material foundation of the modern economy cannot be abstracted indefinitely.
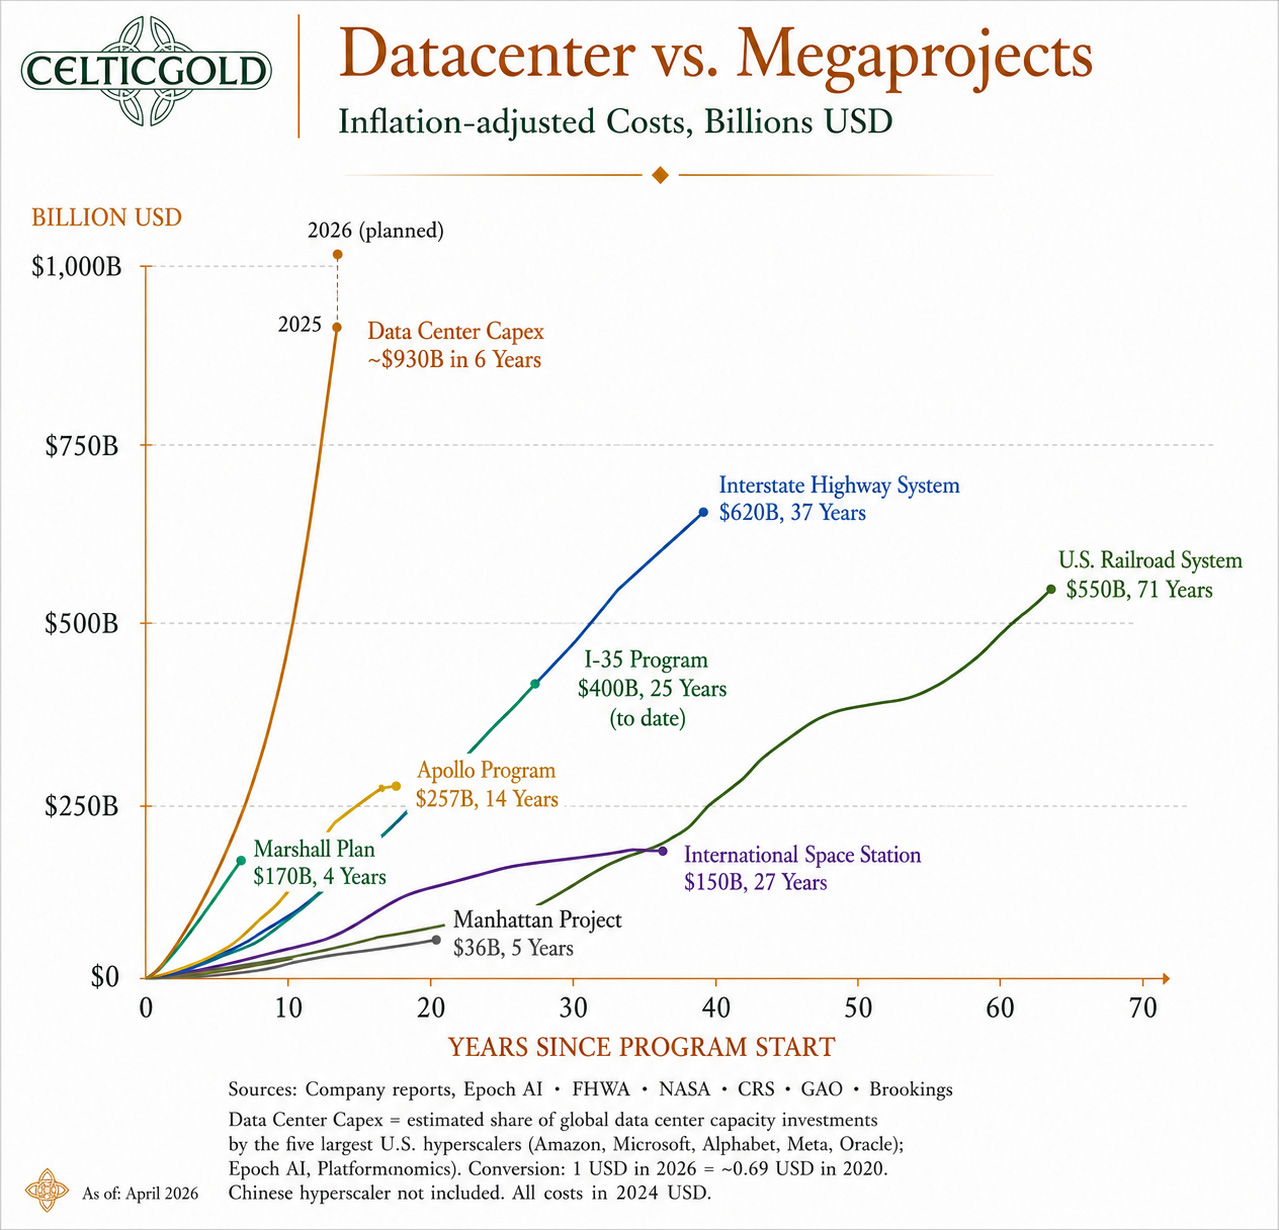
Data Centres vs. Megaprojects, 12th May 2026. Source: Brookings
What appears on the surface as a synchronised global upswing—high equity valuations, massive AI investment programmes, and persistent enthusiasm for digital assets—may in fact mark the late phase of a cycle defined by financial excess and energy complacency. Beneath the headlines, a different market is emerging: slower, more physical, and far harder to ignore. This is where the true pricing conflict between narrative and reality begins.
6.1 The U.S. Dollar Remains King—But Its Throne Is Shaking
The U.S. dollar remains the dominant global reserve and settlement currency, but its foundation has shifted. High deficits, rapidly rising structural debt, and geopolitical fragmentation have transformed an era of disinflationary comfort into one of monetary constraint. The dollar remains dominant, but dominance no longer guarantees the same protection against loss of purchasing power.
The response of Gulf states is telling. When the UAE and Saudi Arabia reduce holdings of U.S. Treasuries, Kuwait trims exposure to Western financial institutions, and further reallocations are considered, this is not a sudden “exit from the dollar” but a cautious rebalancing under geopolitical pressure. Still, even partial shifts by some of the world’s largest sovereign wealth funds can meaningfully affect marginal demand for dollar assets.
6.2 U.S. vs. China: A Race for Industrial Sovereignty
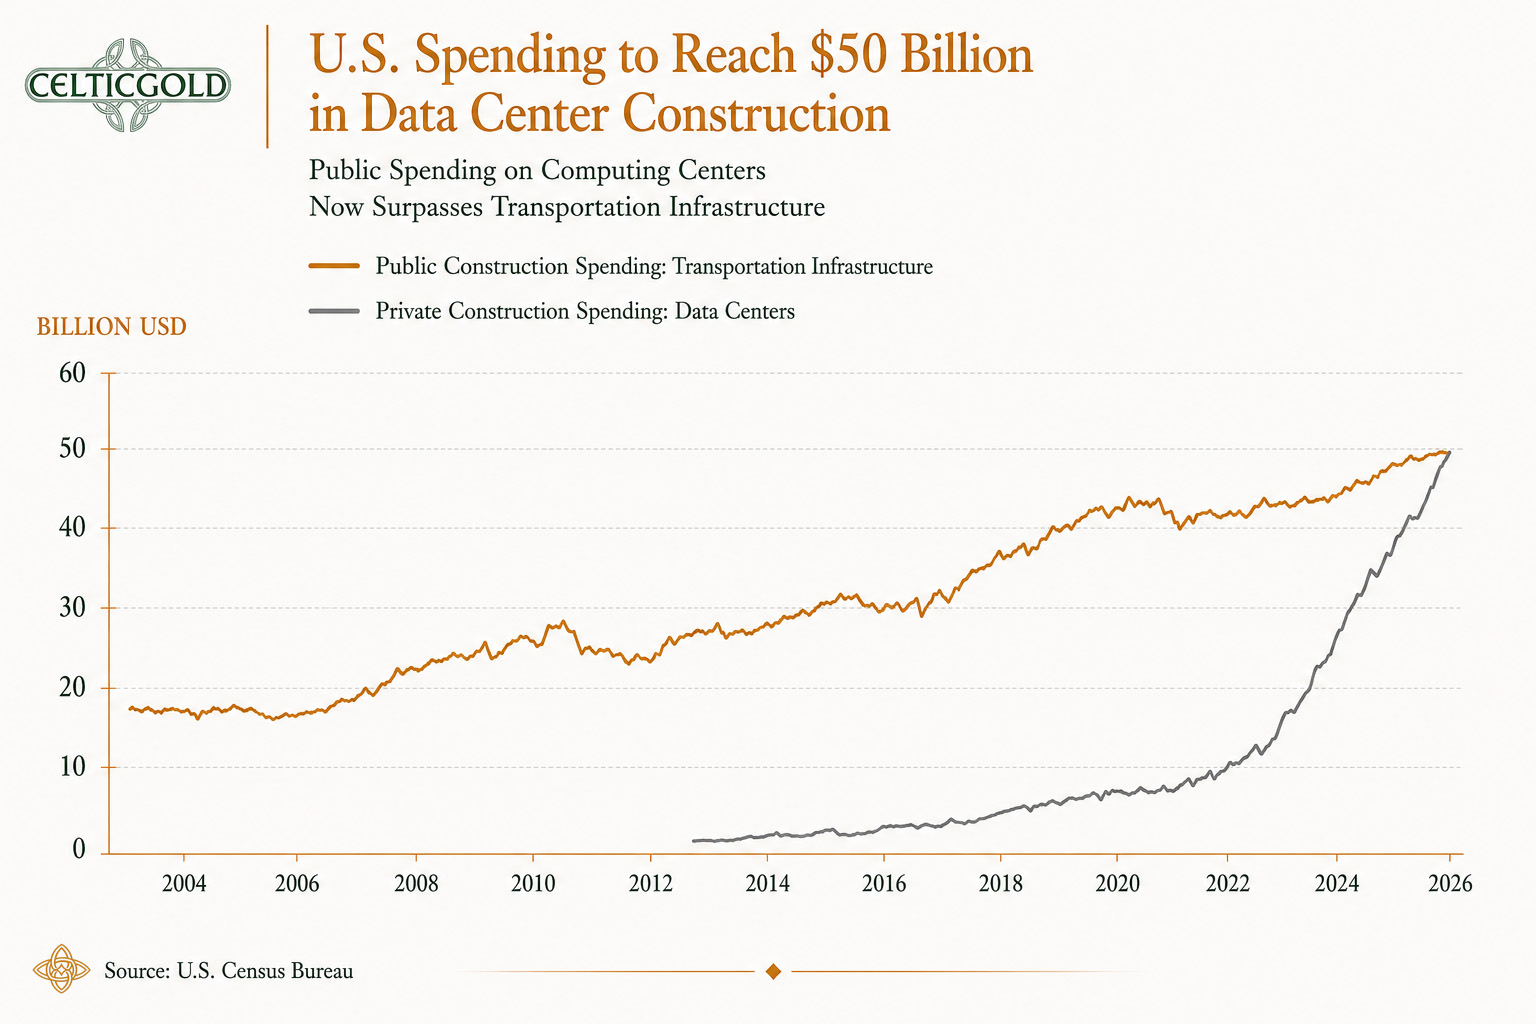
U.S. Spending on Data Centre Construction Reaches USD 50 Billion, 4th June 2026. Source: Giacomo Prandelli
The strategic rivalry between the U.S. and China has evolved beyond tariffs and diplomacy into a race for computing power, energy, manufacturing sovereignty, and monetary influence. China is pushing for an independent semiconductor base, while the U.S. responds with export controls, reindustrialisation, and industrial policy for AI. The result is no longer globalisation but duplication—and duplication is inherently inflationary.
6.3 The Real Scarcity Is Energy, Not AI
The most underestimated factor is energy. Markets long behaved as though energy were a solved problem, while investment in fossil capacity declined and electricity demand continued to rise. AI has introduced an additional, highly energy-intensive demand wave, pushing data centres, semiconductor fabs, and grids to levels once reserved for heavy industry.
This reveals the core contradiction: the digital economy requires ever more physical energy to generate output. Every hyperscale data centre, chip factory, and AI model converts electricity into economic value. Institutions such as the IMF and IEA already highlight the growing share of global electricity consumption driven by AI and crypto, alongside rising demand and grid constraints.
6.4 AI and Semiconductors: Breakthrough or Excessive Euphoria?
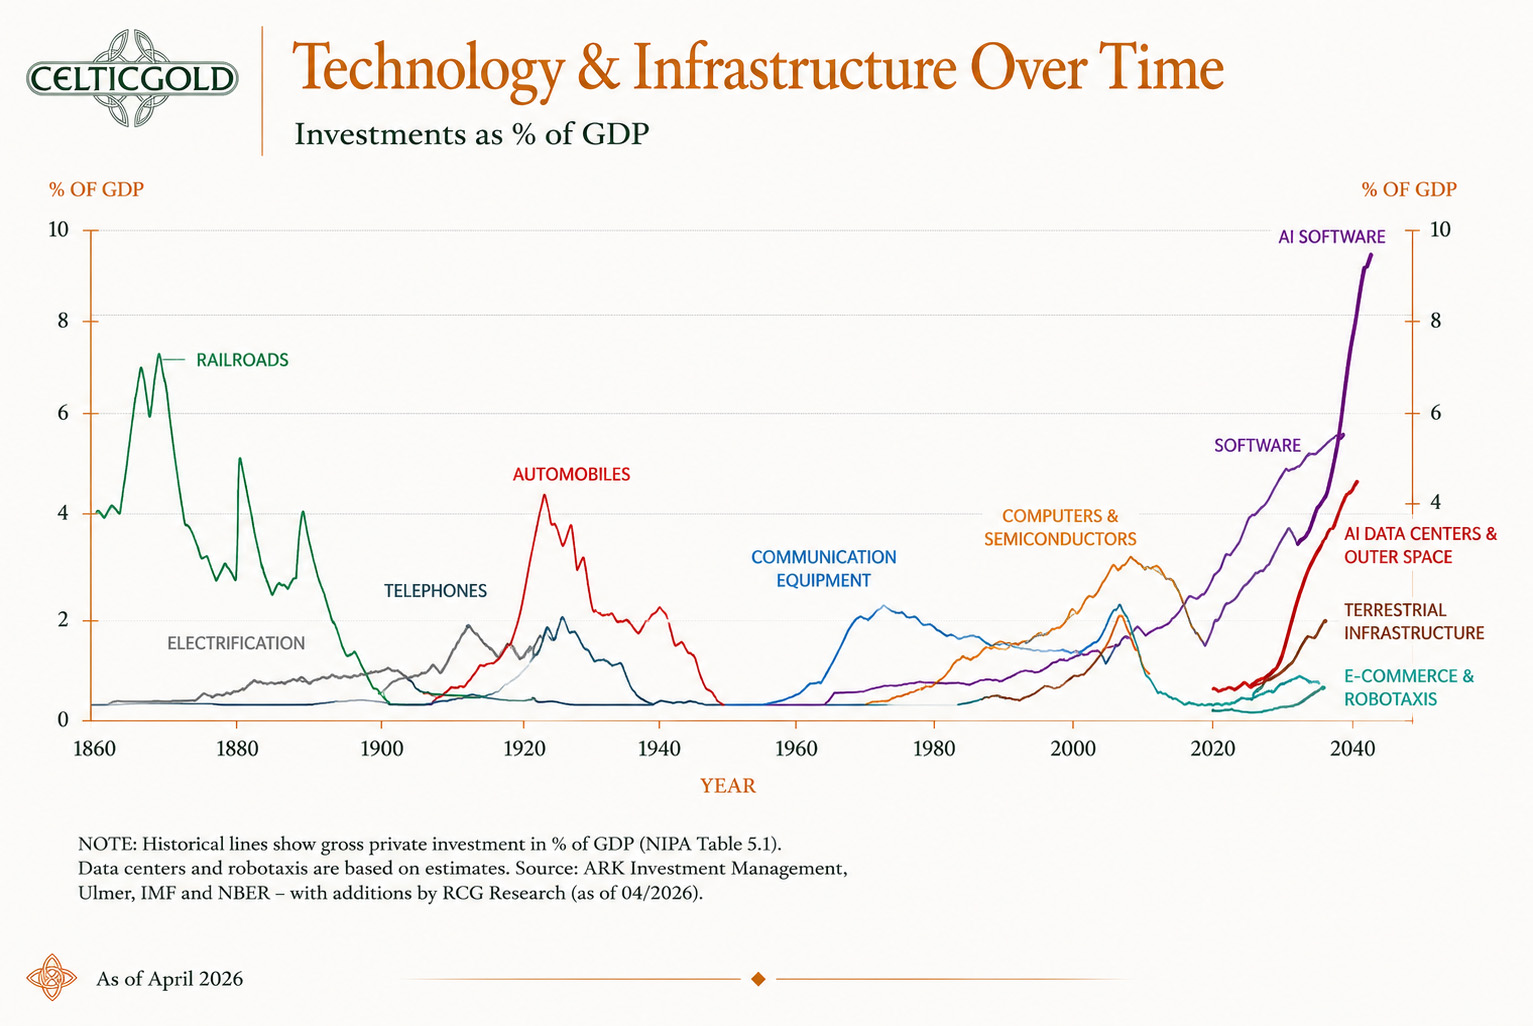
Technology & Infrastructure Investments Over Time, 26th April 2026. Source: RCG Research
The AI boom and parabolic investment surge should therefore be viewed with caution. Capital expenditures in chips, data centres, networks, and energy infrastructure resemble late-stage phases of previous technology cycles, where expectations outpaced the buildout of real infrastructure. Such bubbles arise not because the technology is flawed, but because investors assume physical implementation can scale as quickly as the narrative.
Semiconductors increasingly resemble critical infrastructure rather than pure software—subject to bottlenecks, regulatory friction, and supply chain dependencies. In both China and the U.S., the ultimate constraint is not imagination, but factories, grids, power, and raw materials.
6.5 Oil: The Underestimated Driver of the Next Macro Cycle
The global energy picture reinforces this view. Inventories are low, and physical markets are tight. As demand for electricity, computing, and logistics rises, oil becomes not just another commodity but a central pricing anchor for the real economy.
The Iran conflict acts less as an isolated shock and more as an accelerant to an already strained system. While the narrative of energy transition dominates on paper, sectors dependent on hydrocarbons—aviation, shipping, petrochemicals, and indirectly AI infrastructure—continue to expand. Meanwhile, buffers such as inventories and spare capacity have largely been depleted.
6.6 Oil Market at the Limit

The Pattern of U.S.–Iran Negotiations, 30th May 2026
If Iranian supply were to drop out entirely, the gap could not be filled quickly without significantly higher prices and demand destruction. Current market pricing still reflects partial disruption, not full loss. A sustained crisis could push oil prices to USD 150–160 per barrel, with a structurally higher range above USD 100 thereafter.
This would mark not a temporary shock but a structural break—driven by damaged infrastructure, underinvestment, and constrained supply flexibility.
6.7 The Oil Market as Bottleneck
Financial markets continue to trade narratives of manageable geopolitics and smooth energy transition, while the physical world has already shifted into structural scarcity. Energy is moving from a tail risk to a central driver of inflation—and most portfolios remain poorly positioned, with too little exposure to physical assets and too much reliance on abstract financial claims.
6.8 Gold: The Quiet Return of Trust
Gold reflects a similar signal. Central banks have been accumulating aggressively, with China increasing reserves. Gold is increasingly viewed not just as an inflation hedge, but as geopolitical insurance.
6.9 Bitcoin: Risk Asset or Early Warning Signal?
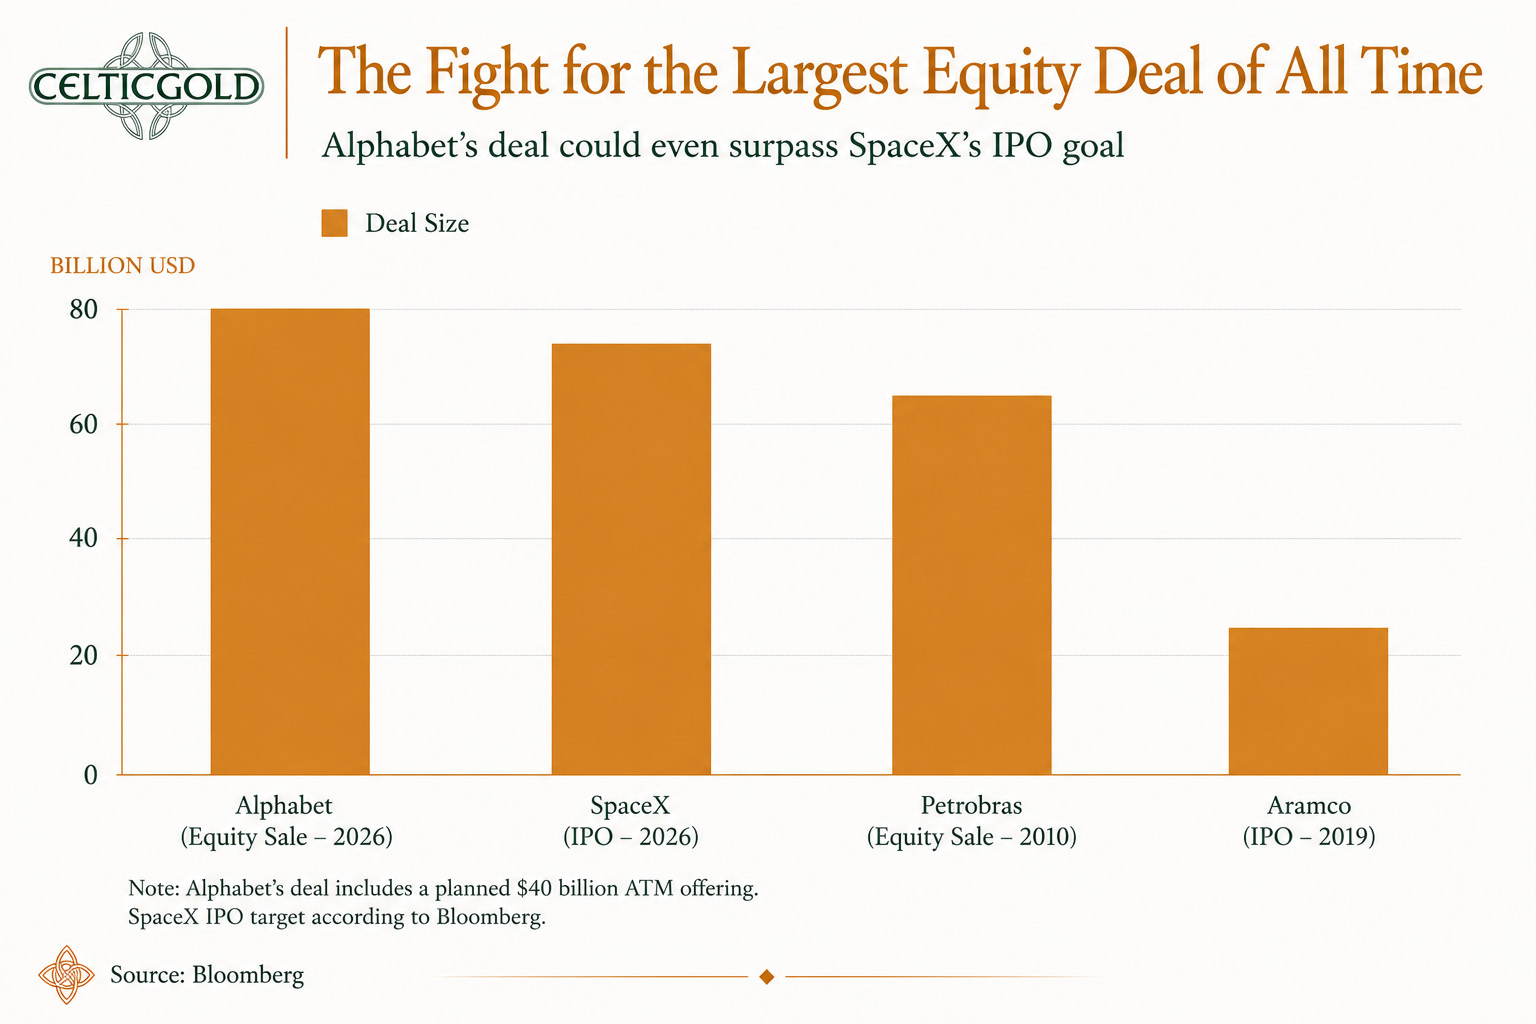
The Fight for the Largest Equity Sale of All Time, 3rd June 2026. Source: Giacomo Prandelli
Bitcoin sits between categories. It is neither an equity index nor a traditional asset, but a global liquidity and trust indicator. It often reacts earlier than other markets to shifts in liquidity, monetary expectations, and uncertainty.
Bitcoin should therefore not be seen purely as a risk asset. It functions as a barometer of liquidity, a reflection of monetary scarcity, and a leading indicator of global risk appetite. Its correction since October—while AI and tech equities reached new highs—suggests growing macroeconomic headwinds.

U.S. Valuations Have Never Been Higher, 3rd June 2026. Source: Bloomberg
At the same time, over USD 350 billion in new equity supply is expected from major offerings such as SpaceX and OpenAI. This represents a significant liquidity stress test for markets.
6.10 A New Pricing Logic: Molecules Over Code

Commodities Are the Top Performers of the 2020s, June 1, 2026. Source: Bloomberg
The broader diagnosis is not that technology is wrong, but that Bitcoin may already be signalling a shift towards a new reality—one defined by scarcity, energy, and physical constraints. Commodities are likely to outperform in this regime, while many portfolios remain underexposed to real assets such as oil, infrastructure, and gold.
7. Conclusion: Bitcoin – Narrative Versus Physical Reality

After seven months of correction, Bitcoin is far more than a speculative asset in the current environment. It acts as a sensitive seismograph for liquidity, trust, and the growing tension between financial narratives and physical reality. While many markets are still driven by optimistic future expectations, Bitcoin appears to be pointing towards a harsher regime where scarcity, energy, and execution capacity dominate.
Viewed in this light, the current downtrend is not merely technical but reflects a deeper macroeconomic conflict. As capital continues to shift between hope, fear, and liquidity needs, Bitcoin remains vulnerable. Yet this very vulnerability makes it valuable: it reveals not only price direction but also the fragility of prevailing market narratives.
We therefore believe that the crypto winter is not yet over. Moreover, we expect equity markets to come under noticeable pressure, at the latest after the World Cup. Precious metals, elevated liquidity reserves, and selected positions in the oil sector remain our preferred allocation.