1. Review
Over the past three and a half weeks, weakness in the crypto sector has persisted, while precious metals have continued their furious and dynamic upward momentum. Bitcoin did manage to break out of its sideways range temporarily, rising to as high as USD 97,939. However, a clear trend reversal - or even a confirmed bottom formation - remains uncertain. With the weak start to the week on global markets, Bitcoin once again slipped significantly lower and is currently trading around USD 91,000. Ethereum continues to lag and has yet to surpass its December 10th high of USD 3,446.
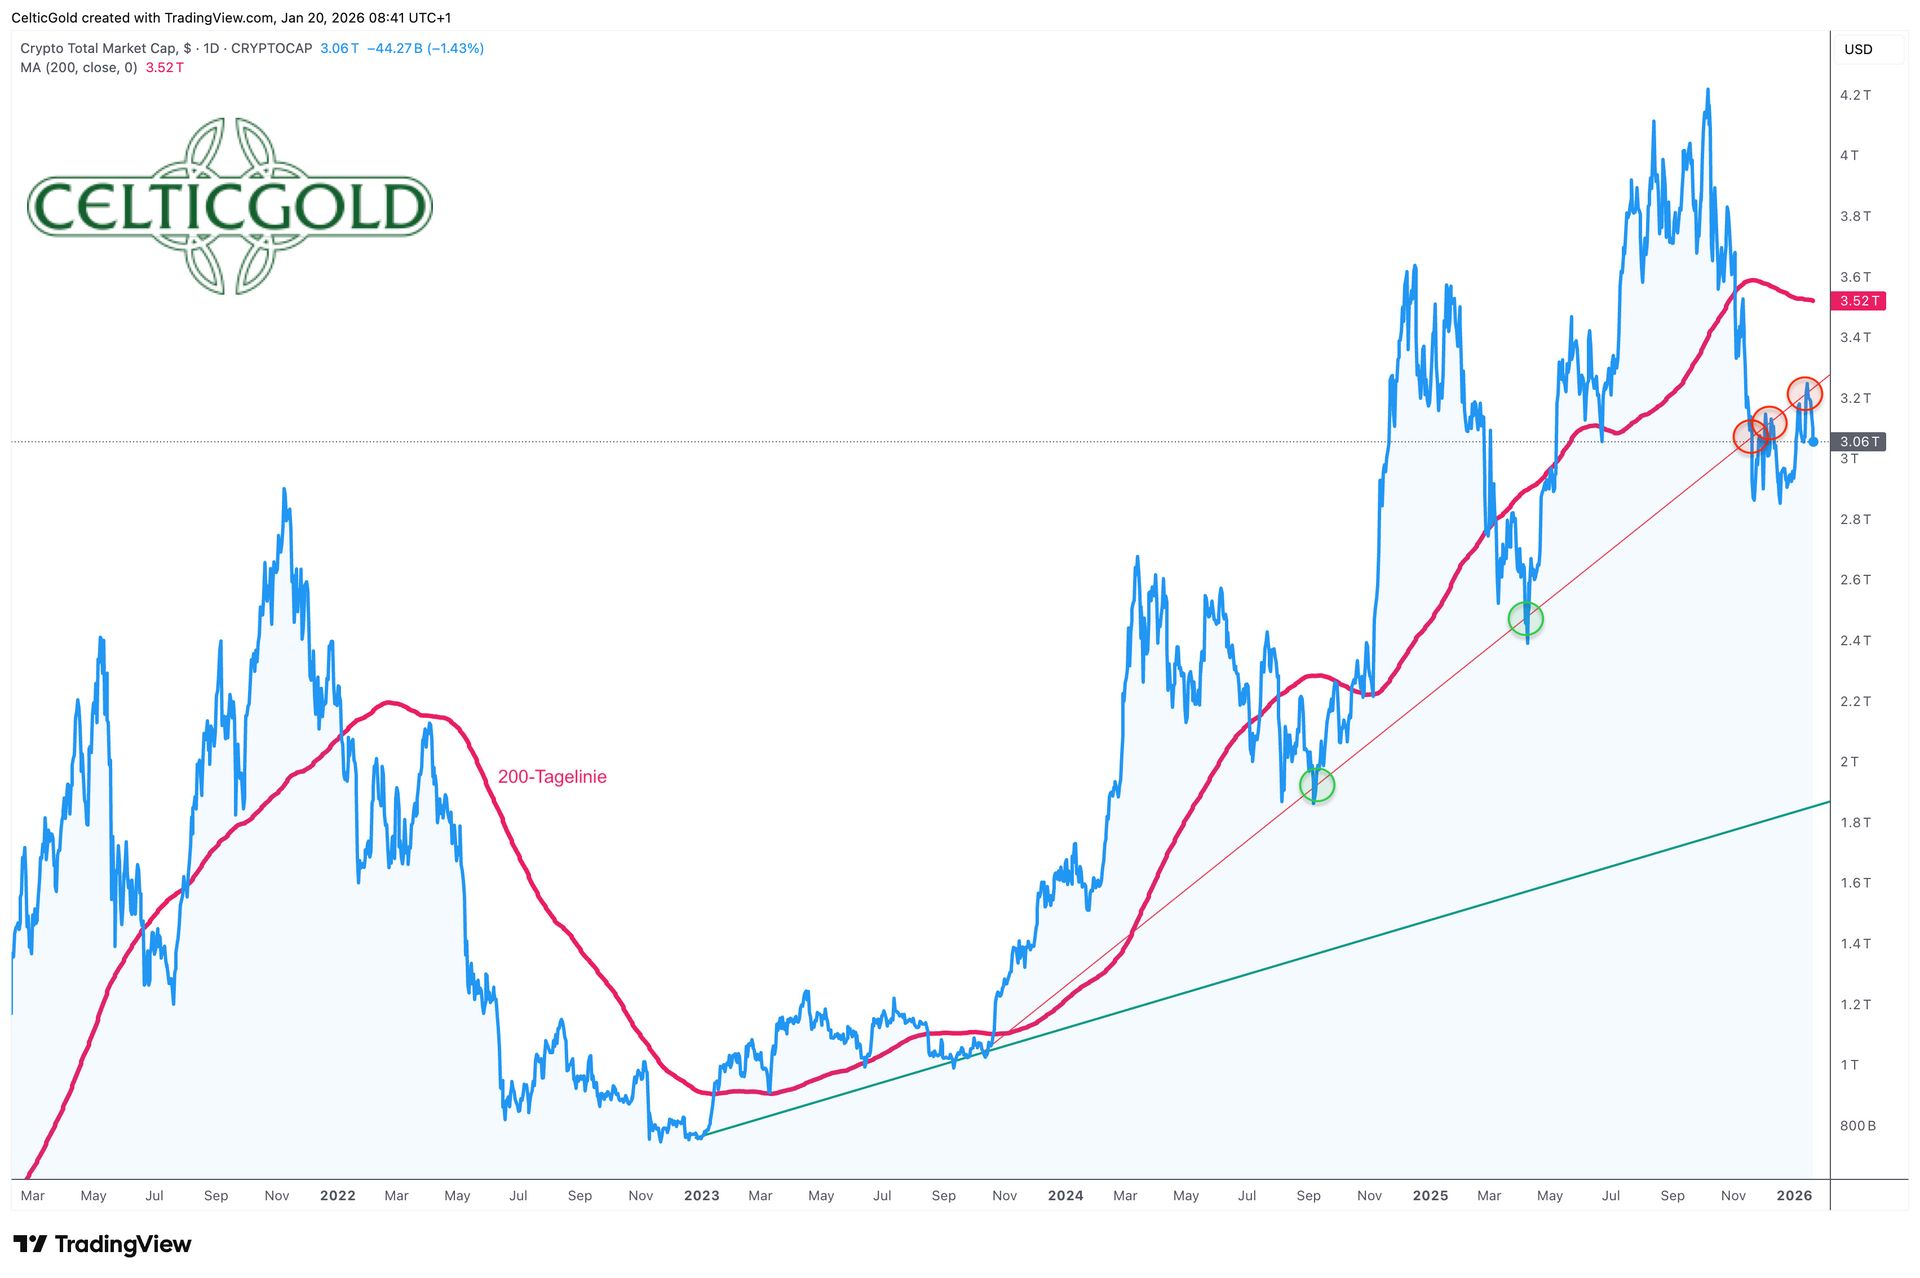 Crypto market cap, as of January 20th, 2026. Source: Tradingview
Since the beginning of autumn, there has been a clear market shift that has accelerated in recent weeks. While retail investors are pouring record sums into silver ETFs—more than USD 920 million in just 30 days—investors are increasingly turning away from cryptocurrencies. The total crypto market capitalisation has lost roughly one-third of its value since early October. The uptrend that began in autumn 2023 has broken and is now acting as resistance.
Even though Bitcoin briefly recovered to nearly USD 98,000, crypto stocks have once again suffered heavy losses. Coinbase, Circle, Strategy, and Robinhood each fell by more than 10 %. One key trigger was the withdrawal of a long-prepared US Senate bill, after Coinbase CEO Brian Armstrong warned of a 'bad law'. Renewed uncertainty around US crypto regulation and the threat of new US tariffs are weighing heavily on the sector.
Meanwhile, the US economy remains robust with surprisingly low unemployment figures. Traditional finance giants like State Street are pushing deeper into blockchain with new digital asset platforms.
2. Technical Analysis for Bitcoin in US-Dollar
2.1 Weekly Chart: Bottom Formation Not Yet Confirmed
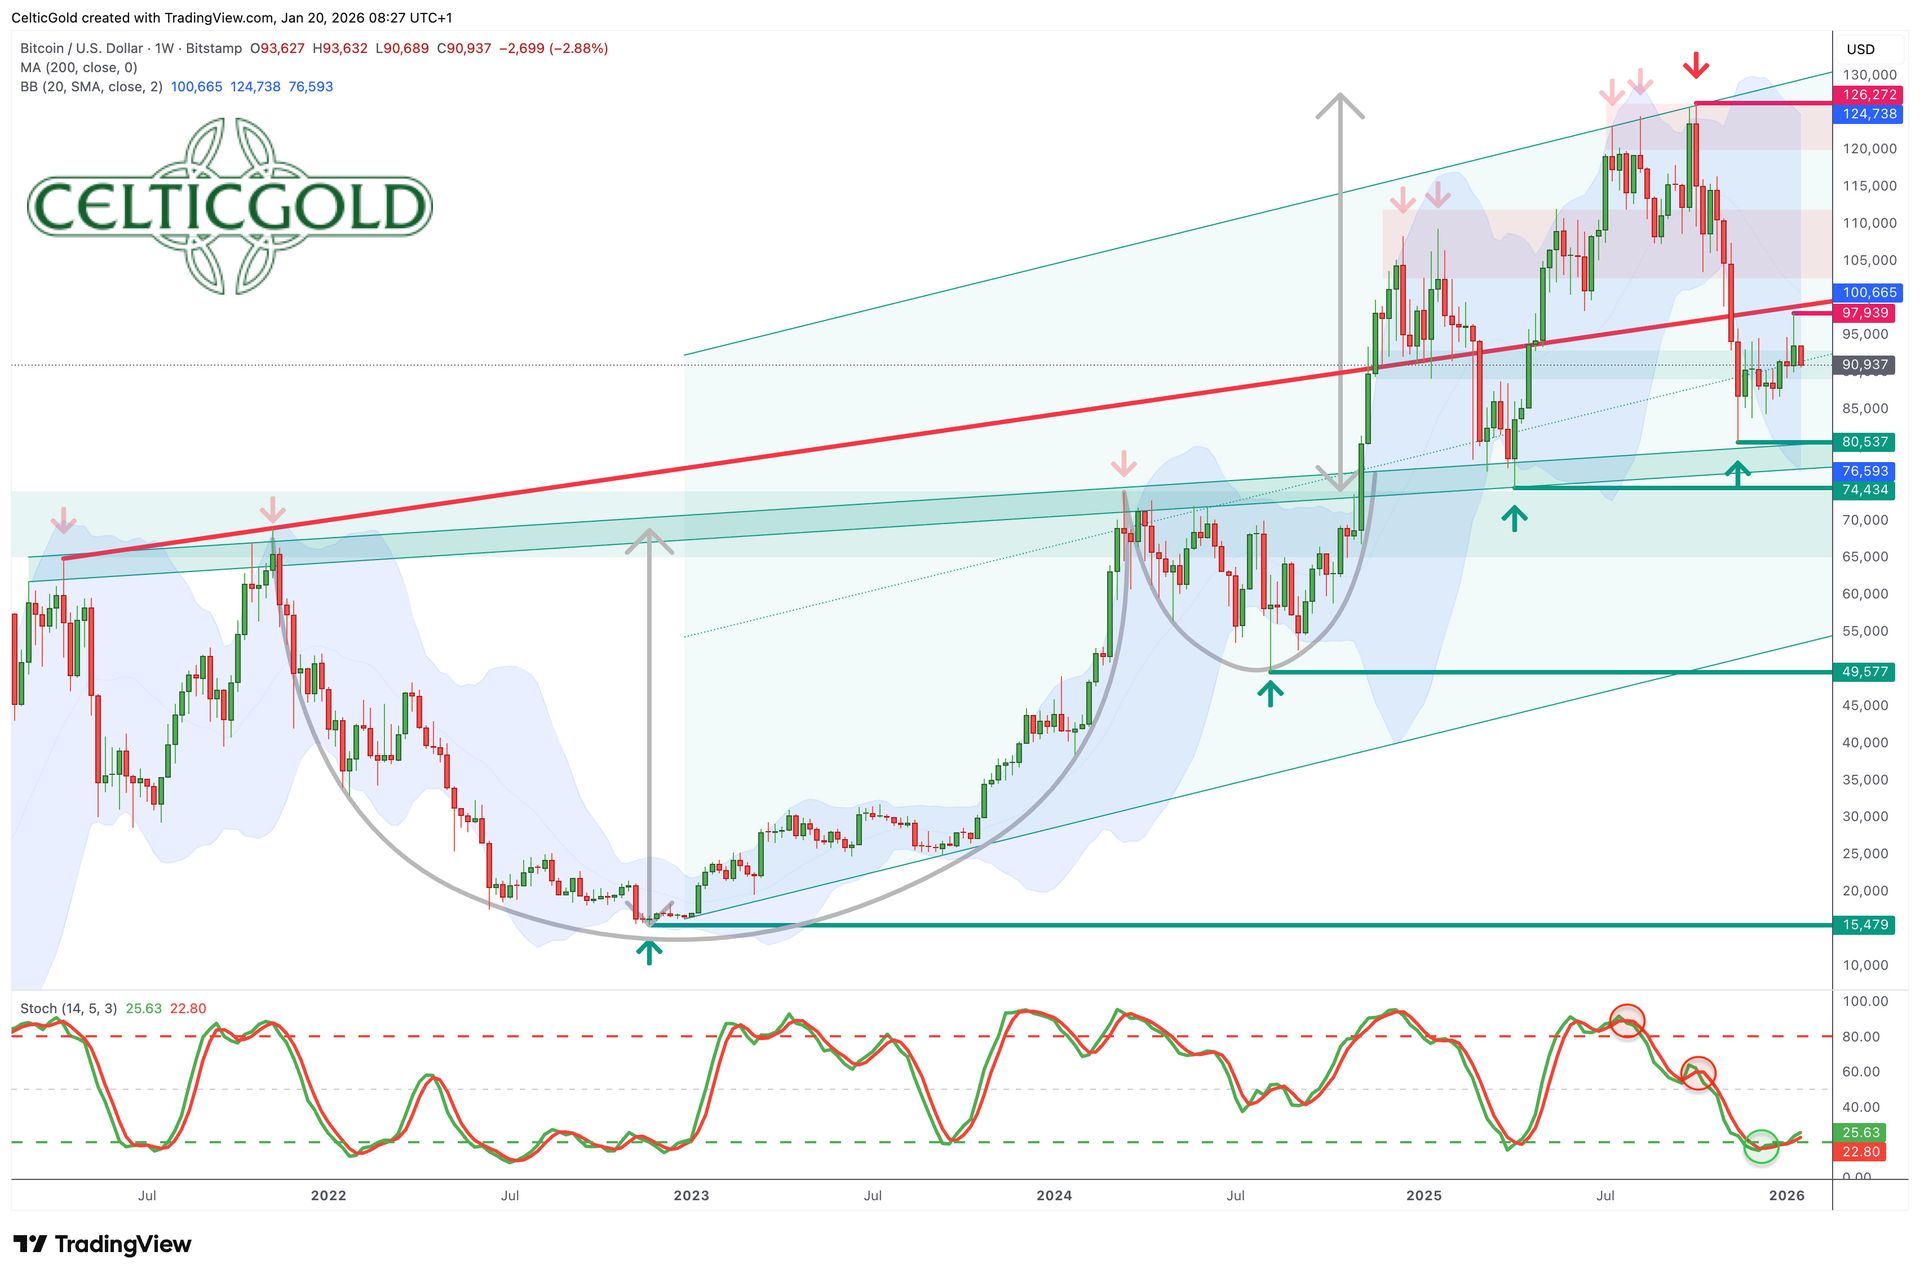 Bitcoin in USD, weekly chart as of January 20th, 2026. Source: Tradingview
Since the sharp decline from the new all-time high of USD 126,272 on 6th October 2025, to the low of USD 80,537 on 21st November 2025, Bitcoin has been struggling to recover. While the price rebounded by roughly 21.6 % over the past two months, the clear failure at the 38.2 % Fibonacci level near USD 98,000 underscores the fragile technical picture.
Assuming a completed bottom formation or trend reversal would be premature and risky. If Bitcoin fails to break above the 38.2 % Fibonacci level (USD 98,000) and continues to trade below the psychologically significant USD 100,000 mark, the outlook will deteriorate further. Weekly stochastic indicators remain heavily oversold but are attempting a momentum reversal to the upside.
Overall, the weekly chart remains bearish. There is still no strong confirmation of a sustained recovery or trend reversal. The lower Bollinger Band (currently around USD 76,593) leaves further room to fall. Within the broader long-term uptrend channel, price targets between USD 55,000 and USD 65,000 are conceivable this year. The support zone between USD 81,000 and USD 75,000, however, is strong and should withstand the bears’ next attack for the time being.
2.2 Daily Chart: More sideways consolidation
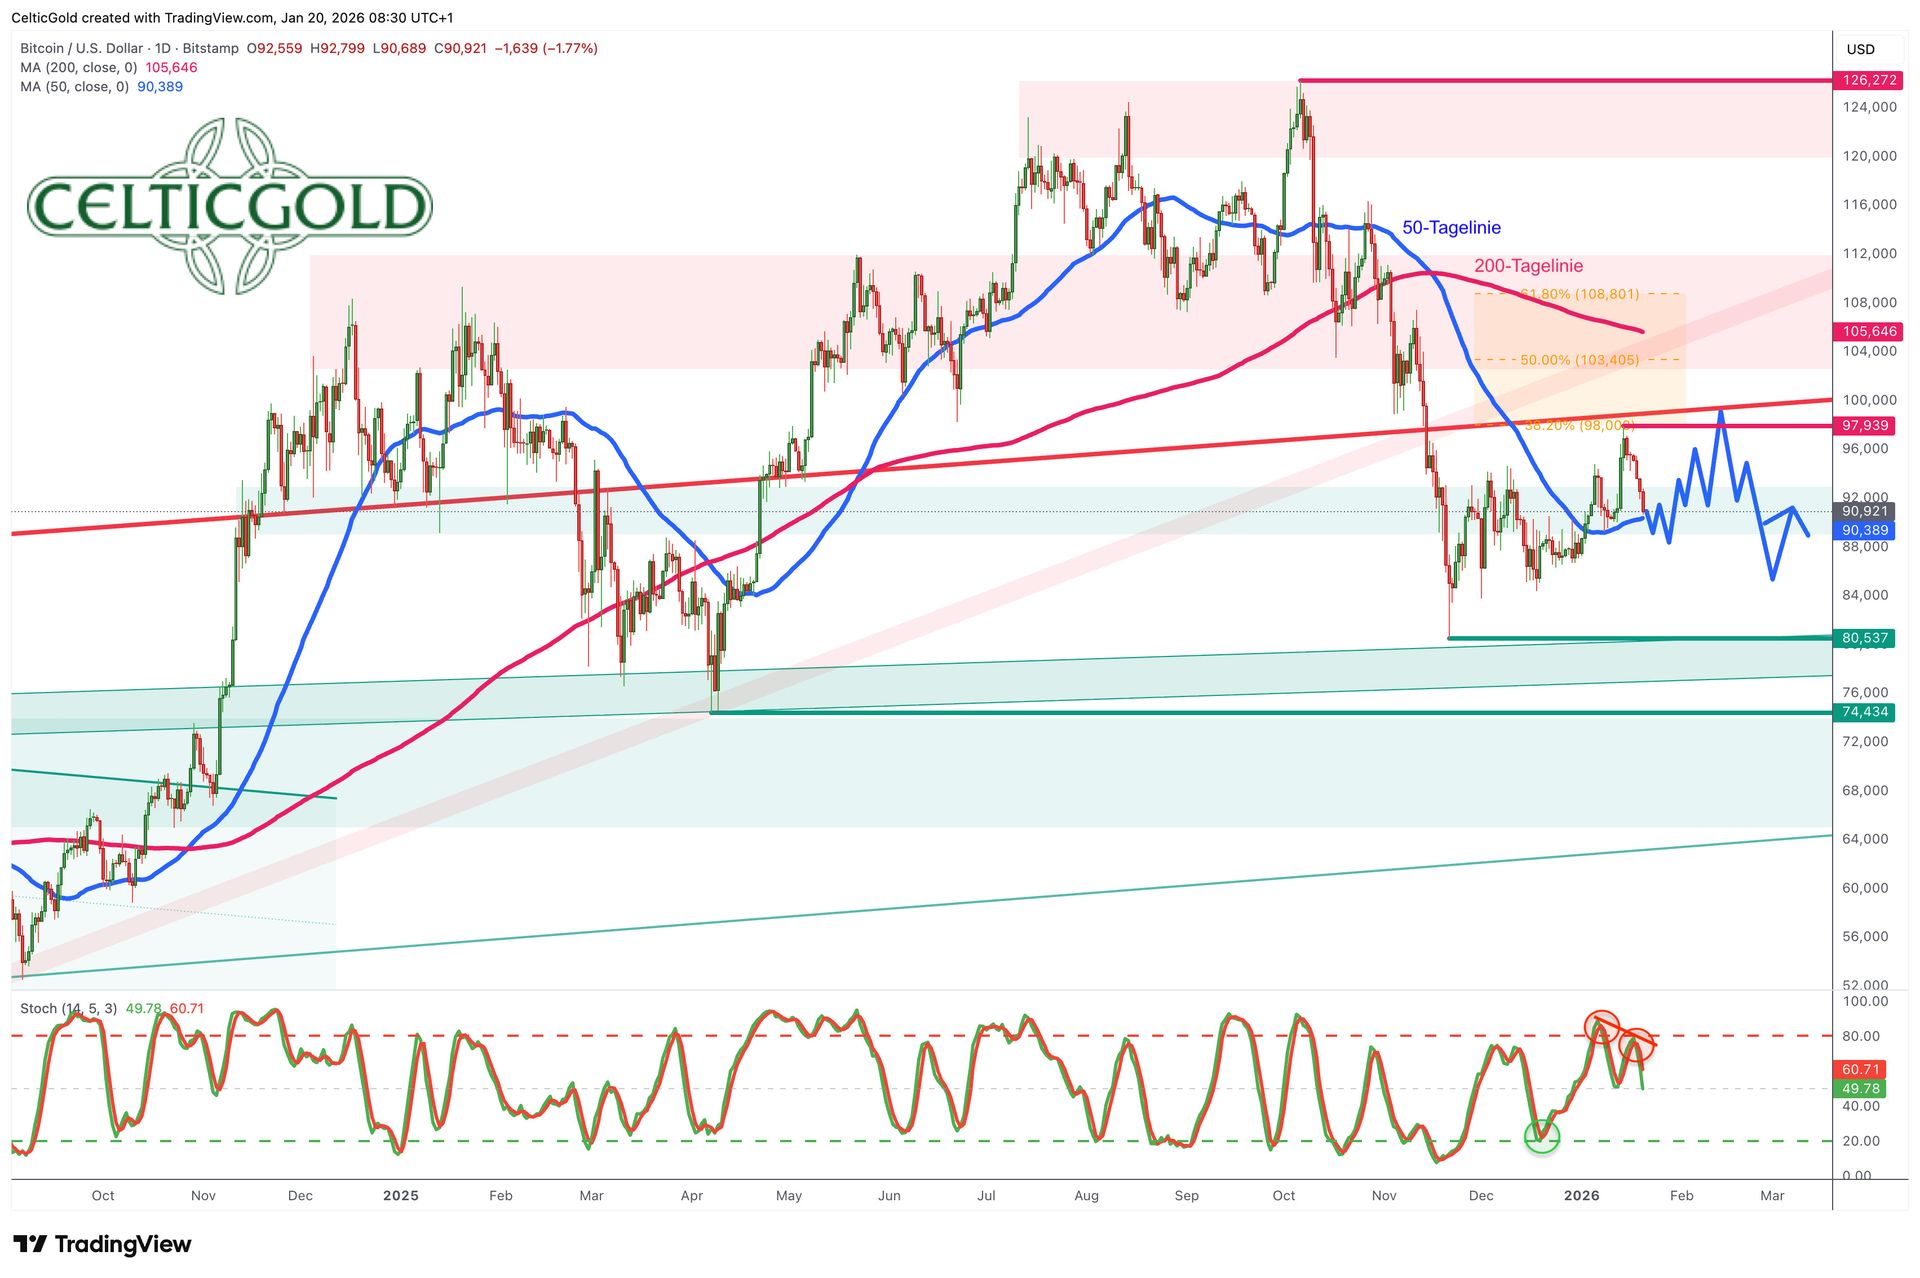 Bitcoin in USD, daily chart as of January 20th, 2026. Source: Tradingview
On the daily chart, Bitcoin failed six days ago at the 38.2 % Fibonacci level (USD 98,000) and an established trendline, retreating swiftly to its 50-day moving average (USD 90,389). After some consolidation around this line, another attempt to break the resistance between USD 98,000 and USD 100,000 seems possible. Should this attempt fail again, the crypto winter may deepen.
If Bitcoin successfully breaks the USD 100,000 level, a recovery toward the declining 200-day moving average (USD 105,646) would be logical and realistic. Until then, in a challenging macroeconomic environment, the bulls have considerable work ahead.
Short-term momentum has turned negative, as the daily stochastic indicator issued a sell signal. However, new lows below USD 80,000 appear unlikely for now. A continued consolidation around the 50-day line, in the range of USD 85,000–USD 95,000 into February, appears more probable.
In total, the daily chart still signals a weak market environment. For now, the real momentum clearly lies outside the crypto sector—in precious metals and commodities. The most likely scenario for the coming weeks remains a sideways phase that could eventually lead to a recovery, either stalling again at USD 98,000–USD 100,000 or extending temporarily toward USD 103,000–USD 105,000 near the 200-day average.
3. Bitcoin Sentiment – Neutral Market Mood
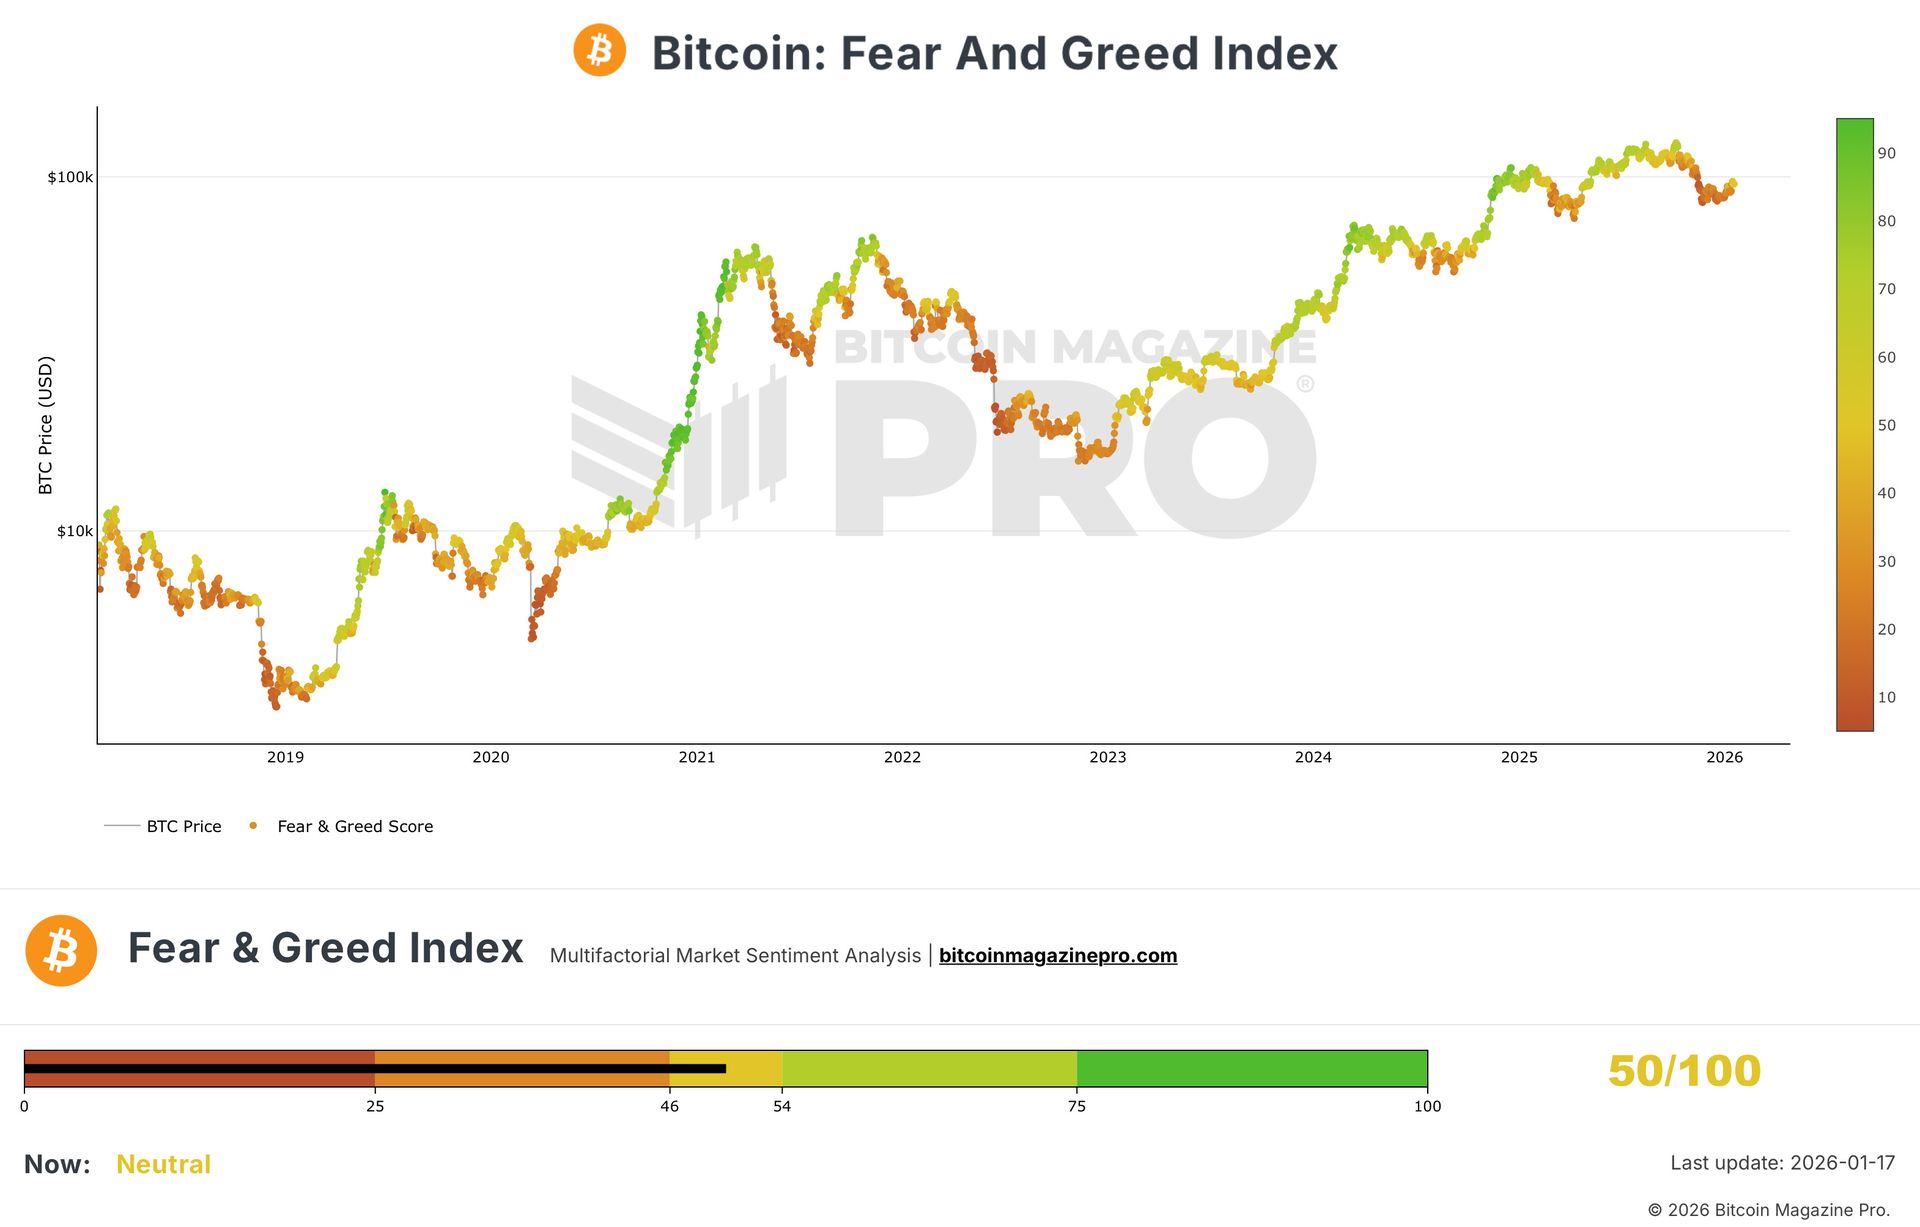 Crypto Fear & Greed Index, as of January 17th, 2026. Source: Bitcoin Magazine Pro.
The Crypto Fear & Greed Index recently improved to 50 out of 100 points, reflecting a neutral sentiment. Extreme fear or greed is no longer present. The index currently signals indecision: volatility, trading volume, Bitcoin dominance, social media sentiment, and Google Trends all show a balanced market mood. Historically, such neutrality often coincides with stabilisation phases—values below 25 indicate 'Extreme Fear', while those above 75 suggest 'Extreme Greed', typically aligning with panic-buying opportunities or overvaluation warnings.
 CMC Crypto Fear & Greed Index, as of January 17th, 2026. Source: Coinmarketcap
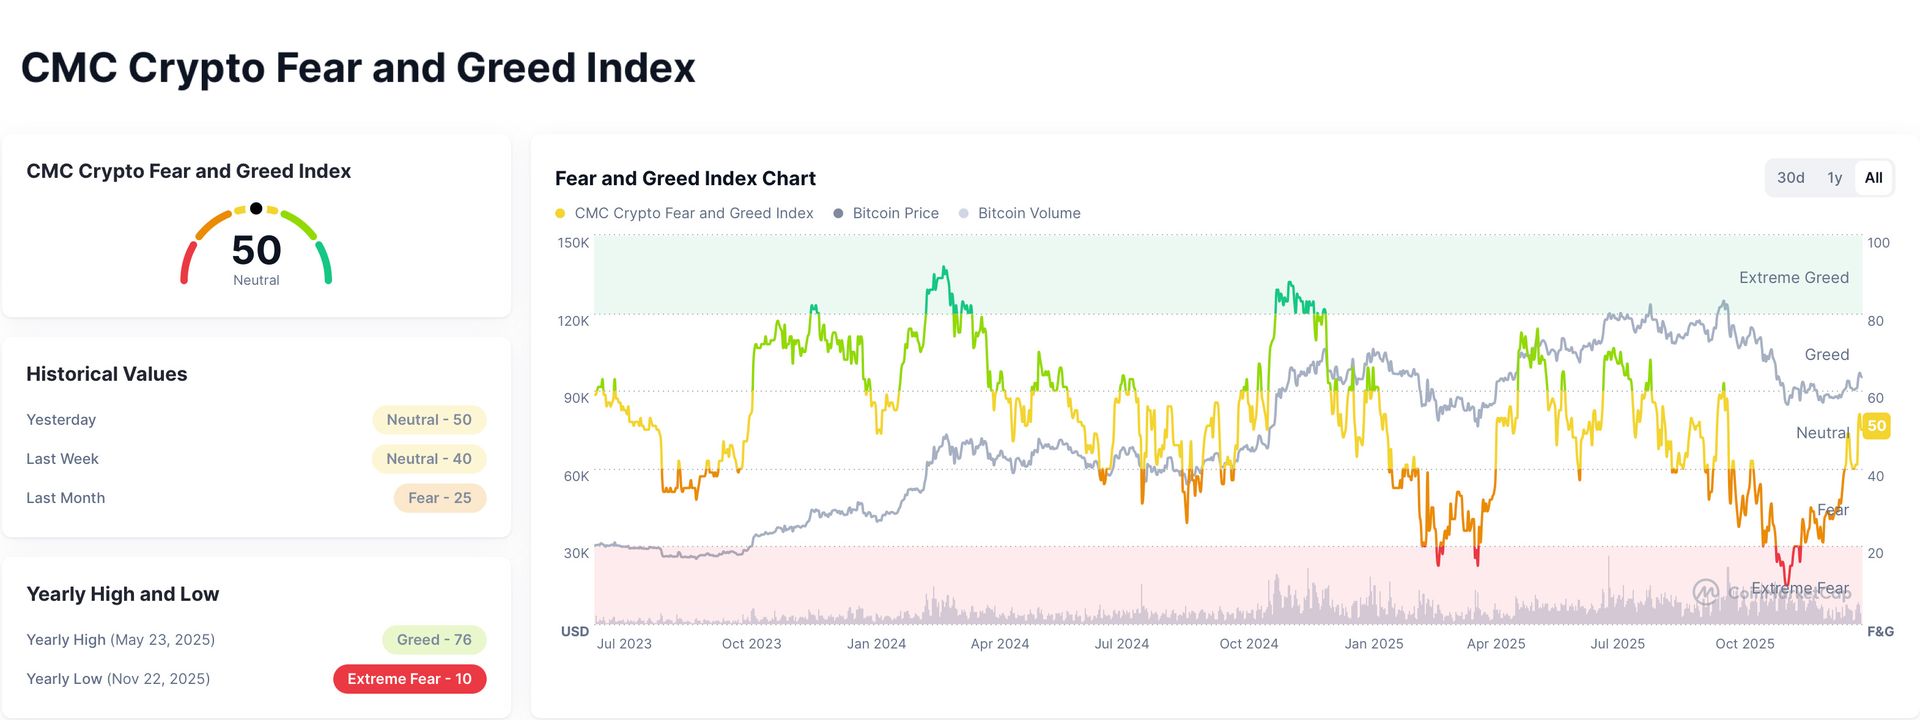
Similarly, CoinMarketCap’s CMC Crypto Fear & Greed Index, which covers a broader range of major cryptocurrencies including stablecoins, also stands at 50 out of 100—confirming a neutral and balanced market stance. Measured indicators such as market volatility, momentum, surveys, and trend data collectively indicate continued consolidation.
In summary, sentiment has stabilised at a neutral level without providing a clear directional signal.
4. Bitcoin Seasonality – Sideways in Q1
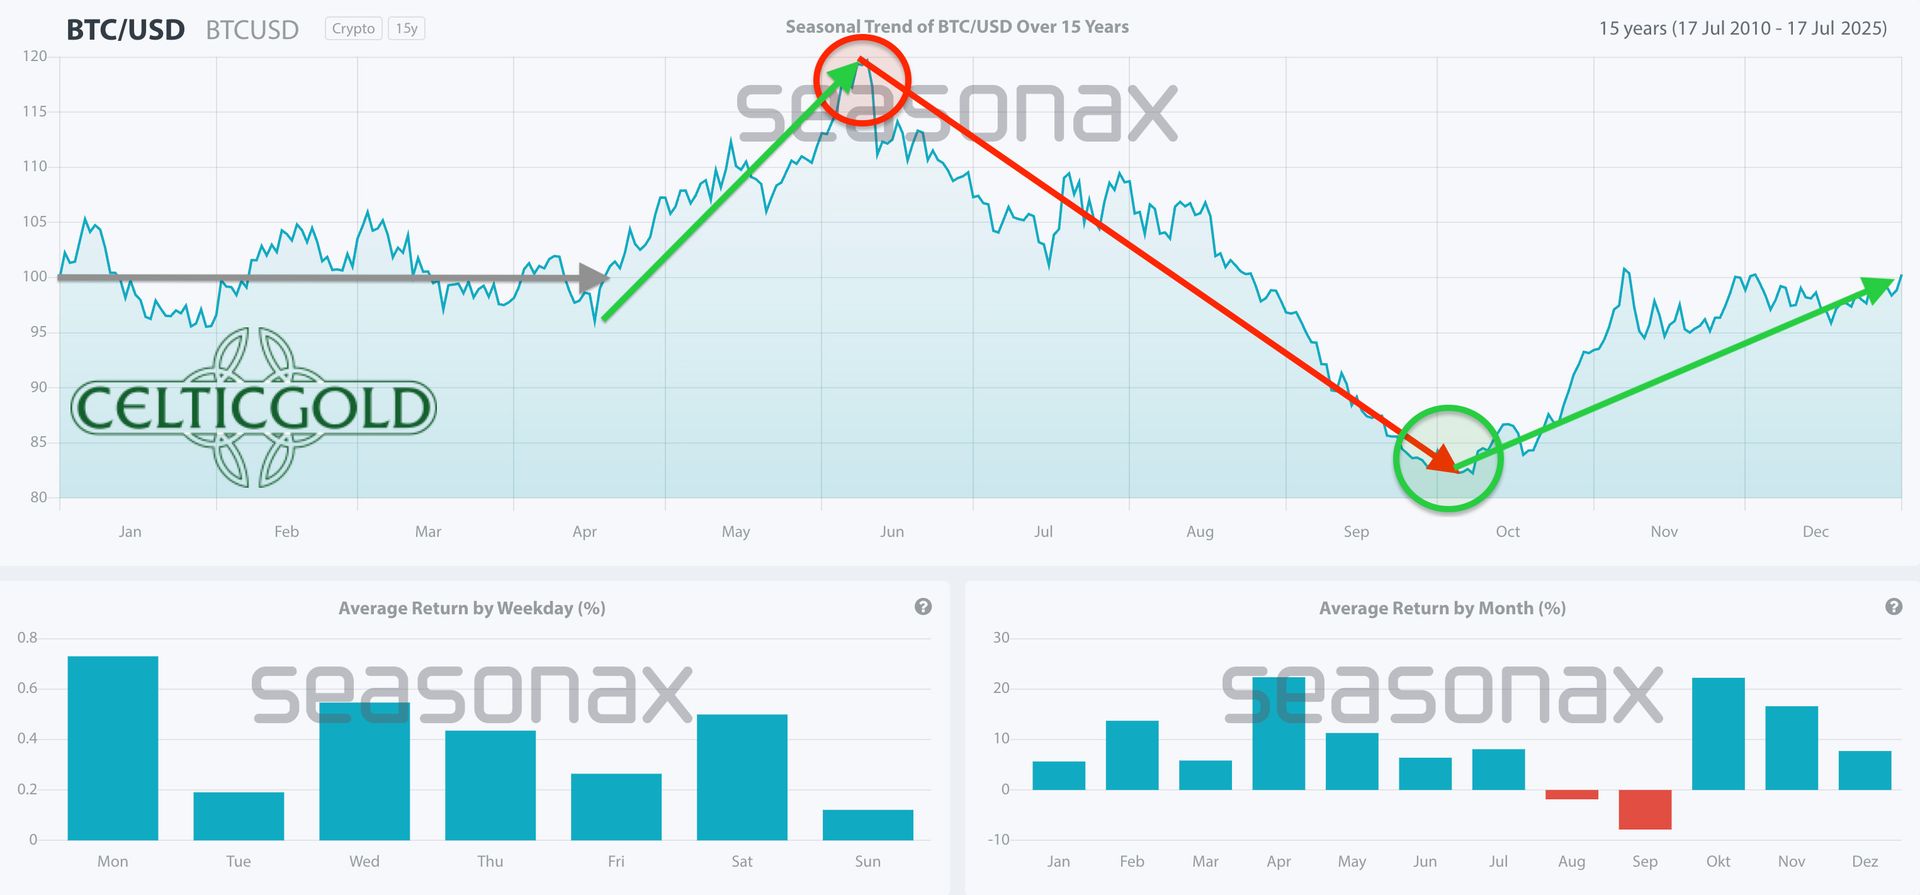 Bitcoin Seasonality as of January 20th, 2026. Source: Seasonax
Seasonal patterns suggest a mixed but generally positive tendency for Bitcoin during the first quarter. Historically, January has often been the strongest month, followed by moderate gains in February and March. In years like 2017, 2021, and 2024, Bitcoin posted strong first-quarter gains—doubling in 2021 from roughly USD 29,000 to USD 58,600—while downturns followed bull cycles in 2018 and 2022.
On average, Q1 performance since 2010 has ranged between +20 % and +30 % during uptrends, influenced by halving cycles, tax effects, and new capital inflows. However, volatility remains high, and statistically, clearer bullish signals tend to reappear only from early to mid-April.
5. Sound Money – Bitcoin vs. Gold (Bitcoin/Gold-Ratio)
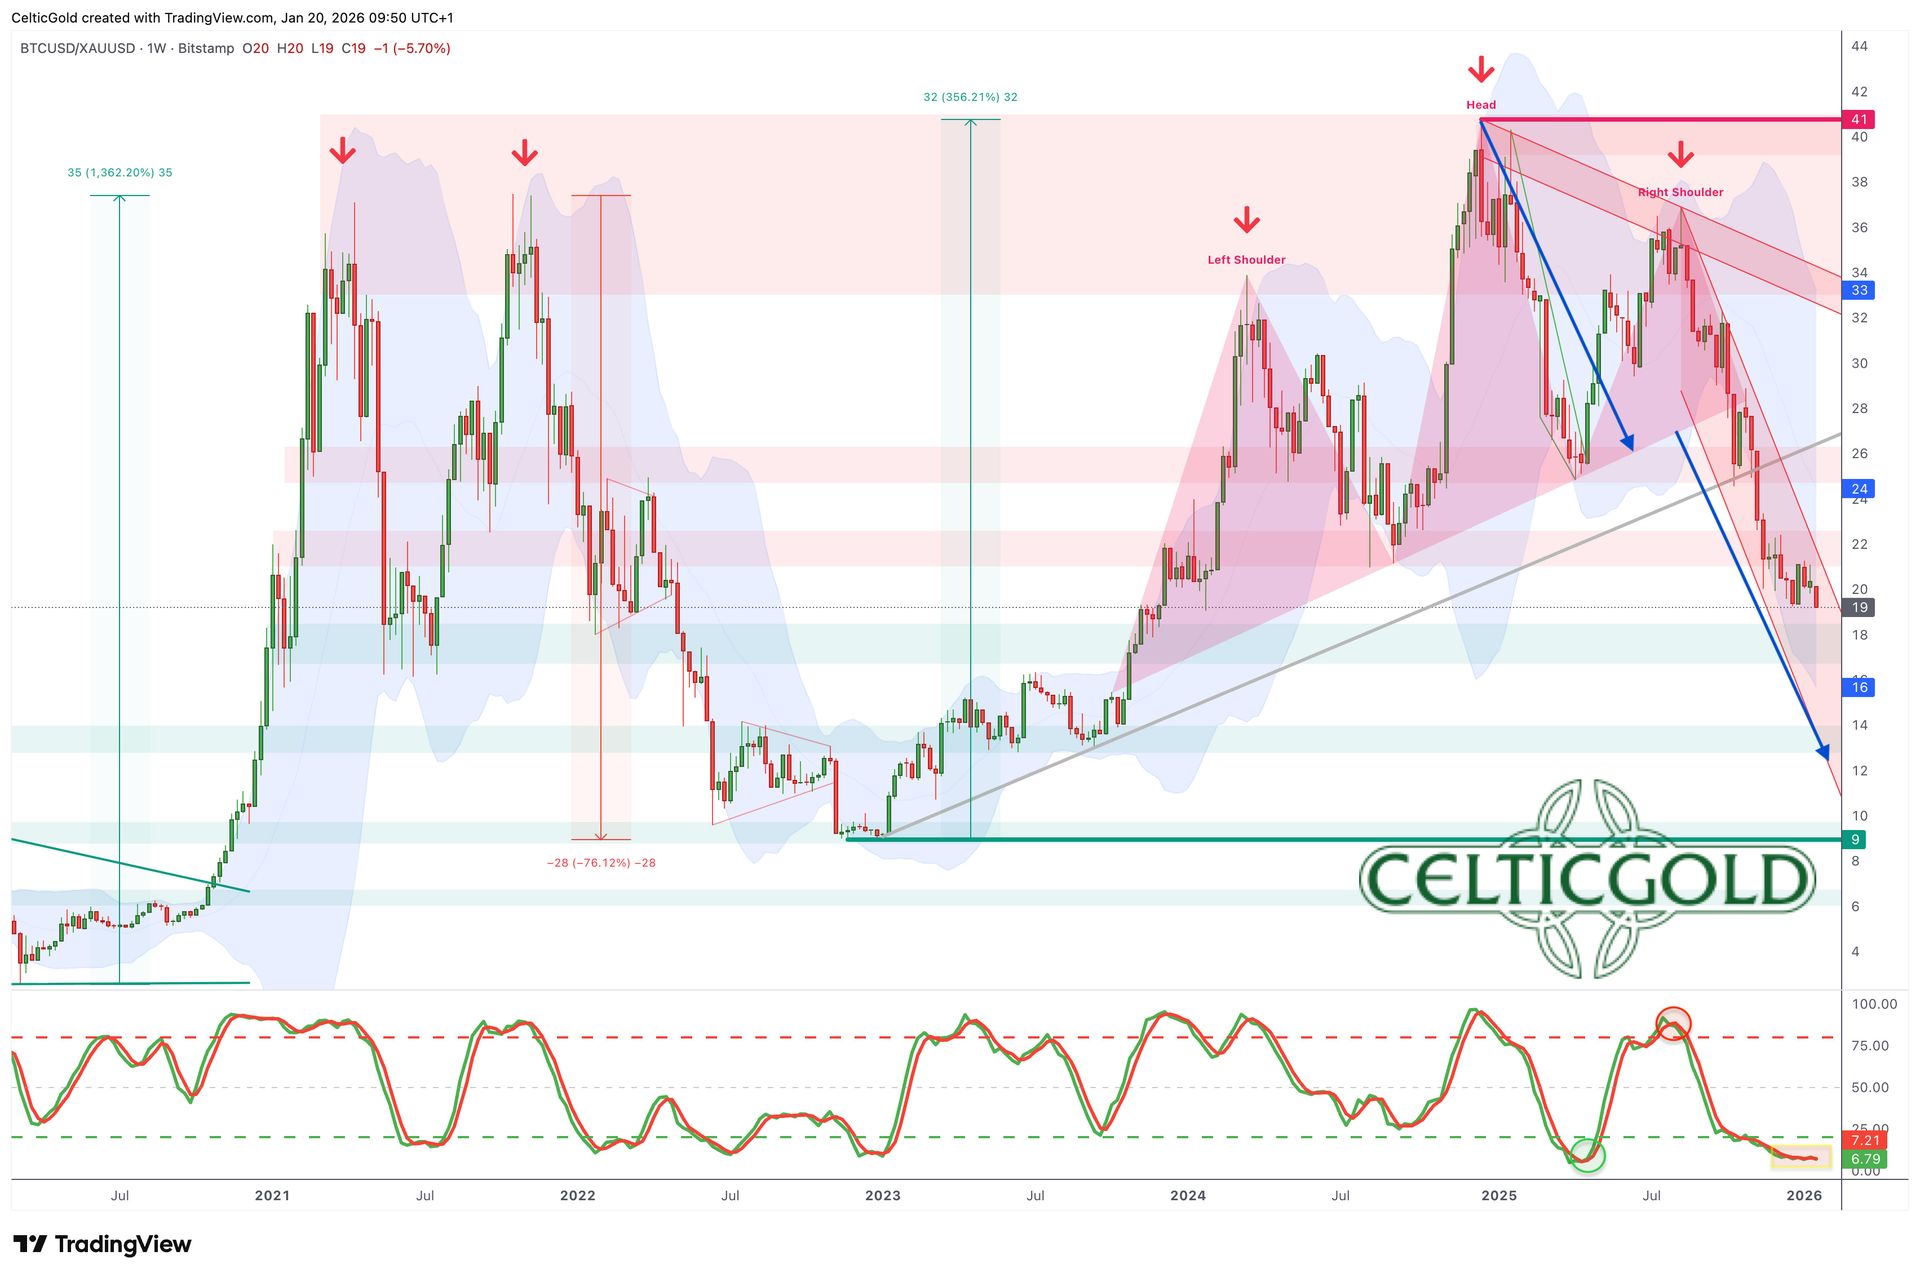 Bitcoin/Gold-ratio, daily chart as of January 20th, 2026. Source: Tradingview
With Bitcoin trading around USD 90,820 and gold at approximately USD 4,725 per ounce, one Bitcoin currently equals about 19.22 ounces of gold—or one ounce of gold costs roughly 0.052 BTC. Bitcoin has managed to stabilise only temporarily against gold’s strong performance; the overall trend still favours gold.
The Bitcoin/Gold Ratio is mainly driven by macro factors such as central-bank policy, global liquidity, and inflation expectations. Low interest rates generally support risk assets like Bitcoin, while gold benefits from uncertainty. Bitcoin-specific drivers—ETF inflows, halving cycles, regulatory clarity, and political support (e.g. under the Trump administration)—can strengthen institutional demand and boost BTC relative to gold. Still, gold’s stability, geopolitical demand, and its perceived safe-haven status dominate for now.
At a current ratio of 19.22:1, Bitcoin appears relatively undervalued versus gold compared to the 41:1 high seen in December 2024. Historically, lower ratios often precede periods where Bitcoin outperforms gold. Technically, however, no reversal in Bitcoin’s favour is yet visible; a sustained downtrend continues, potentially extending toward a ratio of 12:1. Only a breakout above 22 would signal a meaningful trend change.
6. Macro Update - Global Risk Aversion, Gold Surges, Bitcoin Falls
On Monday morning, global financial markets were gripped by a new wave of risk aversion. The trigger came from two simultaneous shocks: fresh tariff threats from Washington and political uncertainty in Japan. As headlines reported a possible snap election and a planned tax cut, yields on Japanese government bonds surged—the 30-year bond hit 3.58%, its highest level since its introduction. At the same time, stock and crypto markets plunged as investors fled to the safe haven of precious metals. Gold climbed to a new record high at USD 4,730, while silver rose slightly above USD 95.50, and Bitcoin fell back to USD 90,600.
These drastic moves reflect a profound reallocation of global capital flows. Amid monetary policy uncertainty in Japan, mounting public debt, and new trade tensions under US President Trump, market participants are increasingly seeking shelter in low-risk assets. The combination of rising bond yields and soaring gold prices signals a clear flight from risk—a warning sign of a potential period of elevated market volatility and temporarily shrinking liquidity.
New Fed liquidity meets fragile markets
 All roads lead to inflation
Starting Tuesday, the Federal Reserve is expected to inject roughly USD 55.3 billion directly into the markets—a QE-like program that could boost risk assets such as stocks and crypto. Meanwhile, US debt has now surpassed USD 38 trillion, generating annual interest costs of USD 1.17 trillion. This leaves the central bank in a deadlock: inflation or insolvency. This twin-deficit syndrome—where fiscal deficits spill over into trade deficits—destabilises the dollar equilibrium and drives investors into alternative assets. From this perspective, gold and Bitcoin serve as forms of monetary life insurance. Yet, while gold responds to global buying with strong price gains, Bitcoin depends on private risk appetite and network security—and remains in a downtrend.
Gold decouples from real interest rates
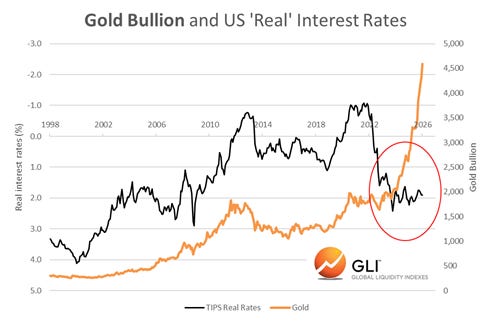 Gold and real US Interest Rates, as of January 16th, 2026. Source: GLI
Since the beginning of the great gold bull market in late February 2024, gold prices have decoupled from real interest rates, marking a macro-historical turning point. Central banks, especially those from BRICS nations, now hold more gold than US Treasuries for the first time in 30 years. This is not just a massive vote of no confidence in US fiscal policy but also a clear signal of a structural de-dollarisation cycle. Geopolitical hedging and physical scarcity have made gold a strategic asset—both supranational and censorship-resistant. And in Bitcoin terms, gold has already performed thousands of years of 'proof of work'.
Physical fortress vs. speculative chain
Both Bitcoin and gold derive their appeal from their status as 'outside money'—assets beyond state liability. The difference lies in infrastructure: gold exists entirely outside the digital realm, while Bitcoin depends fully on it. In a world of rising cybersecurity risks and AI-driven attack vectors, gold’s lack of third-party risk is increasingly attractive—it cannot be hacked. Bitcoin, by contrast, remains volatile because its security budget is tied directly to speculation.
Bitcoin’s structural dilemma
Technically, Bitcoin faces a structural bind. With each halving, the block subsidy—and thus the network’s security spending—is cut in half. Without exponential price growth or persistently high transaction fees, the mining incentive model collapses. This 'security recession' is not a fringe issue but an economic inevitability if price or usage volume stagnate. In economic terms, Bitcoin must either inflate or risk being attacked.
Gold’s quiet renaissance
Despite Bitcoin and crypto dominating headlines due to spectacular price gains in recent years, a silent, epochal shift back to gold has taken place. Gold—once dismissed as a 'relic'—has re-emerged as a geopolitical tool, the quiet backbone of a multipolar financial system. Bitcoin could conceptually play the same role, yet it lacks regulatory acceptance and physical anchoring.
Bitcoin and the new security paradox
The recent Bitcoin theft of USD 282 million was not an isolated case—it was a macroeconomic wake-up call. The incident showed that technological security (hardware wallets, multi-signature setups, cold storage) is only as strong as the human factor. Social engineering increasingly undermines the entire security architecture of the crypto market. In an environment where a single mistake can wipe out millions, trust is shifting from technology to psychology—a critically underestimated macroeconomic factor.
Privacy coins and the shadow-liquidity dilemma
The hacker’s conversion of the entire loot into Monero through dozens of instant-swap services reveals a growing phenomenon: privacy assets as endpoints of illicit liquidity. Monero’s short-term price surge of 80% was not a normal market cycle but a liquidity shock fueled by criminal capital. This episode illustrates how privacy coins now function as a 'digital shadow banking system'—outside AML frameworks yet within an increasingly digital global financial network.
Trust as the ultimate scarcity
The case exposes the true bottleneck of the crypto ecosystem: trust as a rare human resource. While Bitcoin is mathematically scarce and gold physically scarce, trust remains limited and vulnerable to social engineering. Hardware can be secured, but it cannot protect against human failure. Paradoxically, this very mistrust fuels demand for decentralised assets: the more human error becomes visible, the more appealing 'error-free' systems appear.
Bitcoin’s macroeconomic paradox
Macroeconomically, Bitcoin occupies a paradoxical position. On one hand, it is increasingly viewed by institutional portfolios as a strategic hedge against inflation; on the other, it remains one of the most systemically fragile assets. Regulatory barriers—from MiCA to US stablecoin bills—further restrain the market, as traditional banks see their profitability and control under threat. Here, stablecoins act as the hinge: they challenge the foundations of modern banking by offering savers potentially market-based interest rates.
Banking lobby and the interest rate war
The blockage of US crypto legislation highlights a deeper power struggle. Banks profit from interest rate spreads—they pay 0.1% while parking deposits with the Fed at up to 4%. Stablecoins like USDT threaten this model. The result is an open lobbying war over control of private money creation in the digital age. This dynamic is economically more consequential than the legal question of 'SEC or CFTC', since US banks fear a potential outflow of around USD 6 trillion in deposits to stablecoin yields—such as Coinbase’s 3.5% on USDC. The CLARITY Act conflict (Coinbase vs. the White House) is escalating, and Bank of America has already warned of a credit collapse. Venezuela, meanwhile, conducts about 80% of its oil trade via USDT.
Tether as a private central bank
Stablecoins are used primarily for trading infrastructure rather than everyday payments. Tether Holdings Limited, based in the British Virgin Islands, is the parent company behind the world’s largest stablecoin, USDT, and also controls the crypto exchange Bitfinex. The company manages more than USD 181 billion in reserves, including large holdings of US Treasuries, about 116 tons of gold, and over 100,000 bitcoins. With fewer than 100 employees, Tether generates roughly USD 10 billion in annual profit—mainly from interest income, but also through diversification into agriculture and mining. The stablecoin giant drives dollarisation in developing regions, moves USD 47 trillion annually via professional traders, and converts roughly 15% of its quarterly profits into Bitcoin. Despite US restrictions, Tether operates under the GENIUS Act, effectively creating two dollar worlds: regulated vs. offshore.
Bitcoin’s fundamental crisis
Bitcoin, by contrast, has zero exposure to blockchain growth sectors such as stablecoins, DeFi, or tokenised real-world assets—the 'fat protocol' thesis is effectively dead. The USD 282 million Trezor social-engineering hack again exposed security flaws, while halvings continue to reduce miner subsidies and Bitcoin’s governance ossifies into oligarchy.
Bitcoin’s governance structure is stuck in a form of 'centralised anarchy': formally decentralised but practically oligarchic. A handful of core developers control GitHub access—and thus the development path. This centralisation prevents economically necessary yet politically unpopular adjustments. In macroeconomic terms, Bitcoin suffers from institutional inertia—a governance deficit comparable to that of traditional nation-states.
The assumption that transaction fees will ultimately sustain network security contradicts economic reality. In a competitive market, users will simply migrate away if fees rise too high. On-chain capacity limits make Bitcoin inherently deflationary in functionality—the higher the cost of security, the lower its utility. This slows adoption and deters institutional users. In short, Bitcoin is moving along a curve of diminishing marginal returns amid rising opportunity costs.
Conclusion: Two worlds, one narrative
Macroeconomically, gold and Bitcoin are no longer in competition but part of a sequence: gold leads, Bitcoin follows. While states secure themselves physically, individuals seek digital alternatives. But the market is unforgiving: mathematical scarcity cannot replace economic trust. Unless Bitcoin addresses its governance and security flaws, gold could once again become the 'risk-free asset' of the 21st century—leaving Bitcoin a brilliant but self-destructive experiment.
7. Conclusion: Bitcoin - Gold Rally vs. Crypto Winter
Since the crash from USD 126,272 to USD 80,537, Bitcoin has been struggling to form a lasting bottom. The failure at the 38.2 % Fibonacci level around USD 98,000 casts doubt on the likelihood of a sustained rebound in the near term. The daily chart suggests ongoing consolidation around the 50-day moving average. A new upward attempt toward USD 98,000–USD 100,000 remains possible, but the Bitcoin/Gold Ratio points to a medium-term decline toward roughly USD 60,000.