
1. Review
Despite the impressive recovery in August and September, the question of whether the crypto winter is truly over remains unresolved. From its record high of USD 126,272 on 6 October 2025, Bitcoin fell by around 54% to USD 57,735 on 1 July 2026. Following seven weeks of bottoming, the sharp breakout from its nine-month downtrend channel on 17 August triggered a powerful recovery. Bitcoin quickly climbed above USD 79,000 and, a few weeks later, reached USD 87,374 on 21 September. From the July low, that represents a gain of more than 50% in less than three months.
Since then, however, the recovery has stalled. Over the weekend, Bitcoin briefly slipped back below the psychologically important USD 80,000 mark. With financial markets increasingly unsettled just one week ahead of the US midterm elections, the support zone around USD 80,000 has moved sharply into focus. So far, the technical damage remains manageable. Yet the USD 80,000–81,500 area is likely to contain the average entry prices of many US-listed spot ETFs and publicly traded Bitcoin treasury companies. Bitcoin is therefore testing not only a key technical support level, but also the resilience of two major groups of buyers.
In fact, in early September we explicitly warned of a potential pullback toward the rising 200-day moving average. At present, the headwinds are coming mainly from the macroeconomic backdrop and the broader financial-market environment. On 16 September, the Fed raised interest rates for the first time in three years; US inflation reached 3.7% in September; the yield on 10-year US Treasuries stands at around 5%; and Brent crude trades above USD 110. Meanwhile, ETF outflows of USD 635 million on 22 October—the largest daily outflow since June—signaled waning demand. In this environment, Bitcoin has nevertheless held up reasonably well.
The decisive question over the coming days and weeks will be whether selling pressure in technology and AI stocks subsides and equity markets begin to stage a year-end rally. In the short term, a further pullback toward USD 73,000–75,000 remains possible. Beyond that, however, the setup should resolve to the upside and finally bring the crypto winter to an end.
2. Technical Analysis for Bitcoin in US-Dollar
2.1 Weekly Chart: Retesting the Former Neckline
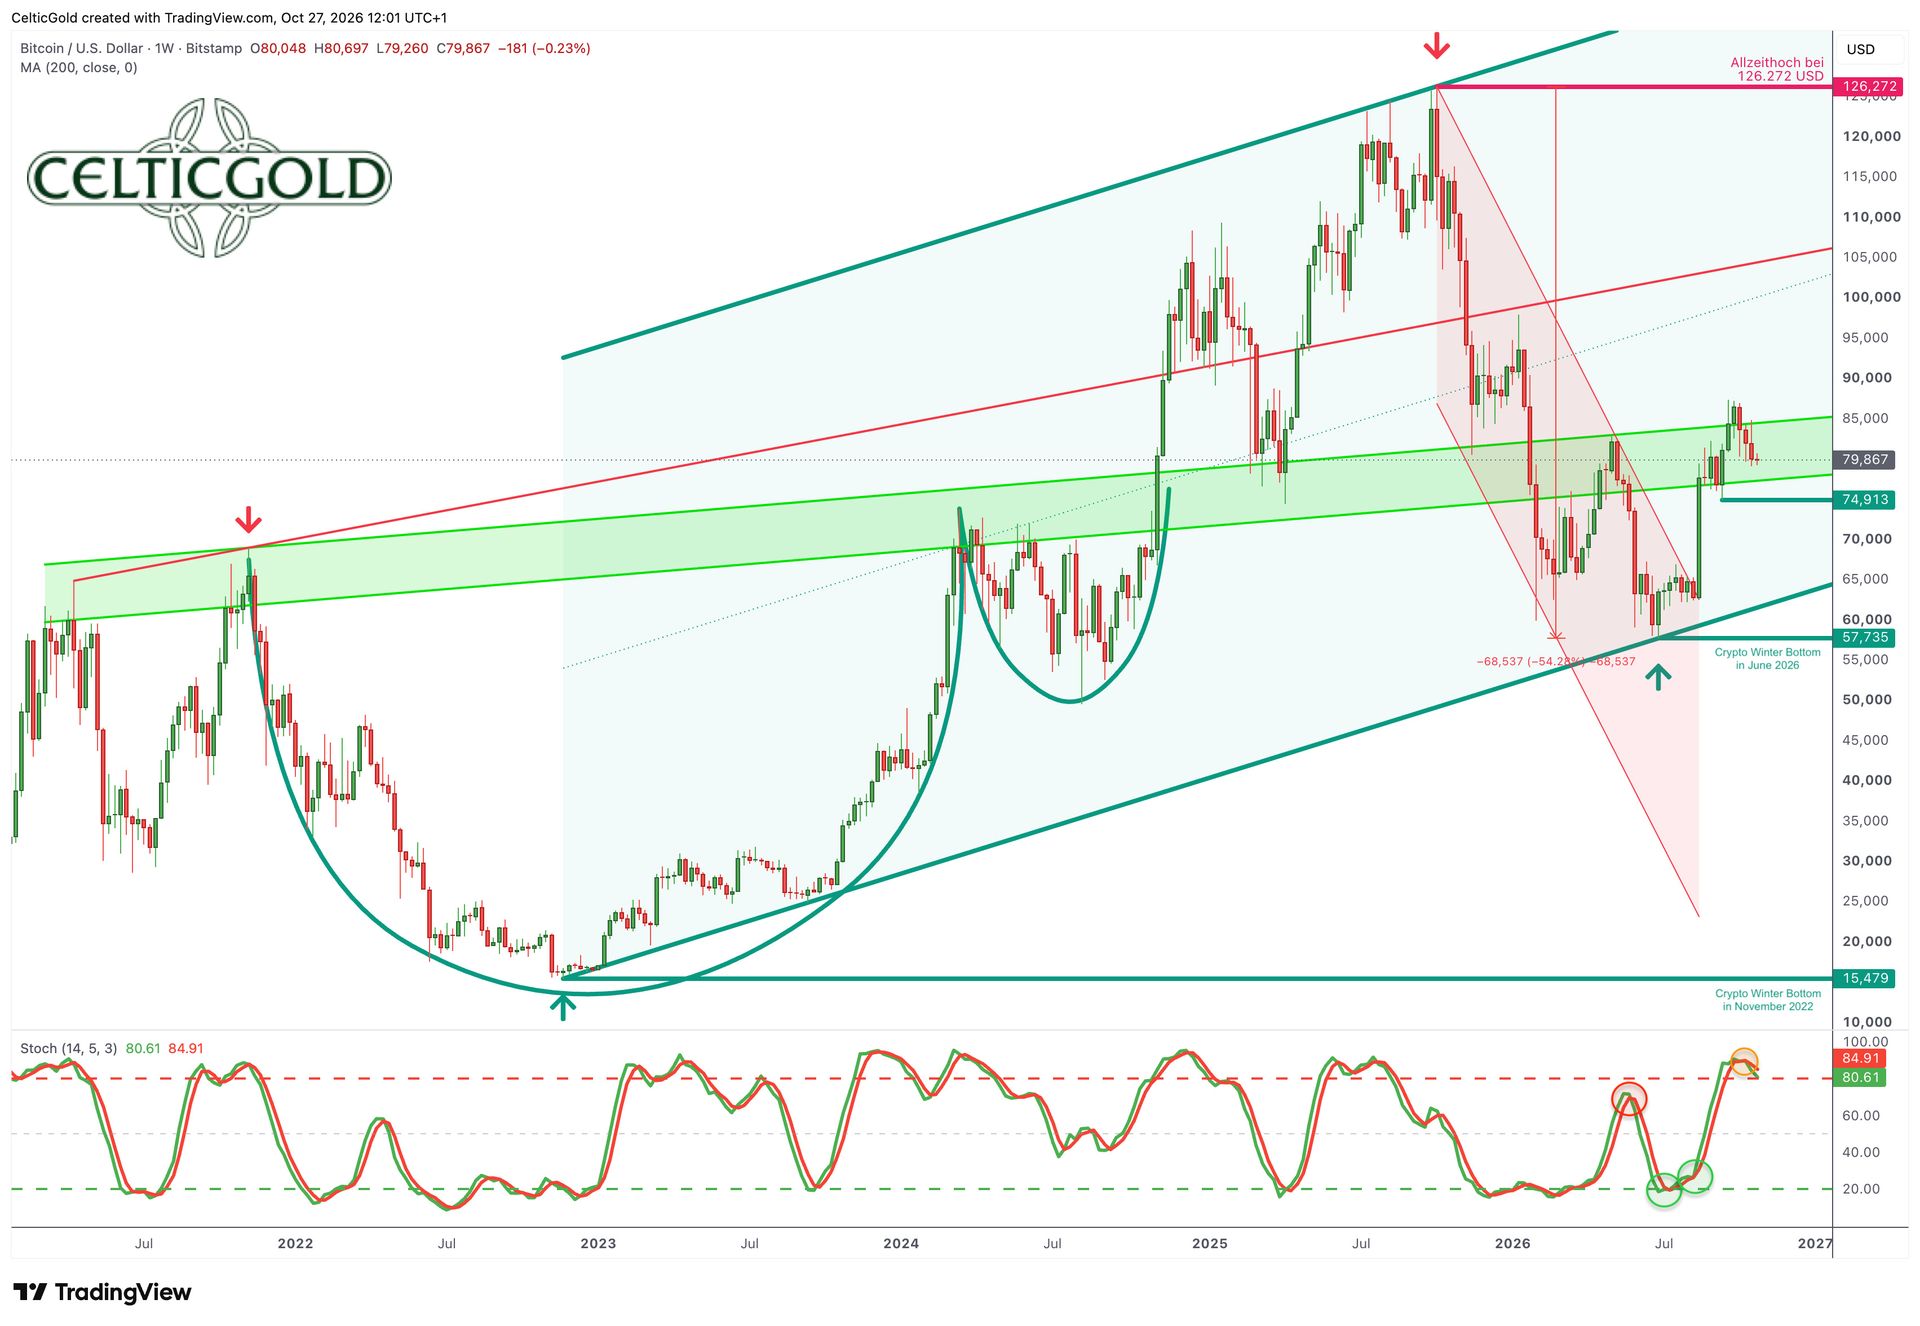
Bitcoin in USD, weekly chart as of 27 October 2026. Source: Tradingview
The weekly chart makes the pivotal importance of the current USD 79,000 – 82,500 trading zone immediately apparent. This area corresponds to the neckline of the former cup-and-handle formation that developed between 2022 and 2024. The gently rising zone has been tested repeatedly from both sides over the past few years. Having broken above it in September, Bitcoin is now retesting it from above.
This reversal of roles—from resistance to support—is the decisive structural question: if the zone holds, the breakout will be confirmed; if it fails, the move will have been a false breakout within a broader bottoming process. A successful defense of this support by the bulls would therefore make Bitcoin's technical picture markedly more bullish.
At the same time, the market structure remains constructive, with the sequence of higher highs and higher lows still intact. Only a close below the September low would bring the young uptrend to an end. On the broader horizon, Bitcoin also remains within the long-term rising channel in place since November 2022; that channel would not be broken unless prices fell below USD 61,500.
One less encouraging factor is the heavily overbought weekly stochastic, whose current setup suggests at least several weeks of consolidation.
In summary, the weekly chart is still bullish, but the overbought stochastic is likely to stand in the way of an immediate continuation of the rally. A treacherous pullback toward USD 75,000 would therefore come as no surprise—and could ultimately prove to be a bear trap, shaking out the last weak hands just ahead of the next major advance.
2.2 Daily Chart: A Pullback to the 200-Day Moving Average as a Buying Opportunity
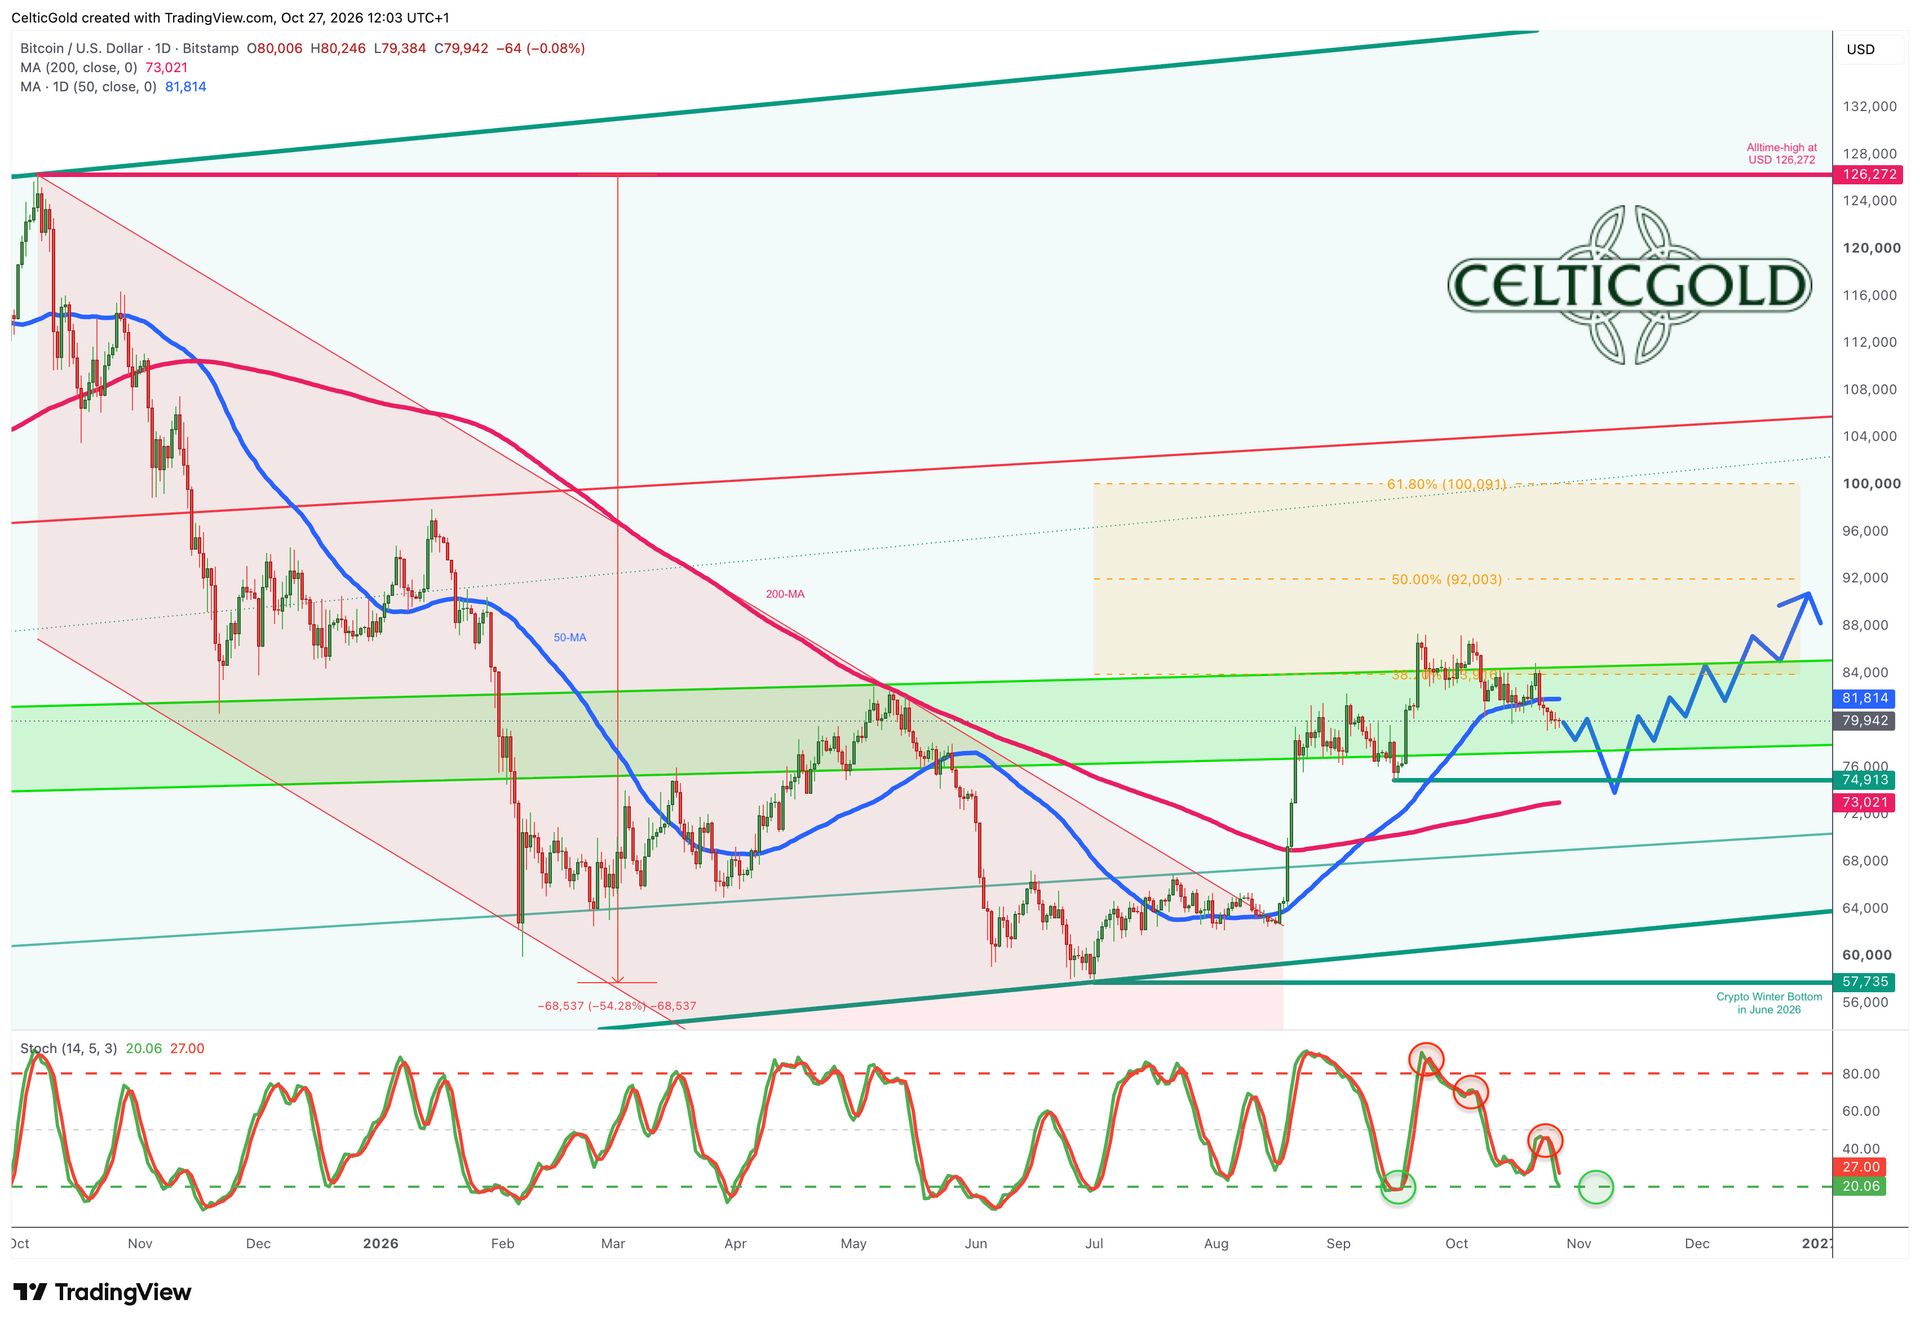
Bitcoin in USD, daily chart as of 27 October 27 2026. Source: Tradingview
On the daily chart, Bitcoin has spent roughly five and a half weeks consolidating in a sideways range between USD 79,000 and USD 87,500, with prices gradually drifting lower. After slipping below the 50-day moving average at USD 81,798, Bitcoin briefly pierced support above USD 80,000 over the weekend, but that area has held again at the start of the week. Interestingly, according to Glassnode, the average cost bases of US spot ETFs and publicly traded Bitcoin treasury companies are clustered just above USD 80,000.
A decisive break below USD 79,000 would likely trigger the test of the closely watched, rapidly rising 200-day moving average at USD 72,987 that we have been anticipating. The bears would need to drive prices down by only another USD 7,000, or roughly 9%—a move that can unfold within days in Bitcoin's volatile market. We highlighted the price pattern from spring 2023 in our previous analysis, and that analogy remains relevant.
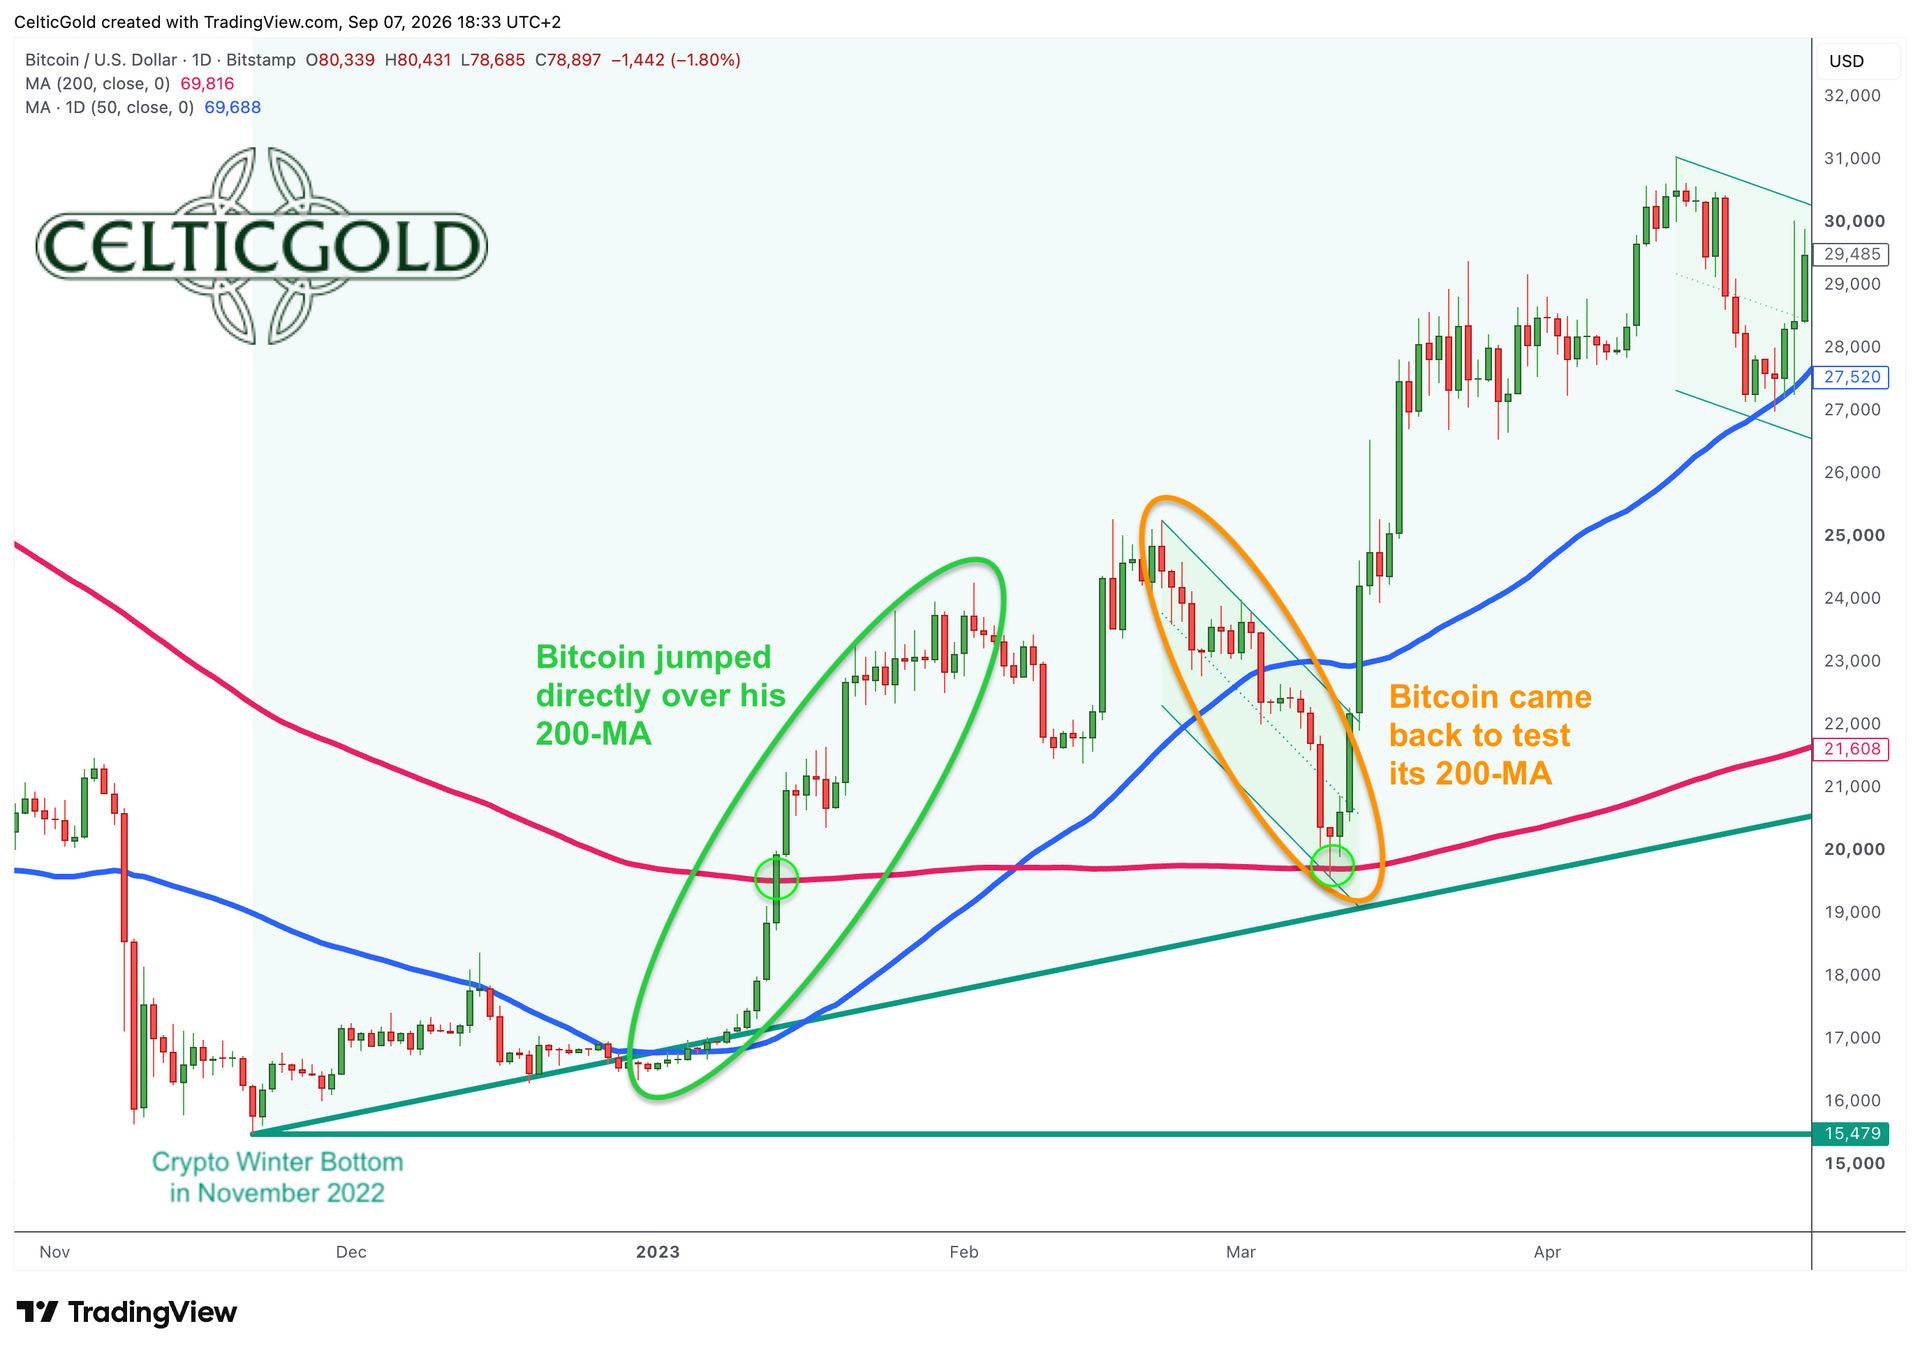
Bitcoin, spring 2023, daily chart as of 7 September 2026. Source: Tradingview
Overall, the daily chart is currently (still) bearish. We first expect a potentially sharp and swift pullback toward the rising 200-day moving average. Yet it is precisely there—in the USD 73,000–75,000 area—that we anticipate an immediate reversal to the upside and the true beginning of the next Bitcoin bull market. Investors who have not yet built a sufficient position may find an excellent buying opportunity in the coming days.
3. Bitcoin Sentiment – A Balanced Market Mood
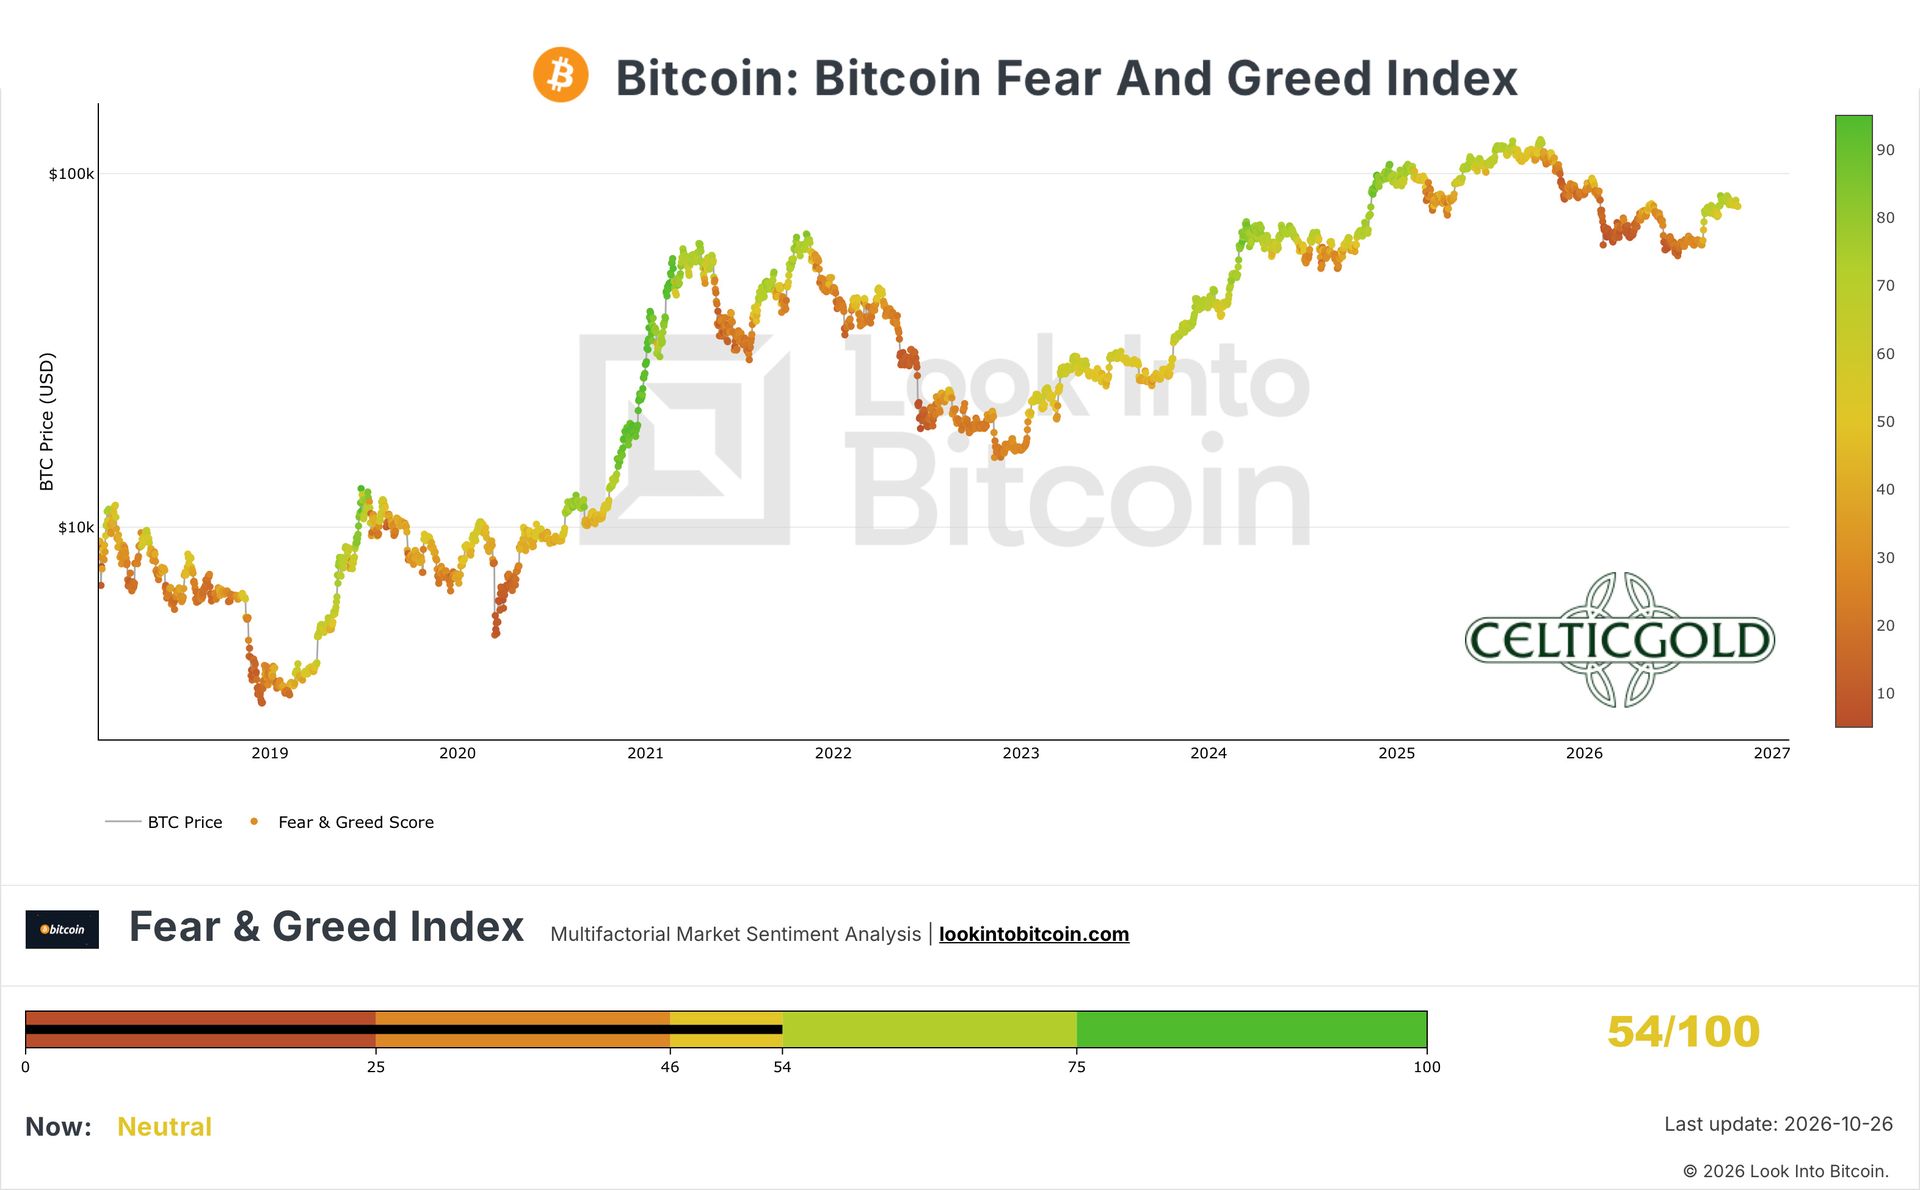
Crypto Fear & Greed Index as of 26 October 2026. Source: Bitcoin Magazine Pro.
The Crypto Fear & Greed Index currently stands at 54, almost exactly in neutral territory. In September, by contrast, sentiment had become excessively euphoric at times. The pullback from USD 87,000 to USD 80,000 has cooled optimism without triggering outright fear. From a contrarian perspective, this is a fairly unremarkable picture. Neither the panic typical of major lows nor the extreme euphoria associated with important price peaks is present. This argues against an imminent collapse, but it does not provide a contrarian buy signal either.
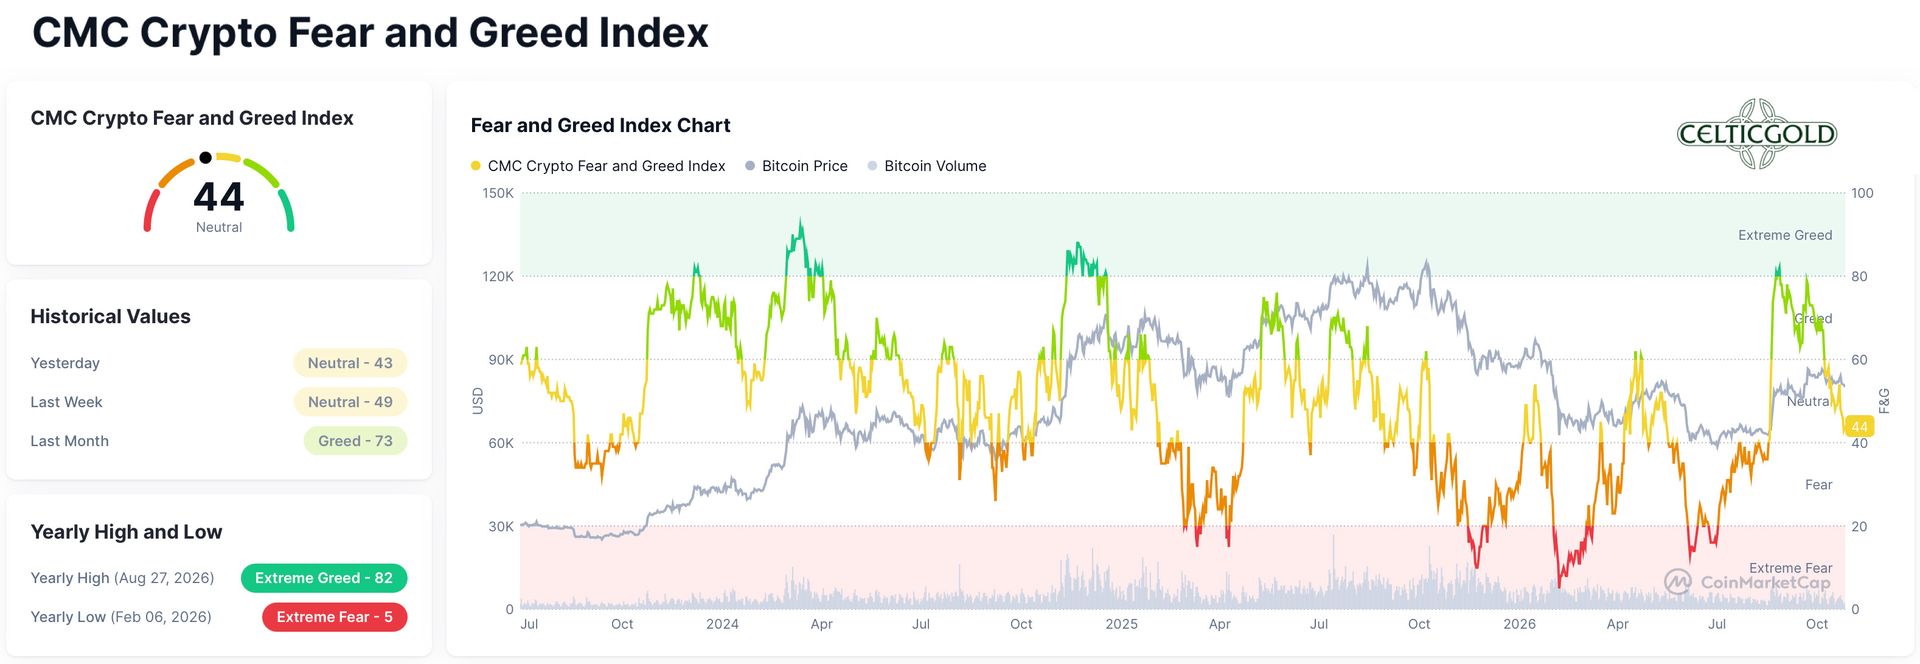
CMC Crypto Fear & Greed Index as of 26 October 2026. Source: Coinmarketcap
A similar picture emerges from CoinMarketCap's CMC Crypto Fear & Greed Index, which captures the broader cryptocurrency market, including the top 10 coins and stablecoin dynamics. The index currently stands at 44 out of 100. Its underlying indicators—market volatility, momentum, social media activity, surveys, and Bitcoin trends—therefore point to a neutral and broadly balanced sentiment backdrop.
In summary, sentiment analysis currently provides neither a warning nor a buy signal. Only a rise above 70 or a plunge below 25 would call for contrarian action.
4. Bitcoin Seasonality – Turning Positive From Here
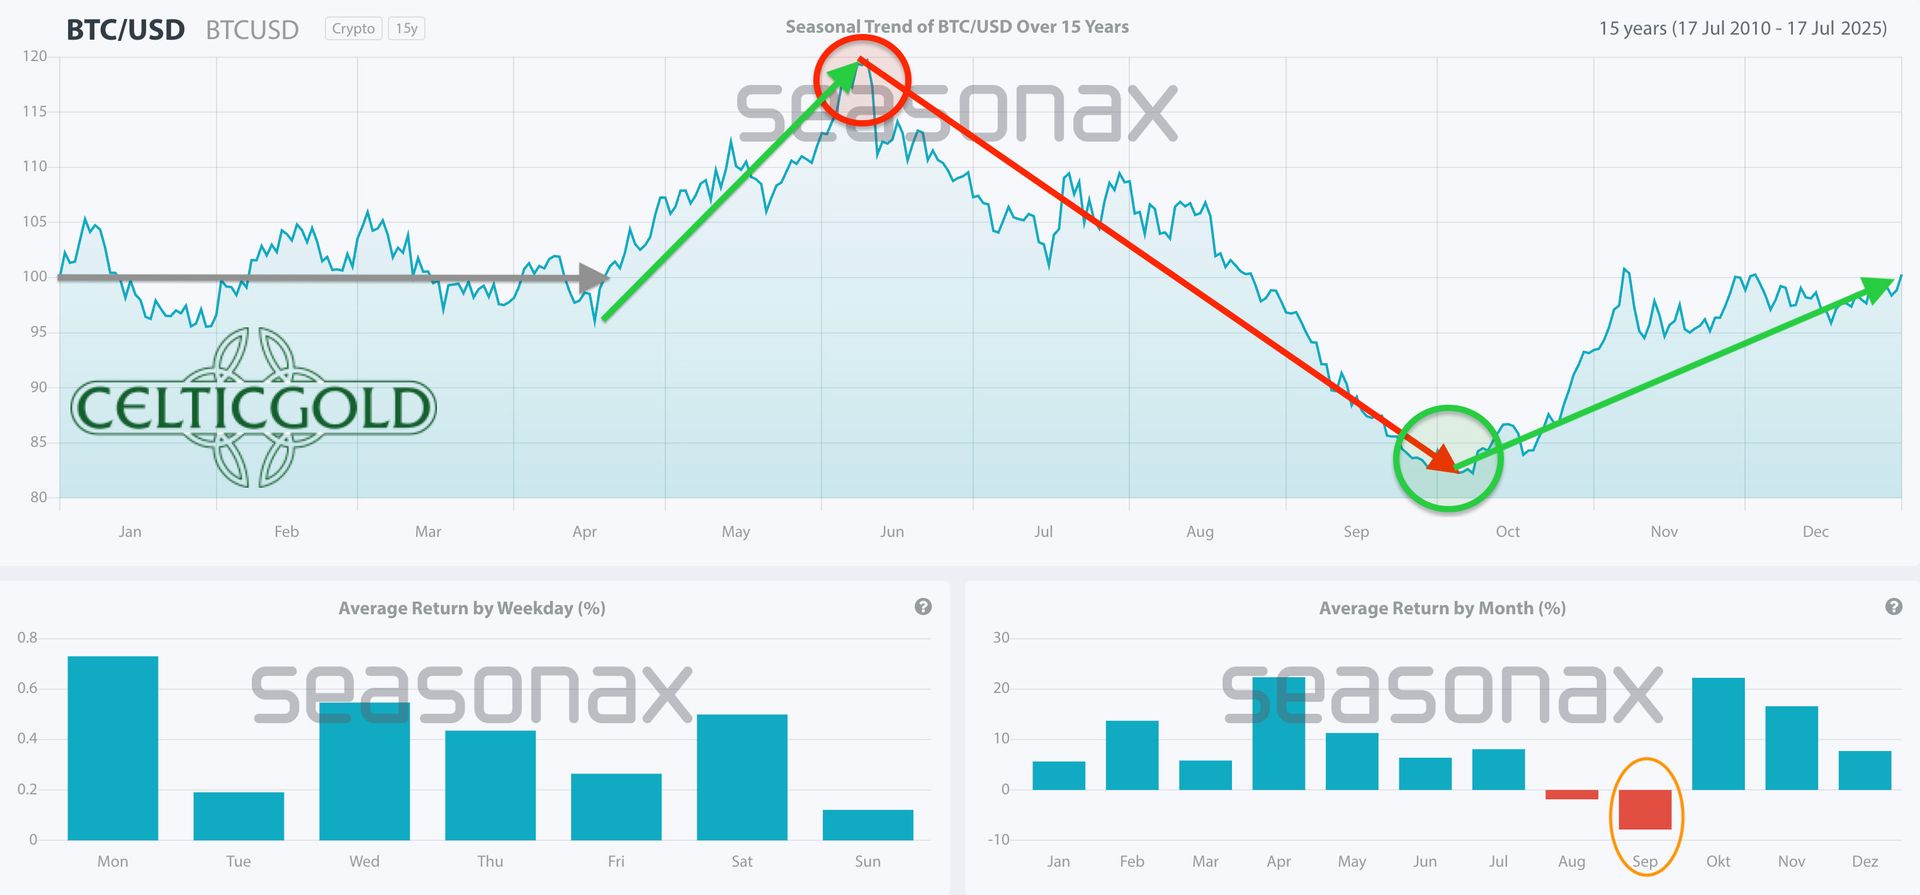
Bitcoin seasonality as of 26 October 2026. Source: Seasonax
Statistically, October ranks among Bitcoin's strongest months, delivering an average gain of more than 20%. November is also clearly positive on average, with a gain of around 17%. However, that figure is heavily distorted by 2013, when Bitcoin surged by roughly 450%. The median return for November is therefore only about 8.8%; excluding the exceptional year of 2013, the other twelve Novembers returned an average of around 7%, according to CoinGlass.
Moreover, October and November—historically regarded as relatively reliable months—both fell well short of their usual performance in 2025. October 2026 has also yet to produce the classic “Uptober” impulse. One possible explanation is that July, August, and September together delivered the first three-month winning streak since 2012.
In summary, seasonality favours a positive trend through year-end and provides a supportive backdrop. The probability that Bitcoin will finish the year above its current level has increased significantly.
4. Bitcoin vs. Gold (Bitcoin/Gold Ratio)
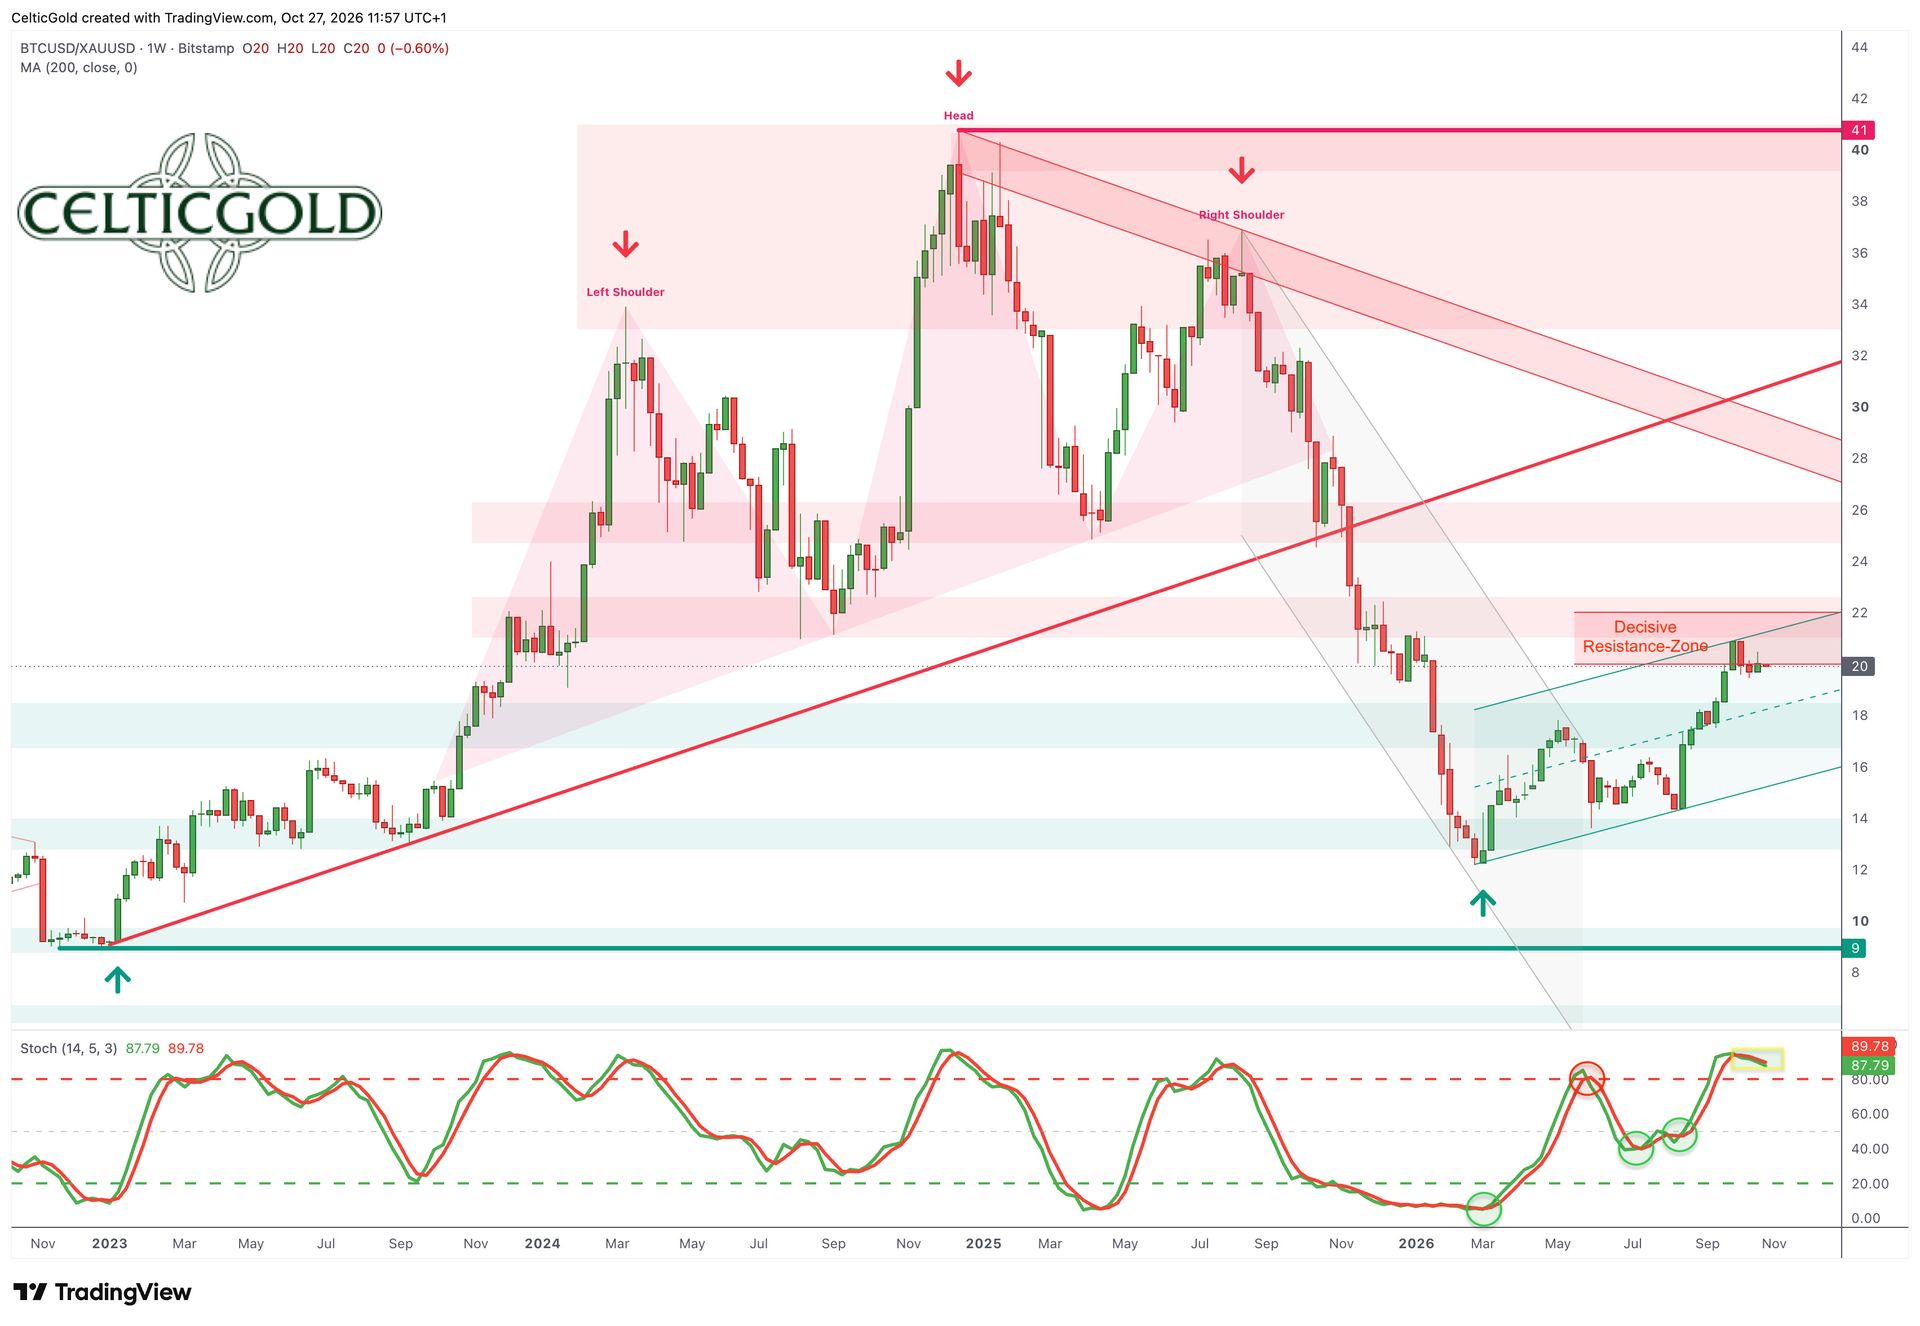
Bitcoin/Gold ratio, weekly chart as of 26 October 2026. Source: Tradingview
With Bitcoin trading around USD 80,000 and gold at approximately USD 4,005 per troy ounce, one Bitcoin is currently worth almost 19.97 ounces of gold. Conversely, one ounce of gold costs around 0.05 Bitcoin.
Bitcoin has therefore significantly outperformed gold over the past two and a half months. The Bitcoin/Gold ratio has climbed from around 14 to above 20, although the underlying turning point was already established on 28 February at 12.2.
While the weekly stochastic is now heavily overbought, the Bitcoin/Gold ratio still needs a breakout above 22 to confirm the reversal. Only then would a new Bitcoin bull market relative to gold be confirmed.
Over the past week, however, both Bitcoin and gold came under pressure. This also exposes the limits of their monetary parallels: both assets declined simultaneously amid high bond yields, a firm US dollar, and selling pressure during market stress. In a correcting equity market, Bitcoin remains the riskier asset, as it is more dependent on liquidity conditions and flows into and out of ETFs and derivatives. Its monetary resemblance to gold lies primarily in its limited supply, the possibility of custody without counterparty risk, and its longer-term response to rising government debt.
In summary, the Bitcoin/Gold ratio remains constructive, but the verdict is still out. A move above 22 would confirm a trend reversal in Bitcoin's favor. A fall back below 18, by contrast, would call the entire recovery since late June into question.
5. Macro Update: AI Deleveraging, Energy Shock, and the Prospect of Geopolitical De-escalation
One week before the US midterm elections on 3 November, financial markets are becoming increasingly tense. Heightened political uncertainty, rising interest rates, geopolitical risks, and a reassessment of oil prices, inflation, and the Fed's next moves are fueling volatility and forcing investors to reprice risk premia.
5.1 Hedge Funds Reduce Their AI Exposure
At the same time, recent market moves point to a broader wave of deleveraging and de-risking. Numerous hedge funds have sharply reduced—or in some cases fully closed—their positions in global AI stocks, as doubts about the long-term returns on massive AI investments have weighed on valuations. Trend-following strategies consequently suffered their weakest week in two years, suggesting that the pressure extends well beyond individual stocks to the wider AI and growth complex.
This creates a complex tension just ahead of the traditional year-end rally. On the one hand, greater political clarity, more stable inflation readings, and a less restrictive interpretation of Fed policy could give risk assets a boost. On the other, higher real yields and growing awareness of valuation risks continue to weigh on assets that generate no ongoing income. This helps explain why gold has corrected considerably since late August and why Bitcoin has also recently come under selling pressure.
5.2 Bitcoin and Gold Under Pressure From De-risking
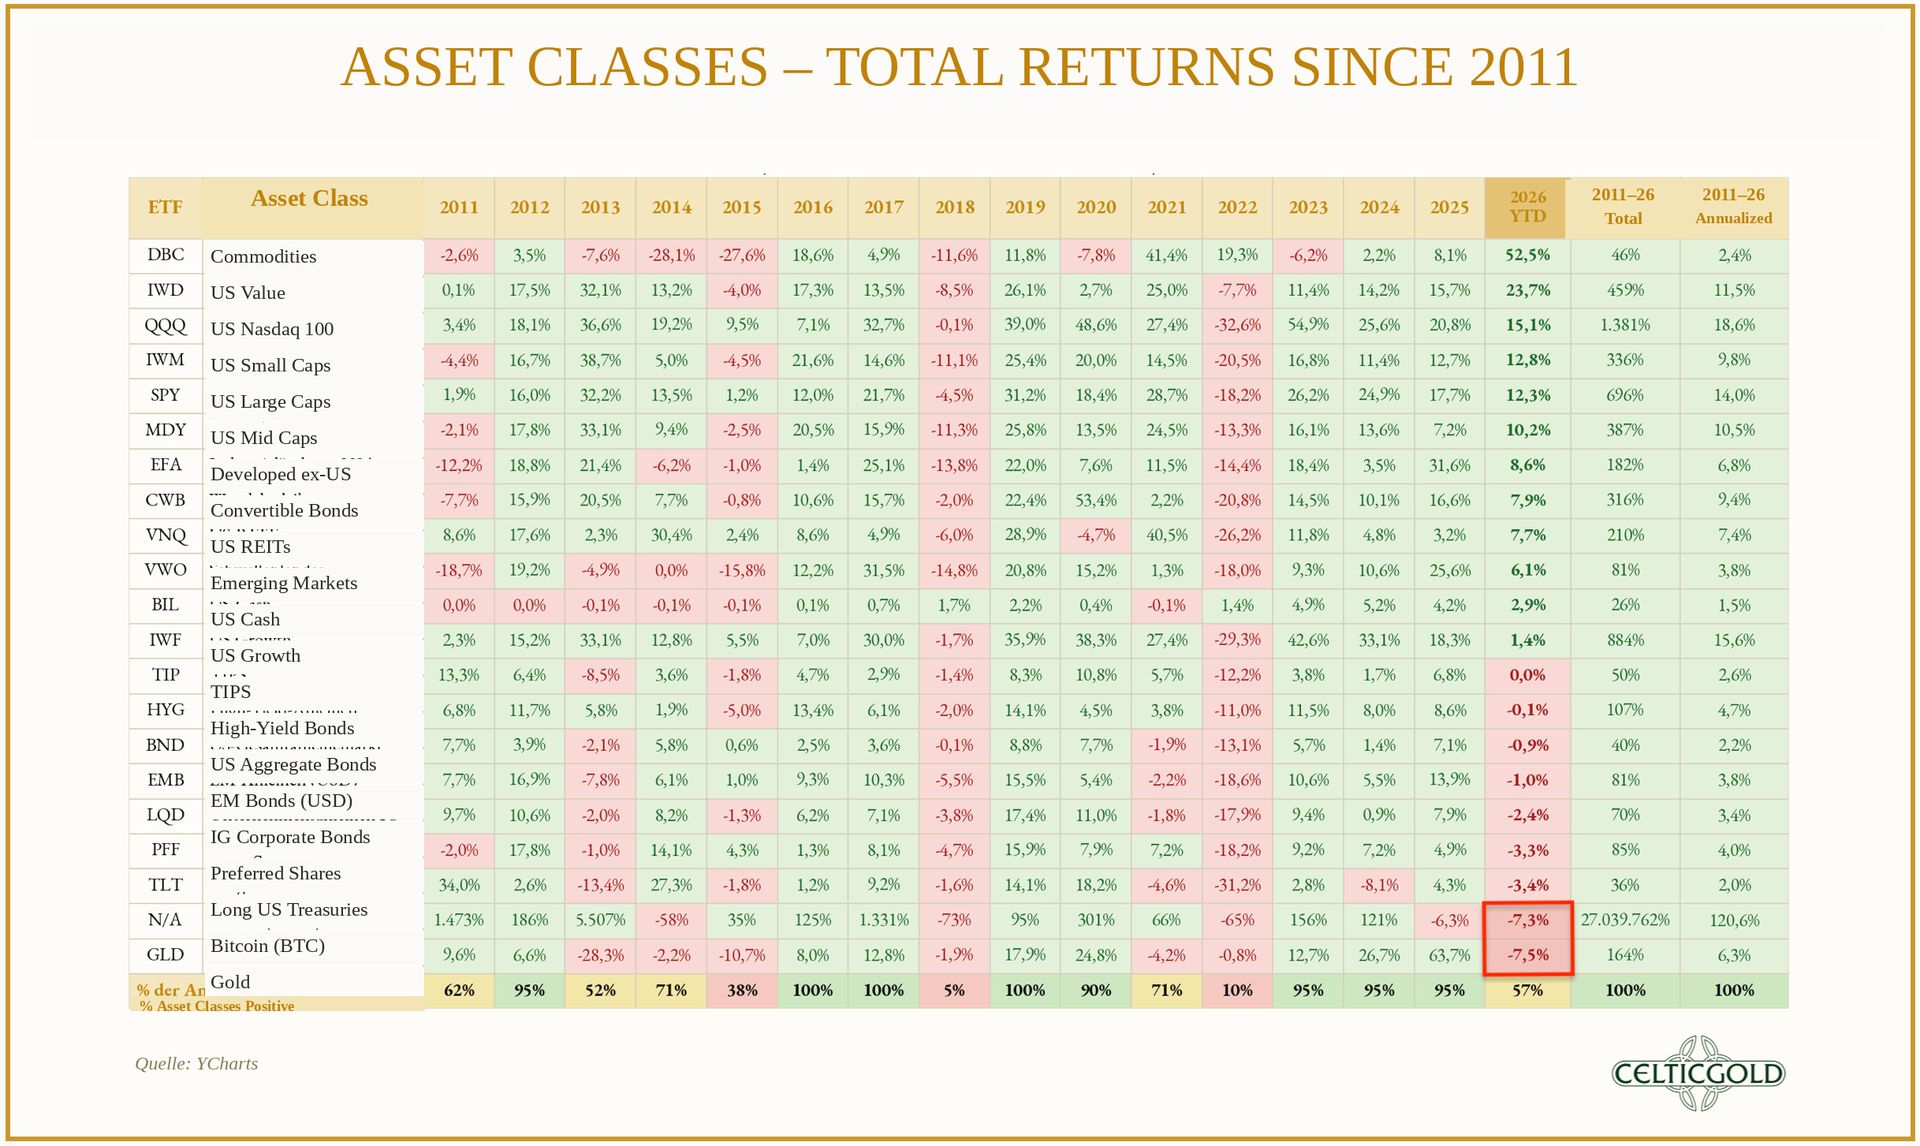
Total returns across asset classes since 2011, as of 25 October 2026. Source: Charlie Bilello
Remarkably, gold and Bitcoin—traditionally viewed as an inflation hedge and a “safe haven,” respectively—are among the weakest major asset classes in 2026. Gold currently trades around USD 4,000 per ounce, while one Bitcoin costs roughly USD 80,000. This underscores that, in the present environment, liquidity, yields, and positioning risk—not the conventional flight into real assets—are driving market behaviour.
In the short term, Bitcoin remains an asset highly sensitive to liquidity and risk appetite. ETFs, publicly traded treasury companies, hedge funds, and leveraged derivatives positions respond rapidly to margin calls, liquidity squeezes, index rules, and shifts in yields. Over the medium and especially the long term, however, there is much to suggest that Bitcoin will retain its role as a scarce, non-sovereign store of value—not least because further expansions of fiat money supplies are already foreseeable.
5.3 China Injects Liquidity Into the Market
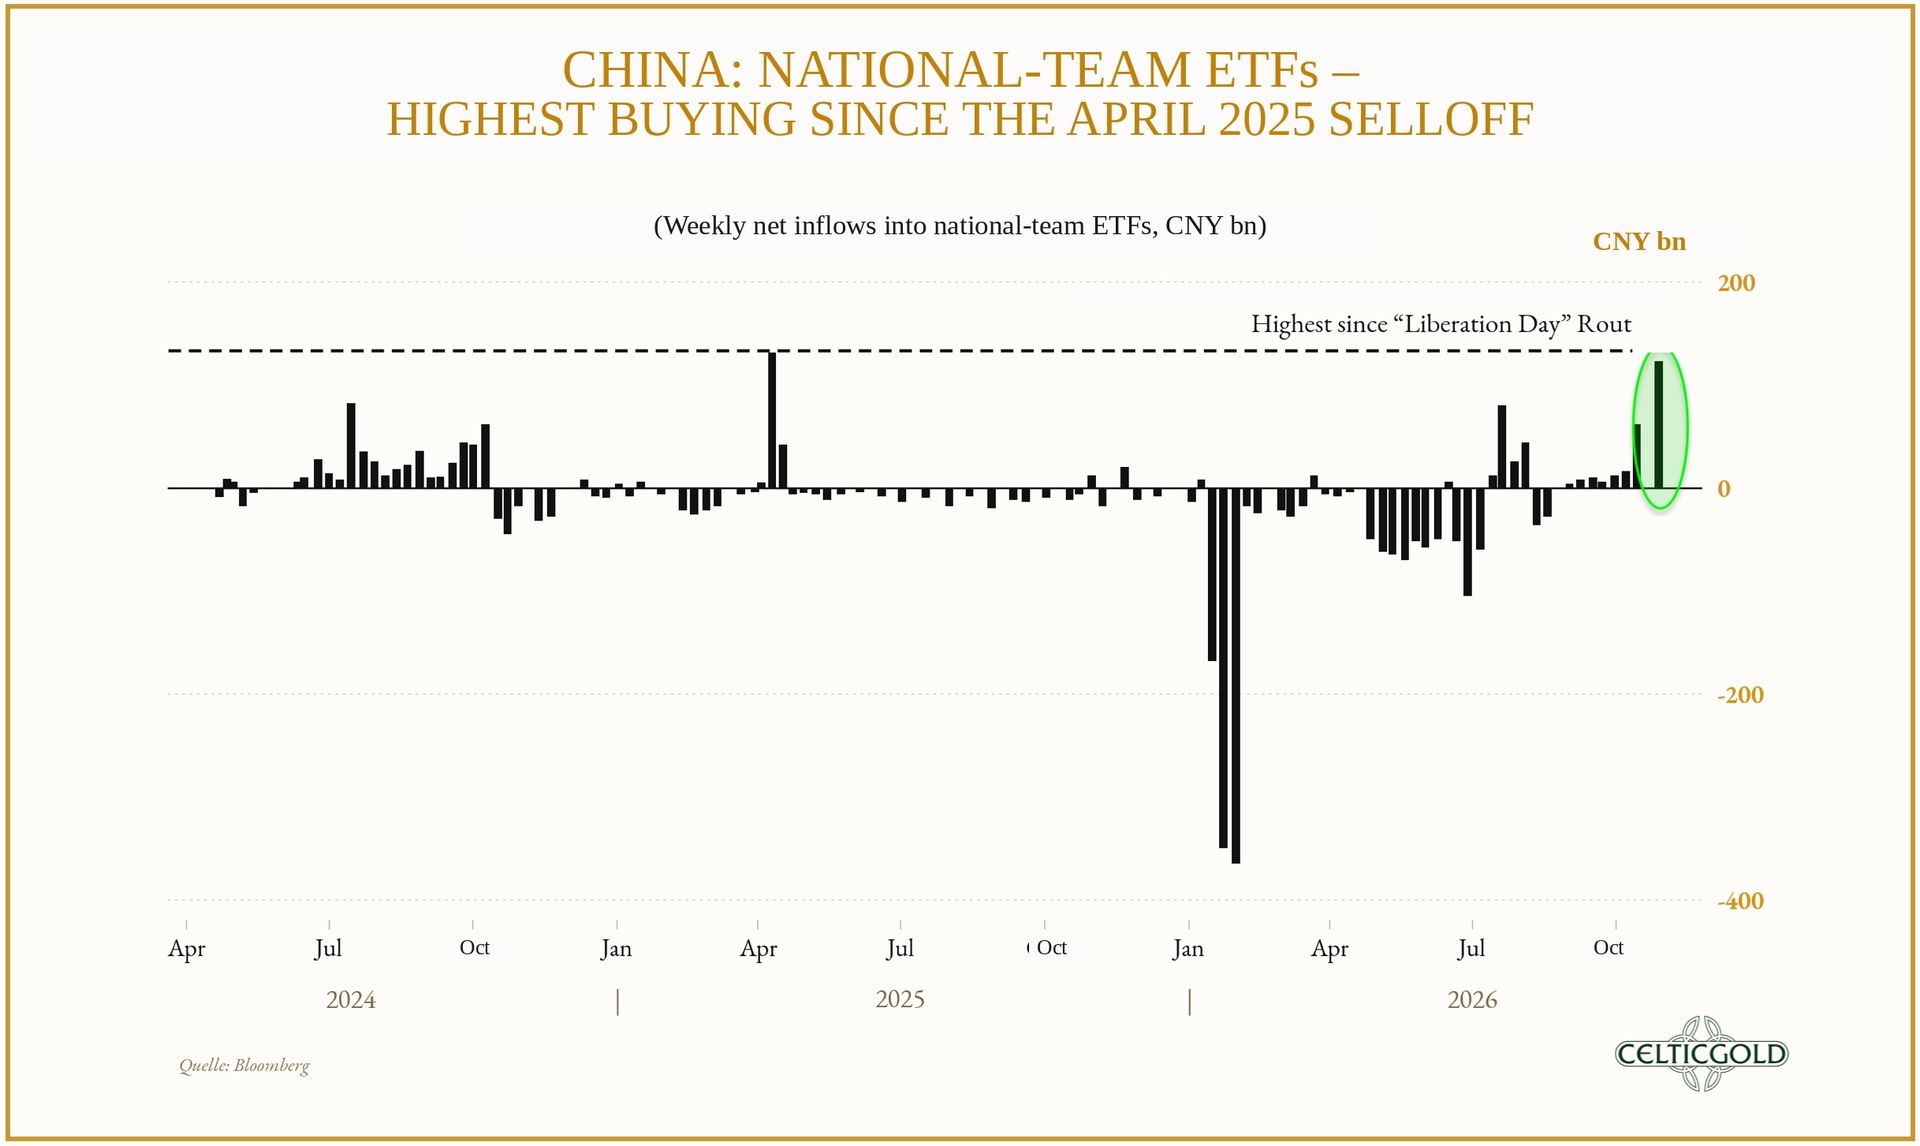
Net inflows into state-backed ETFs in China, as of 26 October 2026. Source: Bloomberg, Barchart
The latest example comes from China. In an effort to halt the longest losing streak in its stock market's history, around CNY 128.7 billion (approximately USD 19 billion) flowed last week into nine ETFs typically used by China's state-backed “national team.” These were the largest weekly net inflows since the market stabilisation measures of April 2025, when Beijing also intervened aggressively amid trade tensions. The episode again demonstrates how quickly governments resort to liquidity injections, buying programmes, and indirect support measures during acute market crises—a pattern that underscores the long-term appeal of scarce, non-sovereign stores of value such as Bitcoin.
5.4 Record Demand for Downside Protection
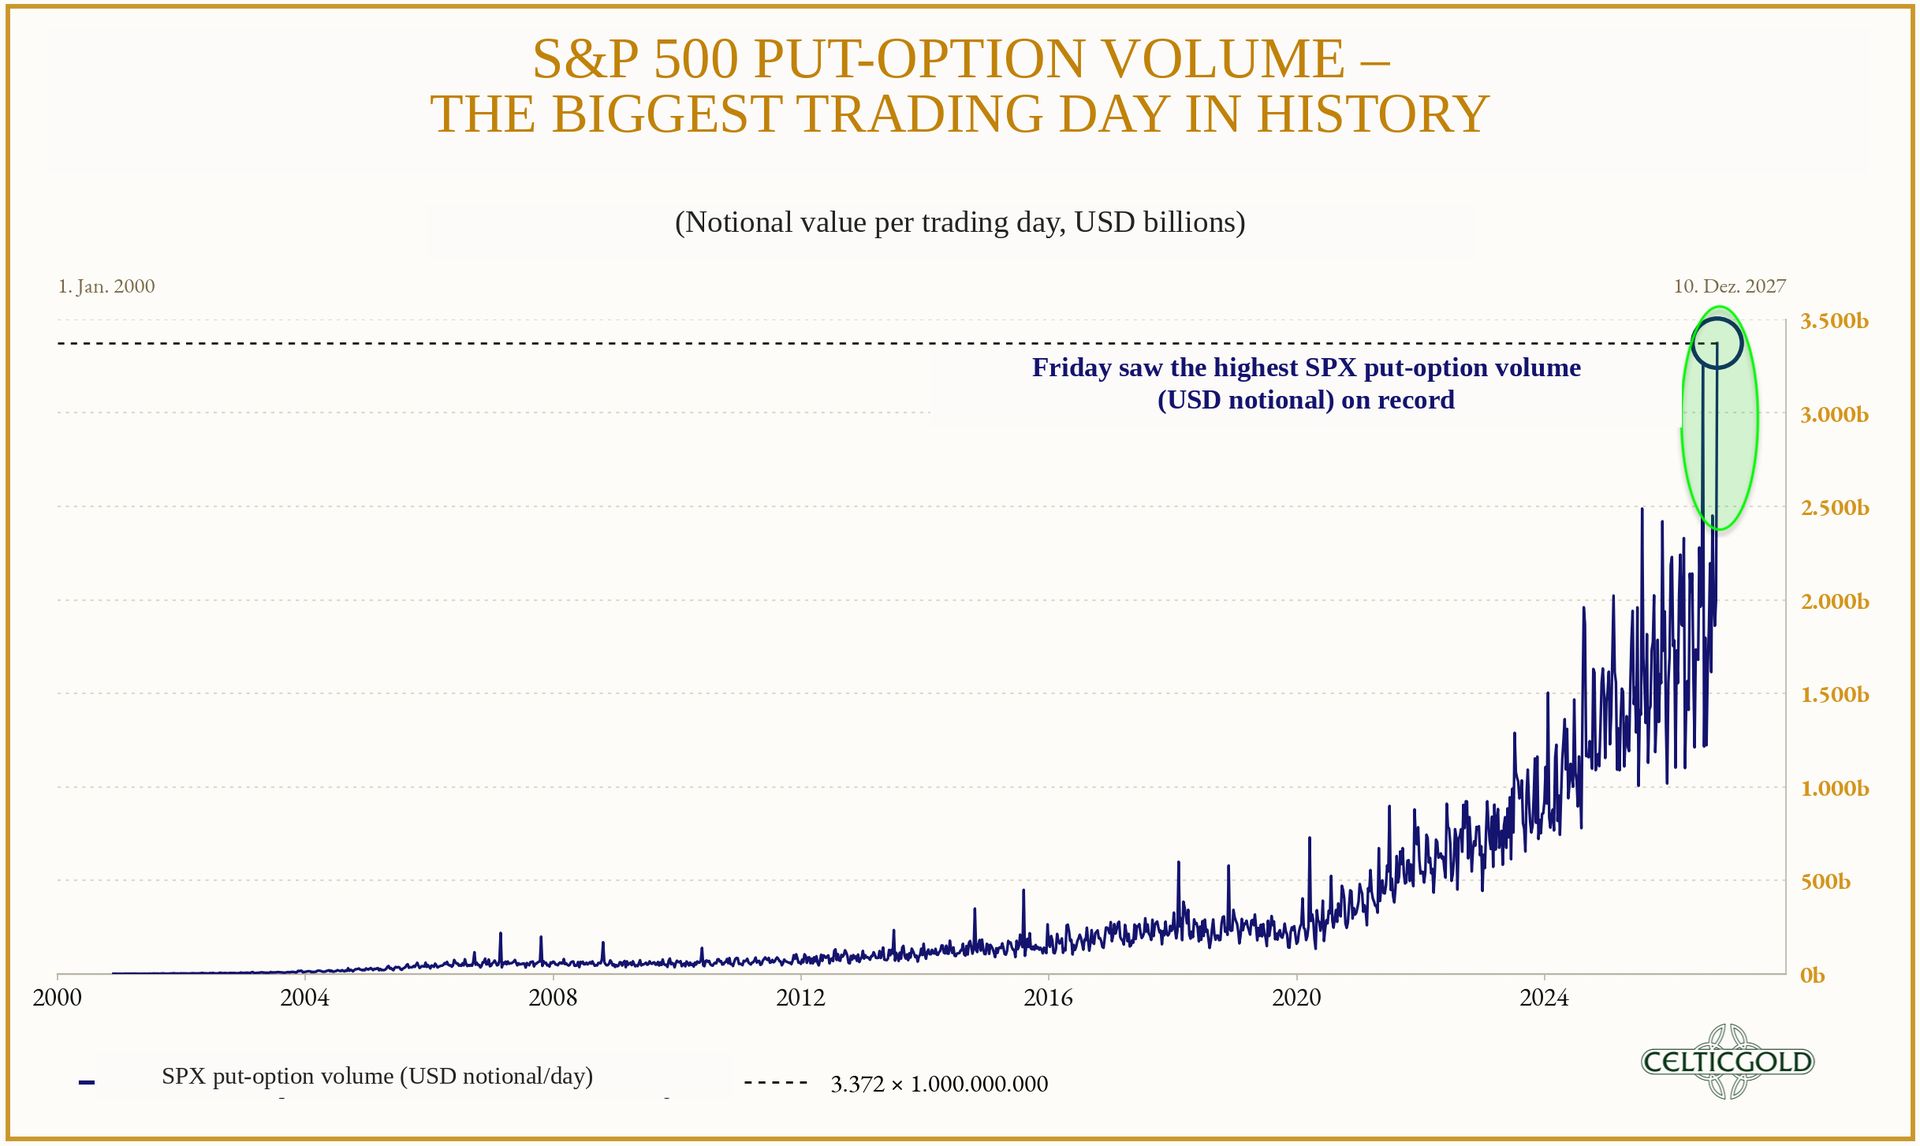
S&P 500 put-option trading volume as of 20 October 2026. Source: The Kobeissi Letter
For now, nervousness across international financial markets remains elevated, as the US derivatives market makes clear. On Friday 16 October, trading volume in S&P 500 put options reached a record USD 3.3 trillion—around 330% above the 2024 average. Before the Covid pandemic, typical daily volume ranged from only USD 100 billion to USD 500 billion. Right as the seasonally weak months of September and October draw to a close, investors' demand for downside protection has therefore surged.
5.5 History Points to a Post-Midterm Recovery
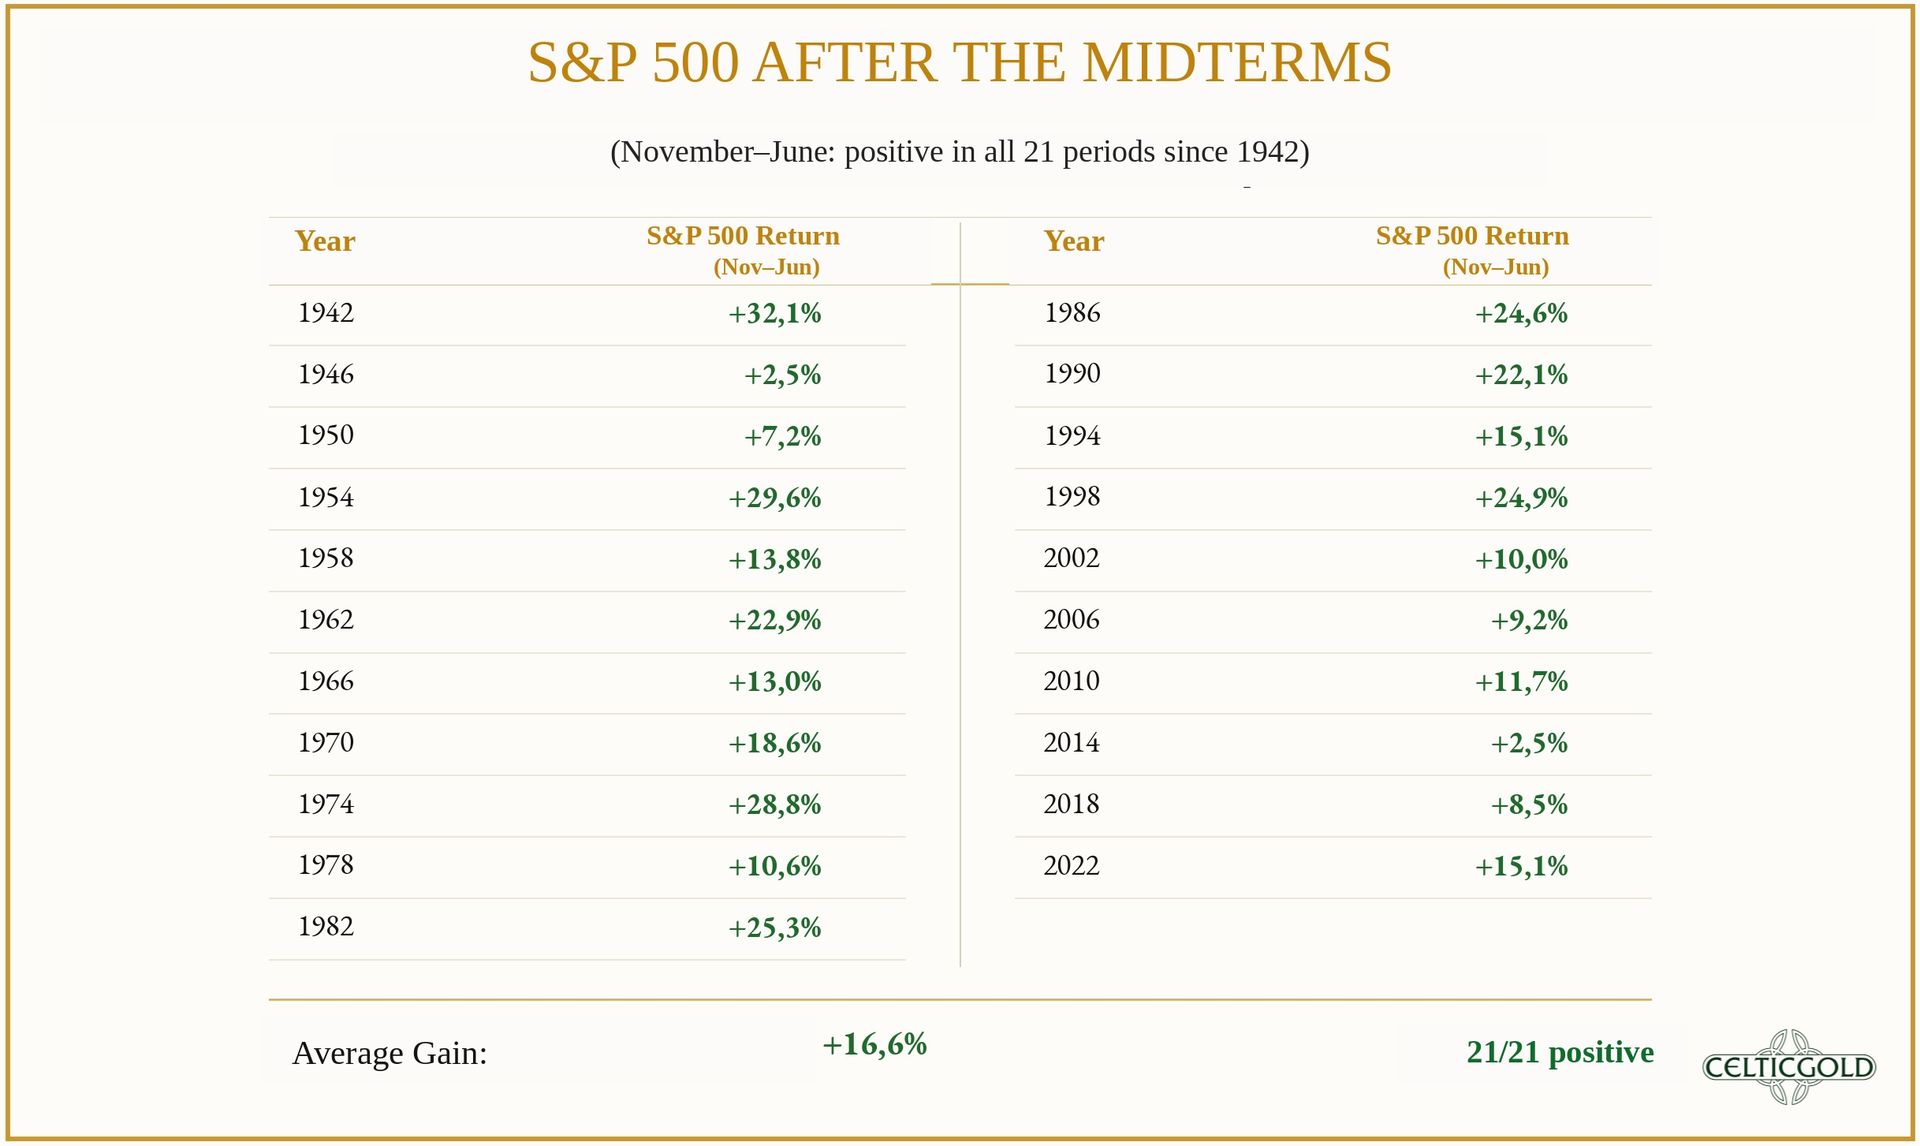
S&P 500 performance following US midterm elections, as of 25 October 2026. Source: Justin Banks
At the same time, history makes it clear that US midterm elections are generally followed by a strong phase for equities. Given the exceptionally high put-option volume, the now more favourable seasonal backdrop, deeply depressed sentiment, and ubiquitous warnings of an AI crash, we consider it very likely that the coming weeks—at least through year-end—will deliver a positive surprise. In the broader picture, we also would not be surprised if equity markets continued to climb the “AI wall of worry” well into 2027.
5.6 Oil Prices: The Key Inflation Driver
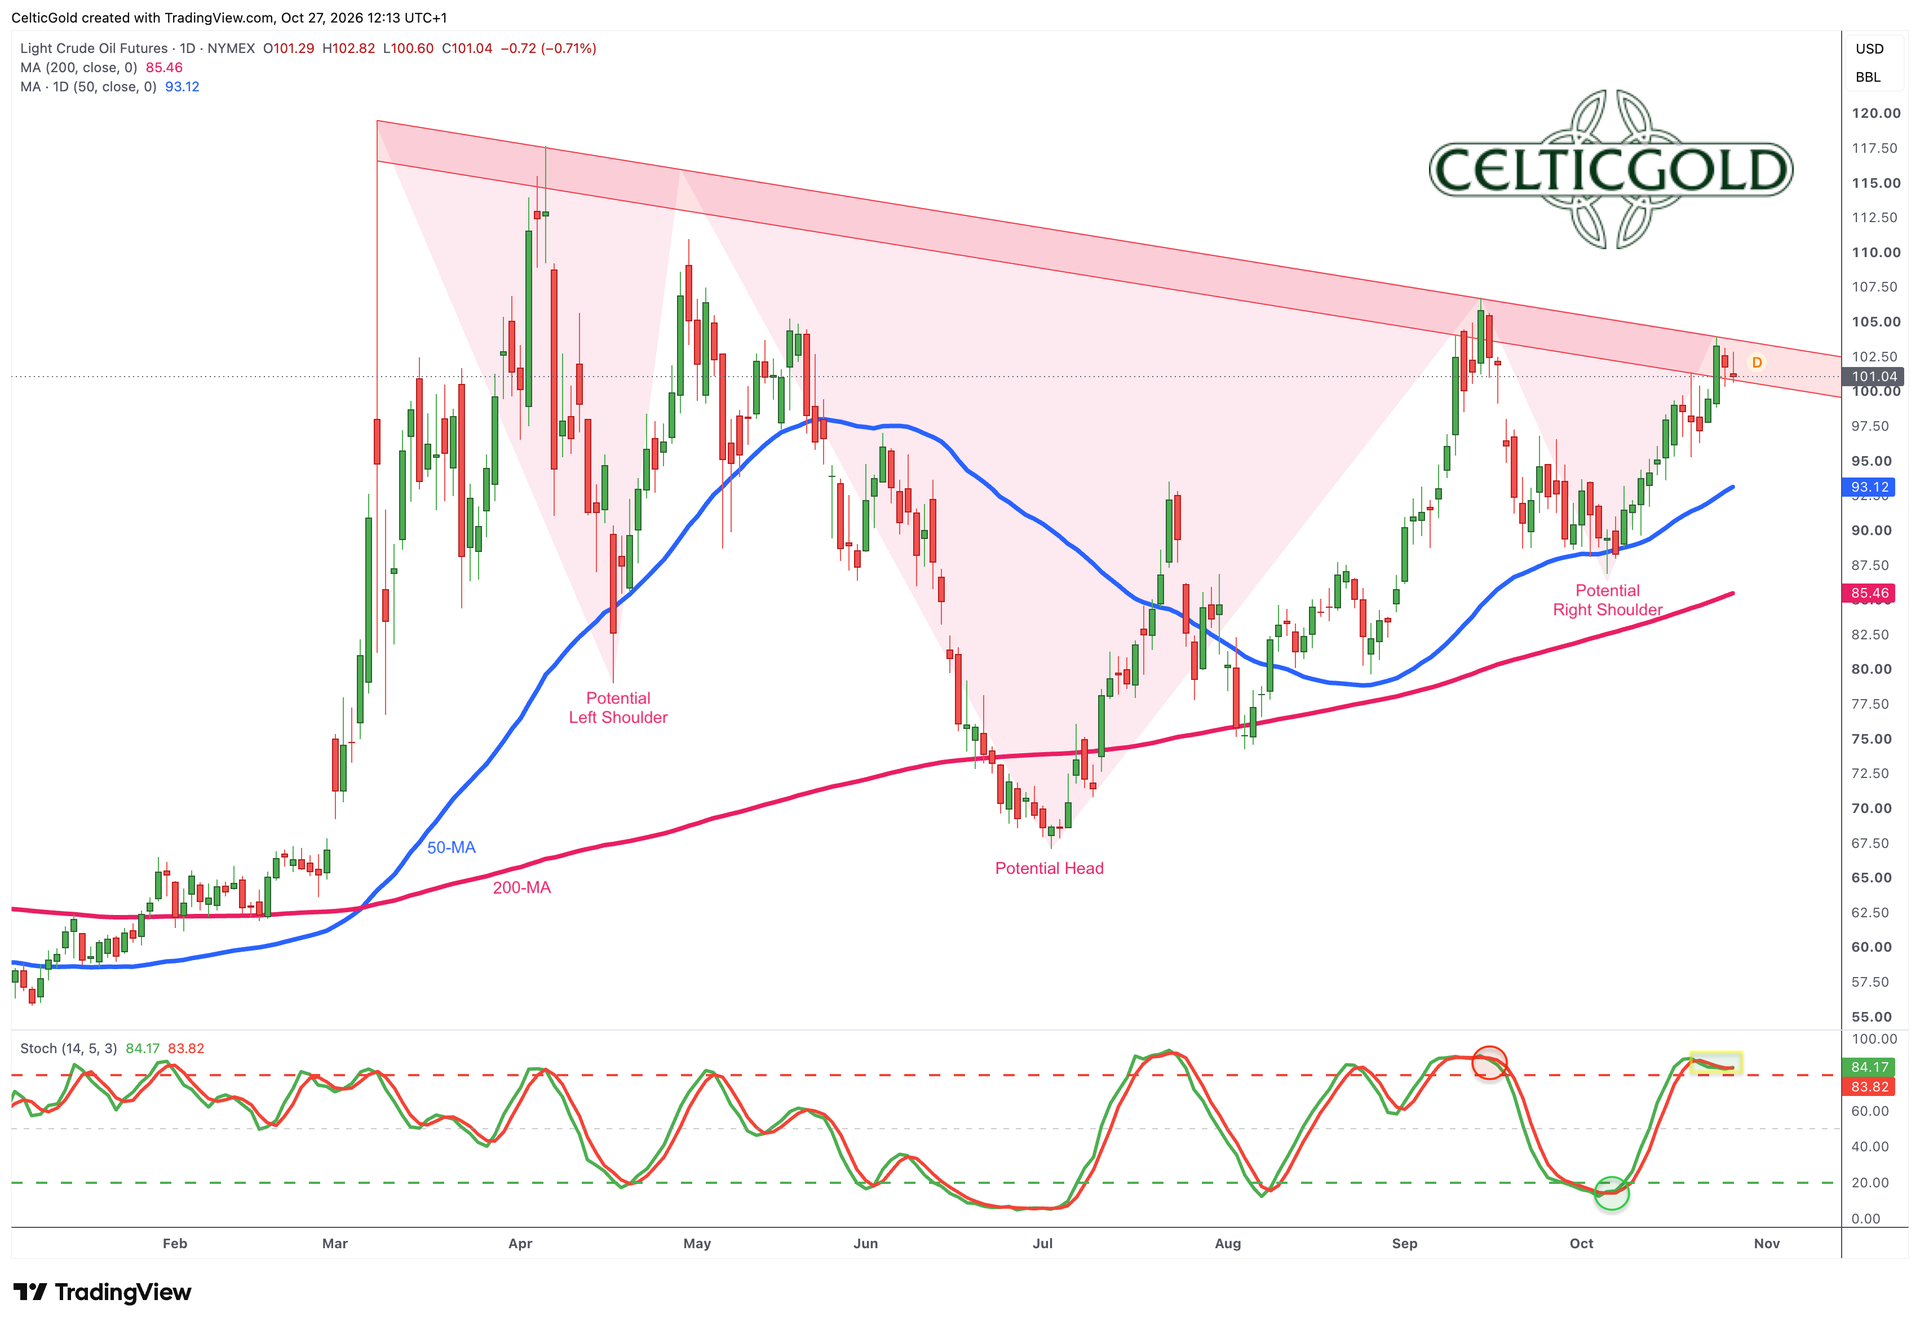
Crude oil in USD, daily chart as of 27 October 2026. Source: Tradingview
Oil prices, however, remain the greatest unresolved macroeconomic risk. Since the US-Israeli attack on Iran in late February, highly volatile oil prices have dominated the headlines and weighed noticeably on financial markets. This shock need not be short-lived: depending on how long supply uncertainty persists, it could become structural. The behaviour of longer-dated oil futures, such as WTI contracts for 2027, suggests the market is pricing not merely a temporary supply disruption but a persistently higher geopolitical risk premium. When long-term oil prices and energy costs rise sharply together, monetary policy comes under pressure—regardless of how weak economic activity may already be.
5.7 1973 as a Warning, Not a Blueprint
The oil crisis of 1973 offers a historical point of reference. Oil prices multiplied, and inflation climbed to 11.1% in the United States in 1974, 24.2% in the United Kingdom in 1975, and 23.2% in Japan in 1974. Today's price increase has so far been considerably more moderate. Nevertheless, derivatives, rising logistics costs, and higher security premia can amplify its effect on inflation, interest rates, and risk-asset pricing. Reports of attacks on Saudi facilities and possible military escalation in the Iran conflict have further heightened supply uncertainty in recent weeks. From a technical perspective, the oil chart also increasingly points to an upside breakout.
5.8 Tehran: A Test of Regional De-escalation

Four-party meeting involving Iran, Türkiye, Pakistan, and Saudi Arabia, 26 October 2026. Source: Mario Nawfal
Yet the geopolitical picture could also shift. On 26 October, a rare, high-level four-party meeting was held in Tehran between Iran and the three members of the Mecca Joint Defence Agreement—Saudi Arabia, Pakistan, and Türkiye. The explicit objective was de-escalation, after fresh Houthi attacks on Saudi Arabia and the prospect of renewed US-Israeli strikes against Iran had again brought the region to the brink of a wider war.
Saudi Arabia was represented by Defence Minister Prince Khalid bin Salman, Pakistan by Army Chief Field Marshal Asim Munir, and Türkiye by intelligence chief Ibrahim Kalın. On the Iranian side, participants included President Masoud Pezeshkian, Foreign Minister Abbas Araghchi, and Mohsen Rezaei, Secretary of the Supreme National Security Council. Discussions focused on regional security, the Iran–Israel conflict, Houthi attacks on Saudi Arabia, and developments in Palestine and Lebanon. Iran stressed that the countries of the region should take responsibility for security in West Asia and avoid outside interference; Saudi Arabia spoke of pathways toward de-escalation and regional stabilisation.
5.9 No Peace Deal, but Perhaps a Beginning
Although no concrete peace agreement emerged, the parties agreed to continue their dialogue and expand cooperation on regional peace and security. Precisely because this was the first direct contact at such a high level between Iran and the Mecca Pact states, the meeting could mark the beginning of a regional security architecture. At the very least, the immediate danger of escalation has diminished significantly. Lasting peace, however, would still require progress on the Palestinian question, a de-escalation of the Iran–Israel conflict, and credible security guarantees for the Gulf states.
5.10 De-escalation Would Support Stocks and Bonds
For financial markets, lasting de-escalation in the Middle East would be a distinctly positive signal. It would reduce the risk of disruptions to oil and gas supplies through the Strait of Hormuz and other key shipping routes, lower the security premium embedded in oil prices, and thereby ease inflationary pressure. This could give central banks more room to cut interest rates, support equity and bond valuations, and reduce general risk aversion. Cyclical stocks, emerging markets, energy-intensive businesses, and asset classes that have suffered from the combination of war risk, oil shock, and restrictive monetary policy would stand to benefit in particular.
5.11 Bitcoin Benefits From Improved Liquidity

De-escalation would also tend to be very positive for Bitcoin. As a liquid, globally traded asset not tied to any single country, Bitcoin is highly sensitive to changes in liquidity, real interest rates, and overall risk aversion. Falling oil prices and easing inflationary pressure could increase expectations of future rate cuts and improve financing conditions for risk assets—in other words, a shift toward easier monetary policy. Reduced war risk would also indirectly mean fewer forced deleveraging sales and, consequently, more stable risk assets.
5.12 Liquidity Matters in the Short Term; Scarcity in the Long Term
Overall, the current market phase should be viewed as a stress test. Hedge funds have substantially reduced their leverage in AI and technology stocks, put-option volumes have surged, oil prices are driving inflation expectations higher, and the Fed must navigate the conflicting demands of debt burdens, inflation, and financial stability. In such an environment, the financial system first sells what is easiest to liquidate—even Bitcoin and gold. Yet sentiment has deteriorated to such an extent that even a relatively small positive surprise could trigger a powerful equity-market rebound and drive Bitcoin as well as precious metals sharply higher.
6. Conclusion: Bitcoin – Bitcoin – Final Test Before the Next Leg Higher
Bitcoin has been in an uptrend since its July low. It is now testing the psychologically important area around USD 80,000. This is where the cost bases of major institutional buyers, the emotional dividing line between recovery and “crypto winter,” and expectations for a continuation of the young uptrend converge. As long as this area is defended, the broader picture remains constructive. Even a temporary retreat toward the rising 200-day moving average around USD 73,000–75,000 would not constitute a trend break. Instead, it could shake out the remaining weak hands, reduce leverage, and lay the groundwork for the next impulsive advance.
From a macroeconomic perspective, however, the situation remains mixed. AI deleveraging, record put-option hedging, rising oil prices, and elevated real yields explain why even Bitcoin and gold have come under short-term selling pressure. In periods of stress, the most liquid assets are often sold first. At the same time, conditions for a positive surprise are unusually favourable. Sentiment is depressed, seasonality becomes markedly more supportive from November, the historical post-midterm pattern points to a stronger phase for equities, and any geopolitical easing in the Middle East would reduce oil prices, inflation expectations, and pressure on monetary policy. For Bitcoin, this would be the most important catalyst—not because of any single headline, but because greater liquidity and falling real yields would structurally improve financing conditions for risk assets.
In the long run, this correction does nothing to undermine the central thesis: Bitcoin is a scarce, non-sovereign store of value in a system characterised by rising government debt and recurring state intervention. Nevertheless, gold and Bitcoin will not always move in tandem. Gold remains the traditional safeguard for wealth and crises; Bitcoin is its more dynamic, liquid, and riskier counterpart, with significantly greater upside potential. Those looking to position strategically for the next phase should focus less on daily volatility and more on the levels that truly matter. A pullback toward USD 75,000 over the coming days and weeks would present a buying opportunity.
This “ Bitcoin – Final Test Before the Next Leg Higher” analysis was sponsored and initially published exclusively for CelticGold on 27 October 2026, by www.celticgold.de. Translated into English on 28 October 2026.
Join us in our free Telegram channel for daily charts, real-time data and a great community. If you like to get regular updates on precious metals, commodities, and bitcoin, subscribe to our free newsletter.
Disclosure:
This article and the content are for informational purposes only and do not contain investment advice or recommendations. Every investment and trading move involves risk, and readers should conduct their own research when making a decision. The views, thoughts, and opinions expressed here are the author's alone. They do not necessarily reflect or represent the views and opinions of Midas Touch Consulting.
About the Author: Florian Grummes
Florian Grummes is an independent financial analyst, advisor, consultant, mentor, trader & investor as well as an international speaker with more than 30 years of experience in financial markets.
Florian is the founder and managing director of his company Midas Touch Consulting, which is specialized in trading & investments as well as consulting, analysis & research with a focus on precious metals, commodities and digital assets.
Via Midas Touch Consulting he is publishing daily and weekly gold, silver, bitcoin & cryptocurrency analysis for his numerous international readers. Florian is well known for combining technical, fundamental/macro and sentiment analysis into one often accurate conclusion about the markets.