
1. Review
Since the beginning of June, Bitcoin traded until mid-August within a relatively narrow sideways range between USD 57,750 and USD 66,900. From the yearly low on 1 July at USD 57,735, a decent three-week recovery temporarily followed. Bottom line, however, the price remained trapped roughly 50 percent below the all-time high of USD 126,272 during this grinding sideways phase. In hindsight, it is now clear that Bitcoin not only stabilised during this period but also completed an important bottoming process.
On 14 August, Bitcoin marked a slightly higher interim low at USD 62,470. Immediately afterward, prices shot up steeply and reached USD 79,461 within a single week. The trigger for this rapid move was primarily the surprise announcement by US Treasury Secretary Scott Bessent to double Treasury buyback operations to at least USD 4 billion per operation. This measure not only fueled Bitcoin prices but also drove precious metals prices higher.
Over the past two weeks, Bitcoin has continued to push higher, reaching USD 82,281. This represents a recovery of +42.5% from the early-July low. Overall, this impulsive advance is fuelling hopes that the crypto winter has come to an end.
2. Technical Analysis for Bitcoin in US-Dollar
2.1 Weekly Chart: A Mild Crypto Winter Within the Long-Term Uptrend Channel
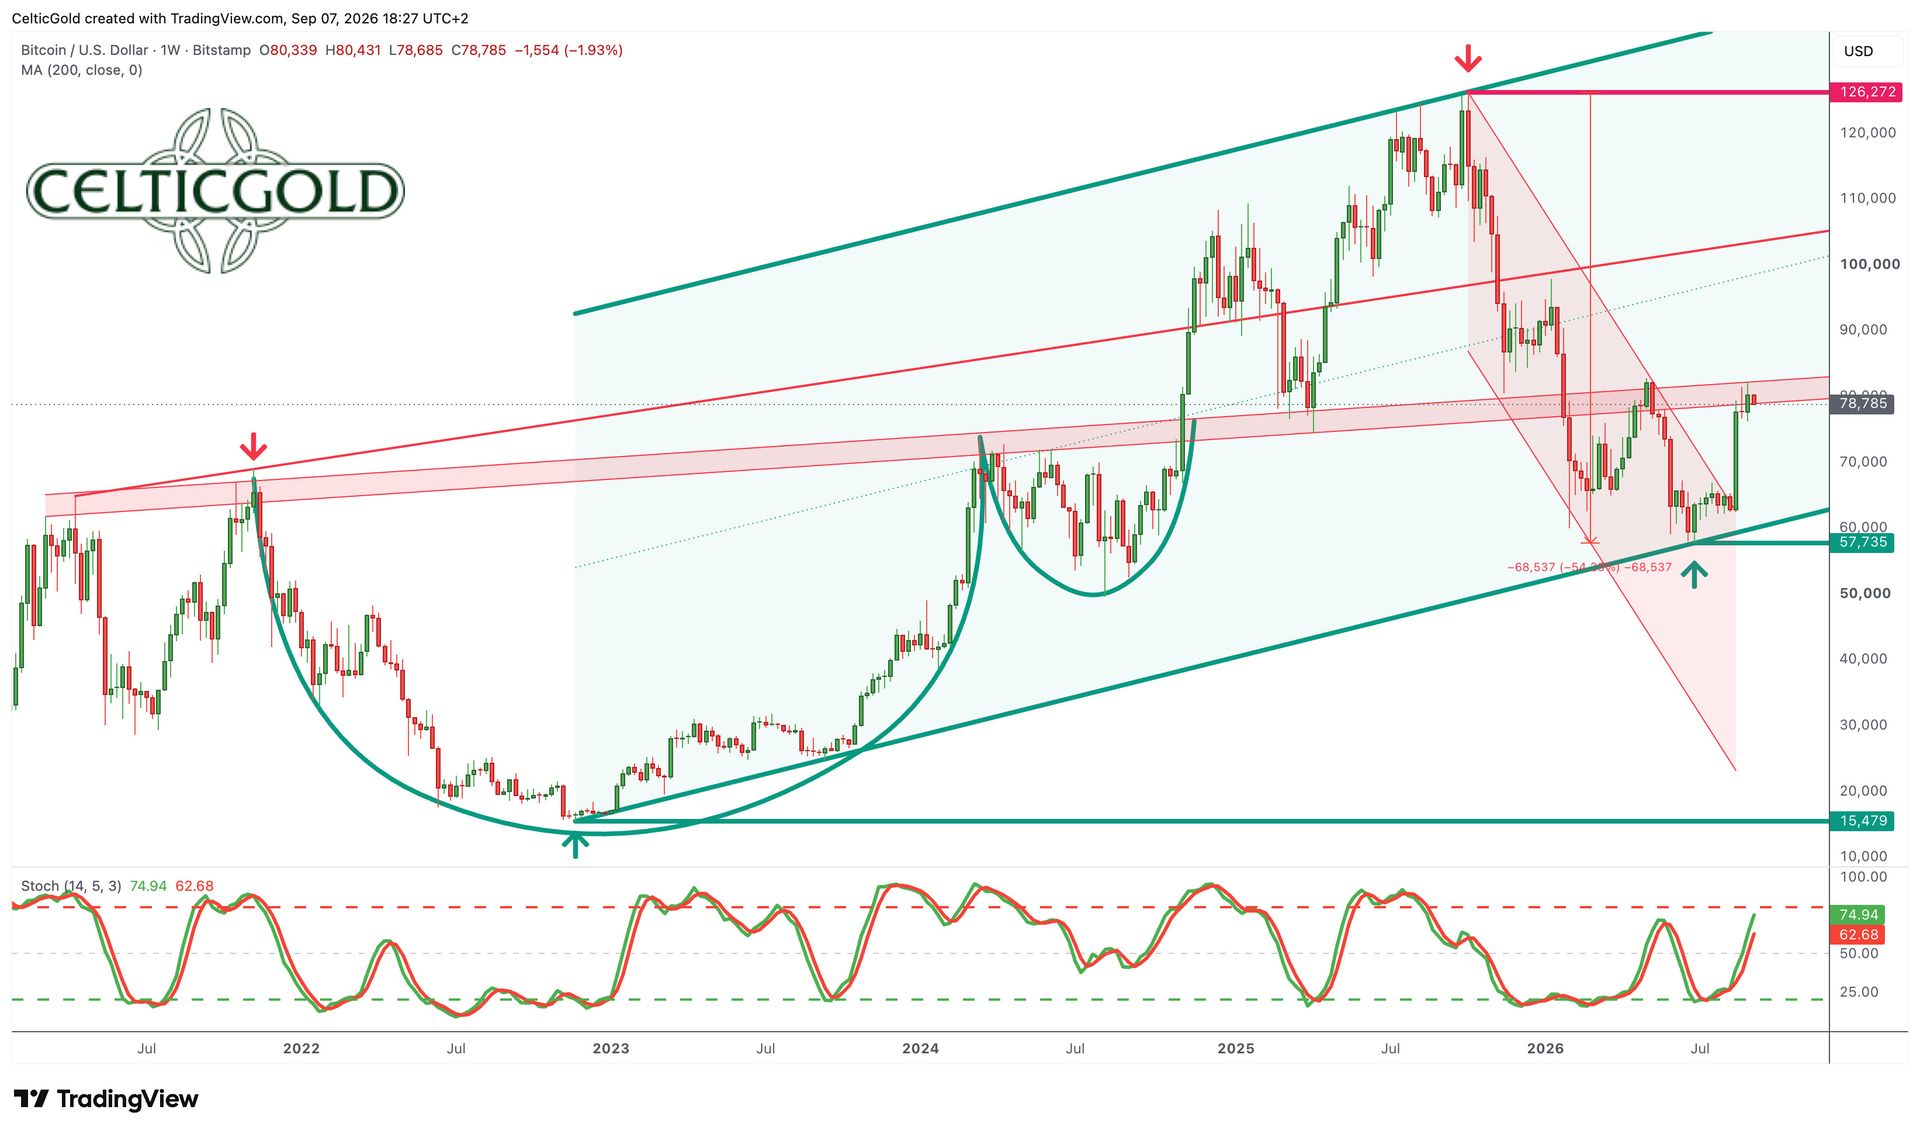
Bitcoin in USD, weekly chart as of 7 September 2026. Source: Tradingview
Since the all-time high of USD 126,272 on 6 October 2025, Bitcoin corrected over nine months down to a low of USD 57,735 on 1July 2026 — a decline of roughly 54%, which makes this crypto winter appear comparatively mild by historical standards, even though pain and capitulation sentiment among investors were once again extremely high.
Technically notable is that on the weekly chart, Bitcoin has so far successfully defended the uptrend channel running since November 2022. The low at USD 57,735 marked a successful test of the lower channel boundary, meaning the broader long-term uptrend remains intact and would only be seriously jeopardised by a sustained break below the USD 60,000 mark.
At the same time, the weekly chart also shows that the impulsive rally of recent weeks has now arrived exactly at the very strong resistance zone between USD 79,000 and USD 82,000. A clear, convincing breakout would immediately open the path toward USD 100,000, whereas at such massive resistance zones a pullback is generally the more likely outcome.
Overall, the weekly chart is now bullish. The weekly stochastic has generated a new buy signal, and the increasingly constructive overall picture would only be meaningfully damaged again if prices were to fall clearly back below the important support zone around USD 70,000. Below USD 60,000, the broader uptrend would be over.
2.2 Daily Chart: Explosive Breakout
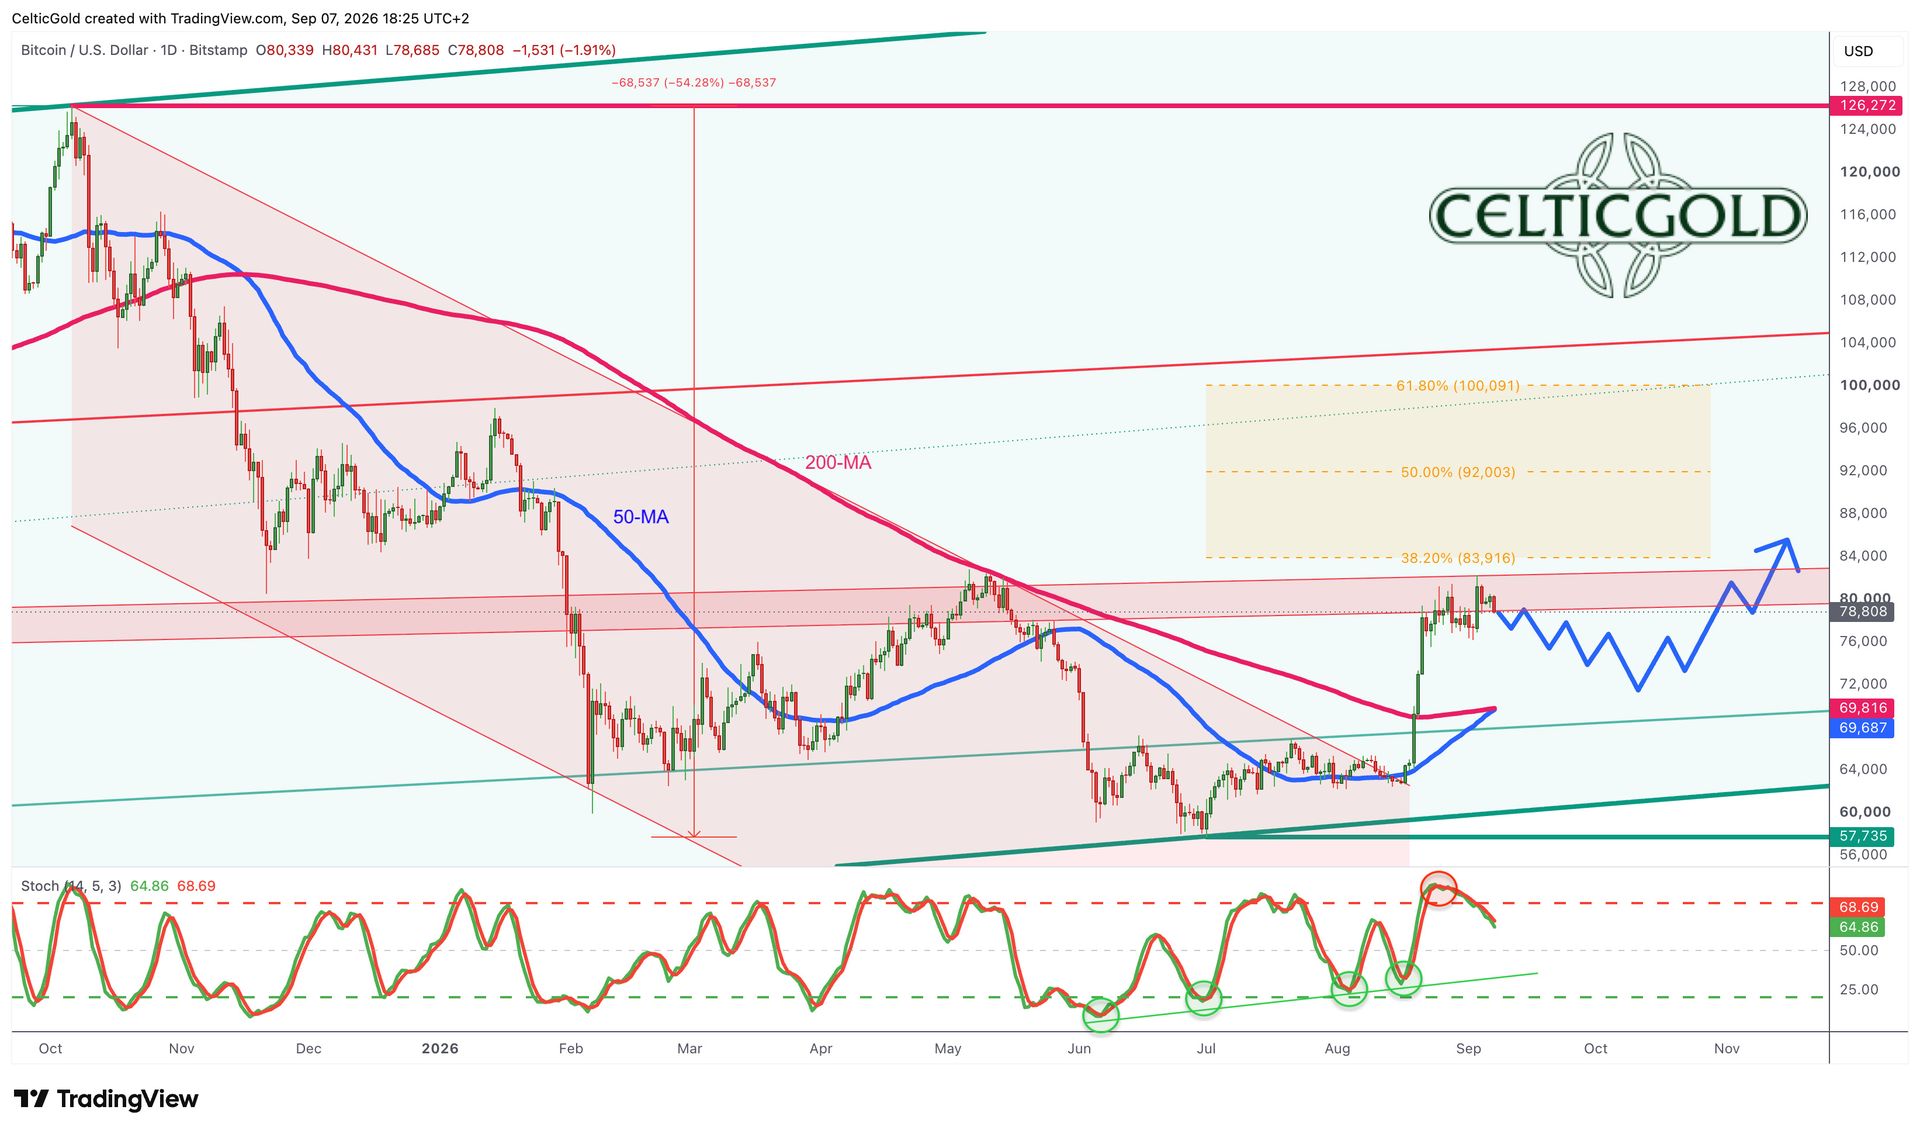
Bitcoin in USD, daily chart as of 7 September 2026. Source: Tradingview
On the daily chart, Bitcoin broke out of its nine-month downtrend channel on 17 August with a bang, following an eight-week bottoming phase! Prices then immediately surged steeply and impulsively to USD 82,281. With that, the newly awakened bulls are now targeting the resistance zone between USD 79,000 and USD 82,000, fed by the highs of April 2021, November 2021, and March 2024.
While the daily stochastic has already turned downward, the price action itself does not yet look as though the bulls are satisfied with a +42.5% recovery. The liberating breakout above this massive resistance zone remains very much within reach.
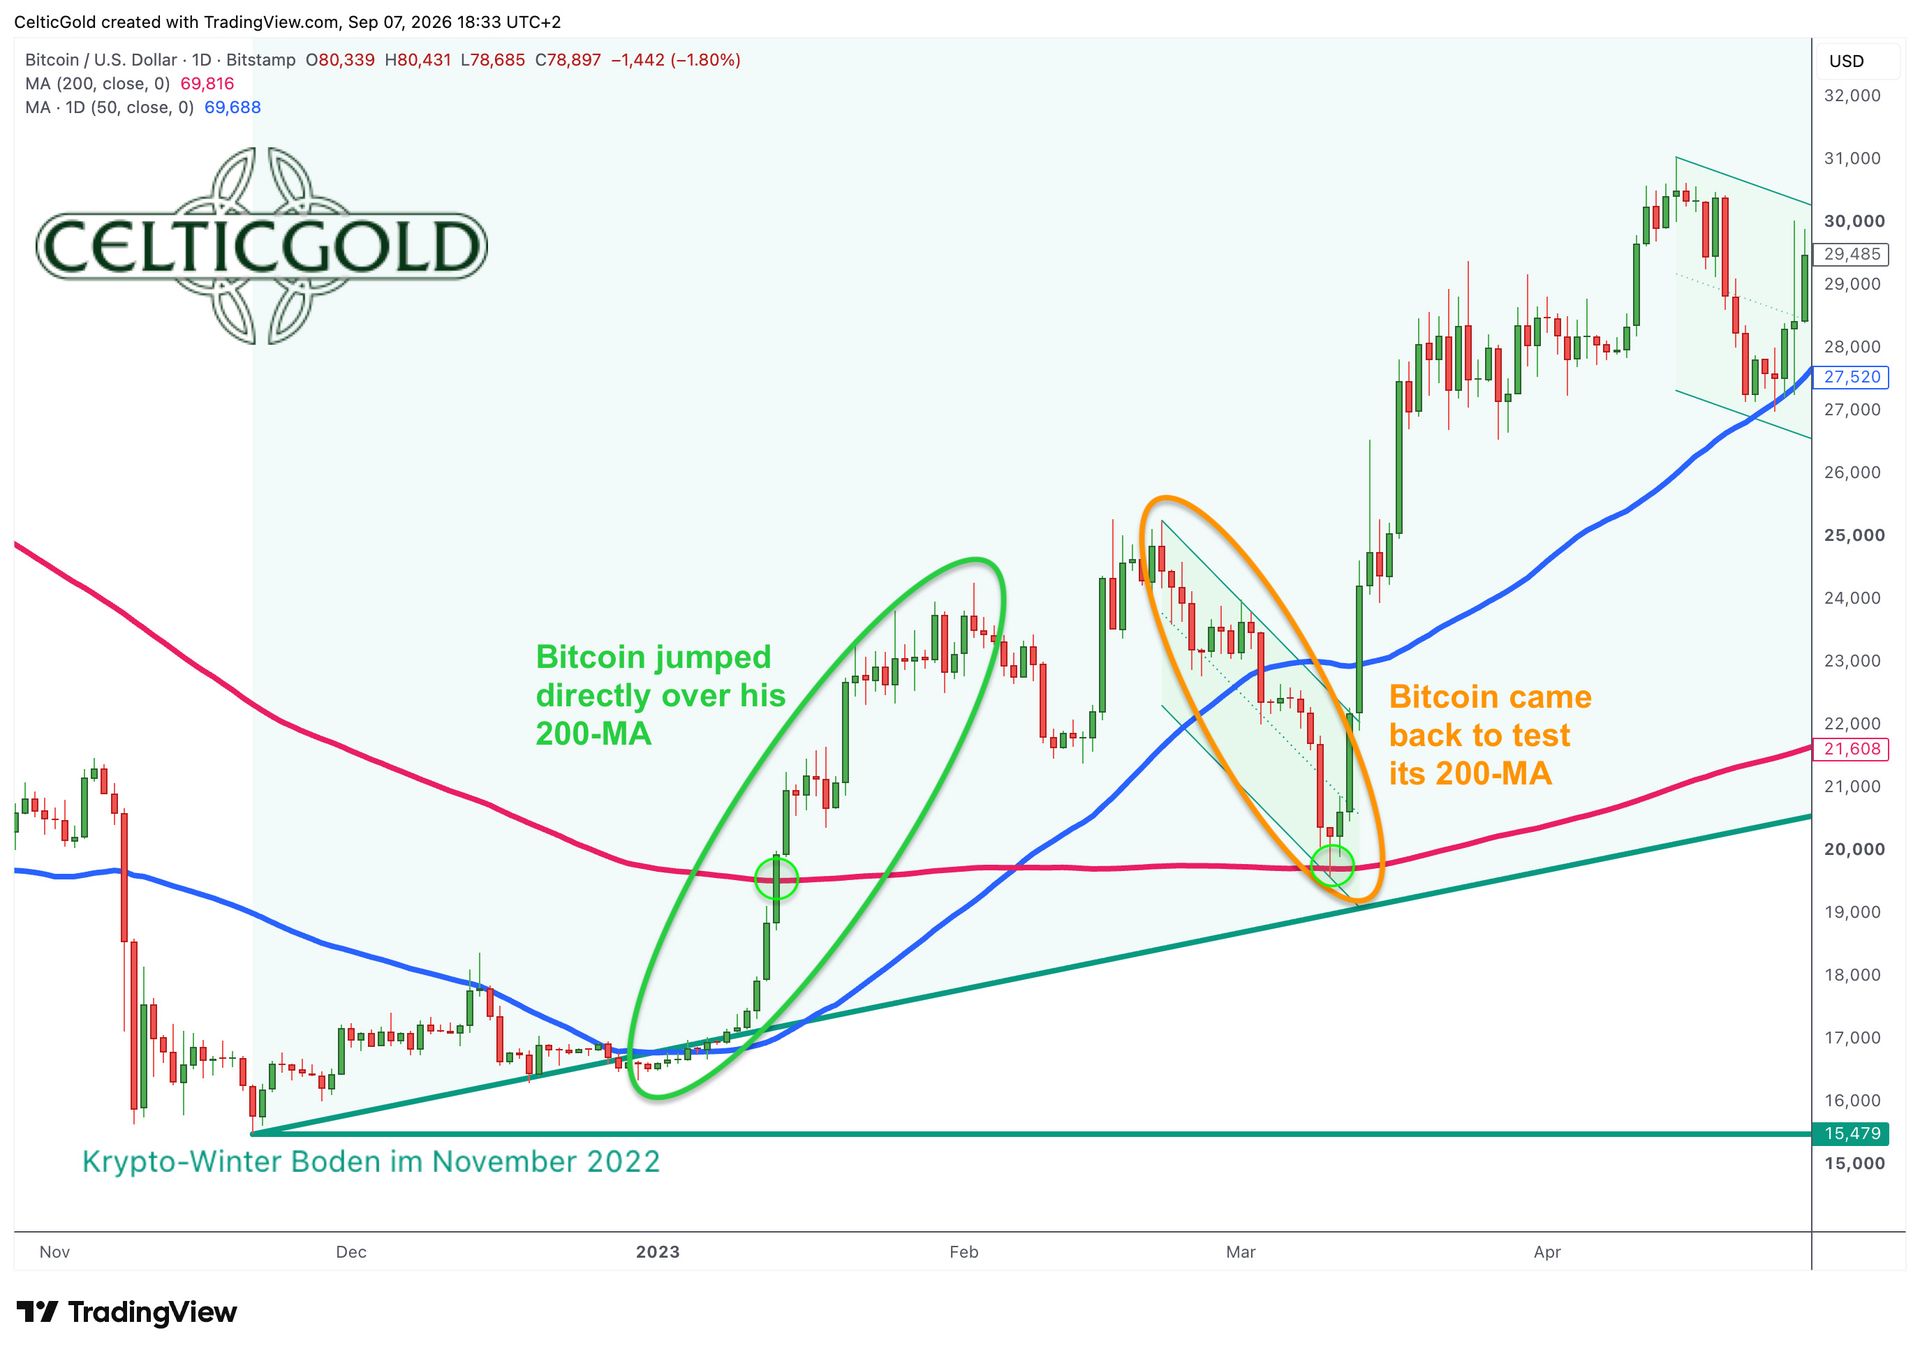
Bitcoin, spring 2023, daily chart as of 7 September 2026. Source: Tradingview
Experience teaches, however, that such impulsive breakouts often correct back once more toward the 200-day moving average (currently USD 69,819). Moreover, past crypto winters have also seen a nasty final capitulation phase right at the very end — a scenario that cannot be entirely ruled out given the approaching US midterm elections.
Overall, the daily chart remains bullish despite the weakening daily stochastic. Should the bulls sustainably overcome the resistance zone between USD 79,000 and USD 82,000, the crypto winter will definitively be over and the USD 100,000 mark will move directly into focus. If, on the other hand, Bitcoin does need a breather, a pullback toward the 200-day line over the coming one to two months would offer a very attractive entry opportunity.
3. Bitcoin Sentiment – Optimism Is Back
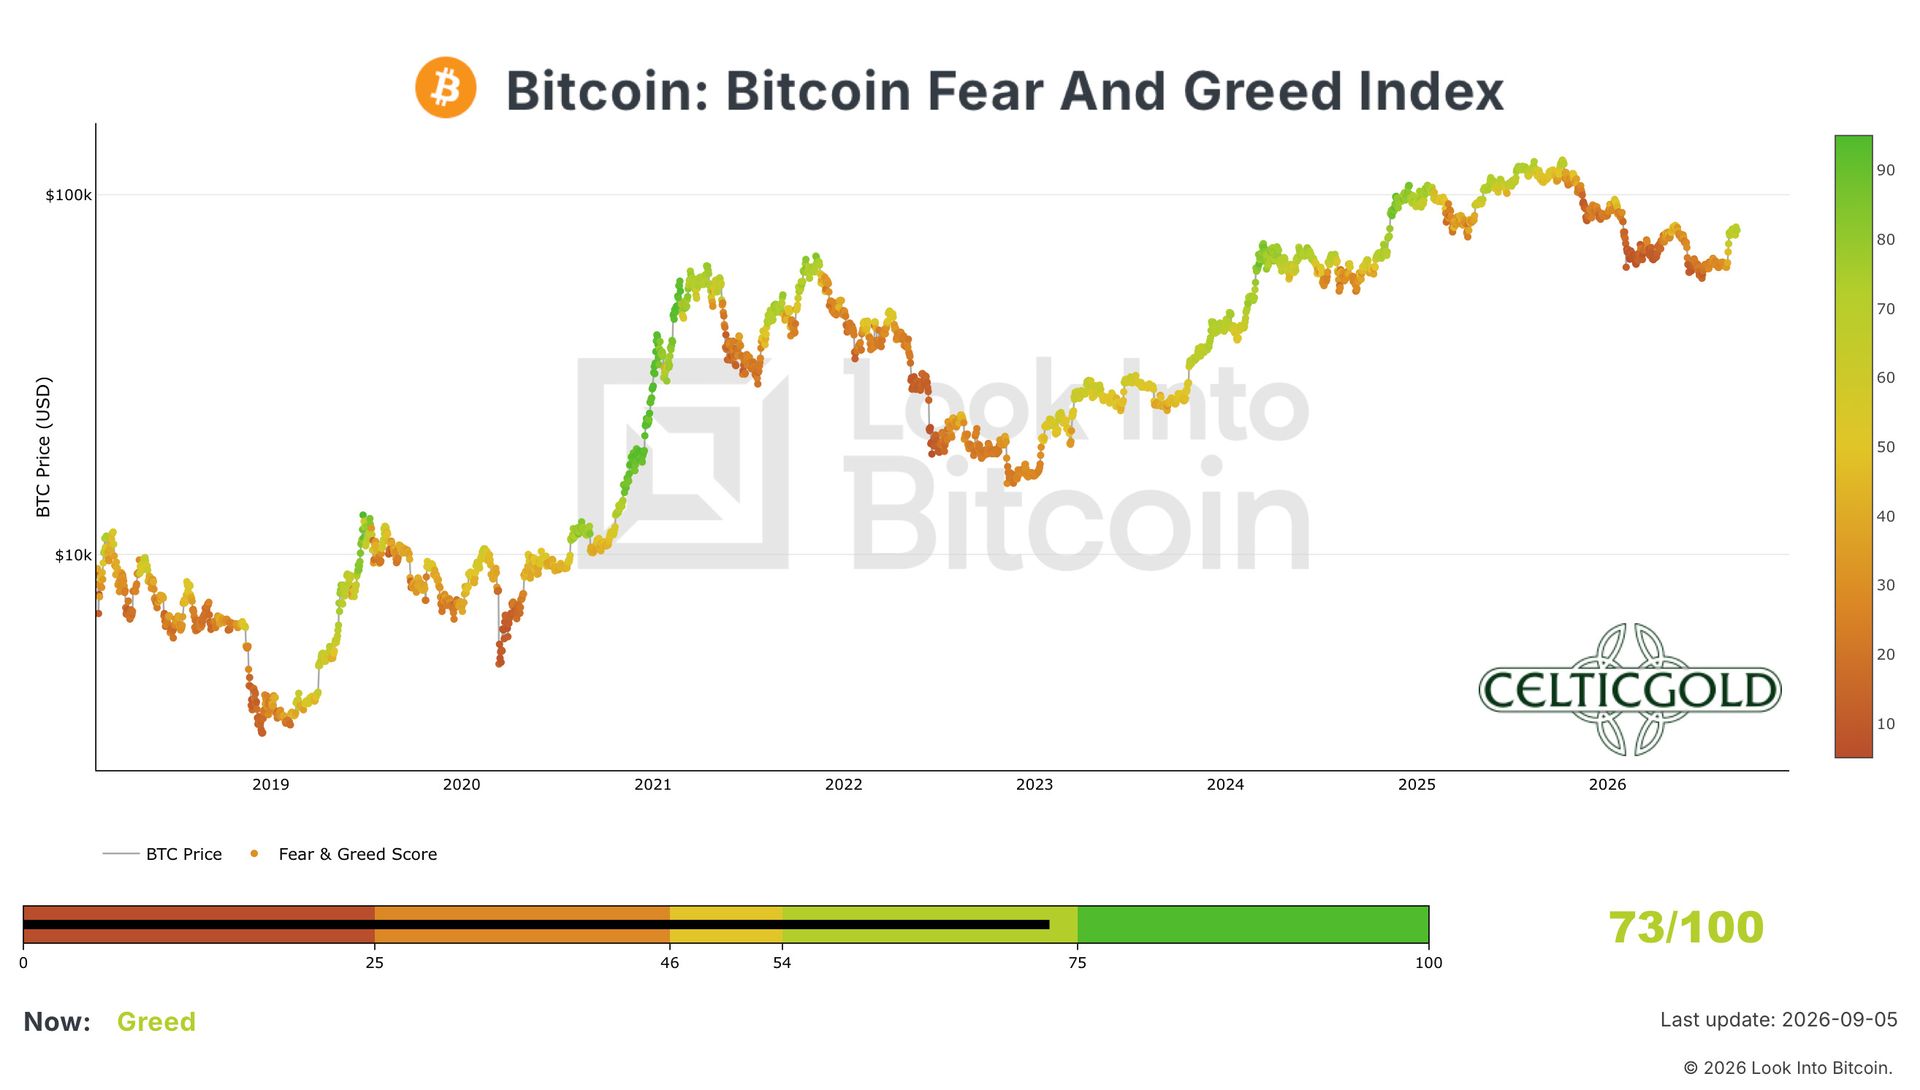
Crypto Fear & Greed Index as of 6 September 2026. Source: Bitcoin Magazine Pro.
The Crypto Fear & Greed Index currently stands at 73 out of 100 points, placing it clearly in the upper third of the sentiment scale. After the contrarian buy signals in June and July, the picture has now completely reversed, and sentiment appears somewhat too euphoric.
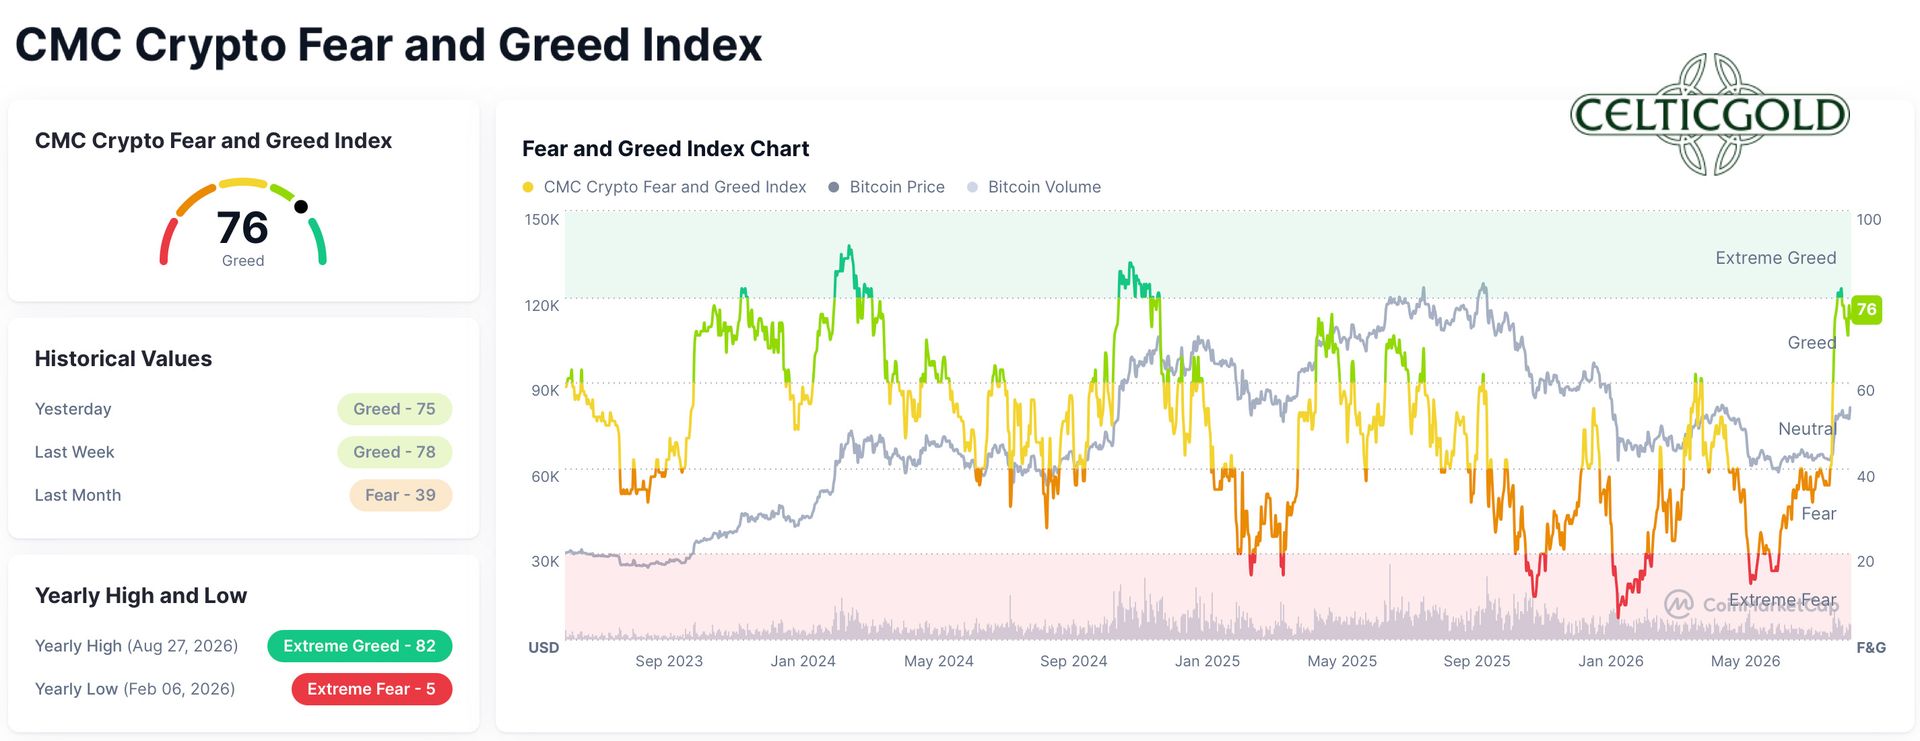
CMC Crypto Fear & Greed Index as of 6 September 2026. Source: Coinmarketcap
The CoinMarketCap “CMC Crypto Fear & Greed Index,” which reflects the broader crypto market (including the top 10 coins and stablecoin dynamics), currently stands at 76 out of 100. With an impulsive jump, the index moved directly into the “extreme greed” zone. The underlying indicators — market volatility, momentum, social media activity, surveys, and Bitcoin trends — thus signal a dramatic shift in sentiment within a very short period.
Given the partly euphoric sentiment already back in place, sentiment analysis currently issues a warning signal and increases the probability of a short-term failure at the resistance zone around USD 80,000.
4. Bitcoin Seasonality – Neutral Until Early/Mid-October
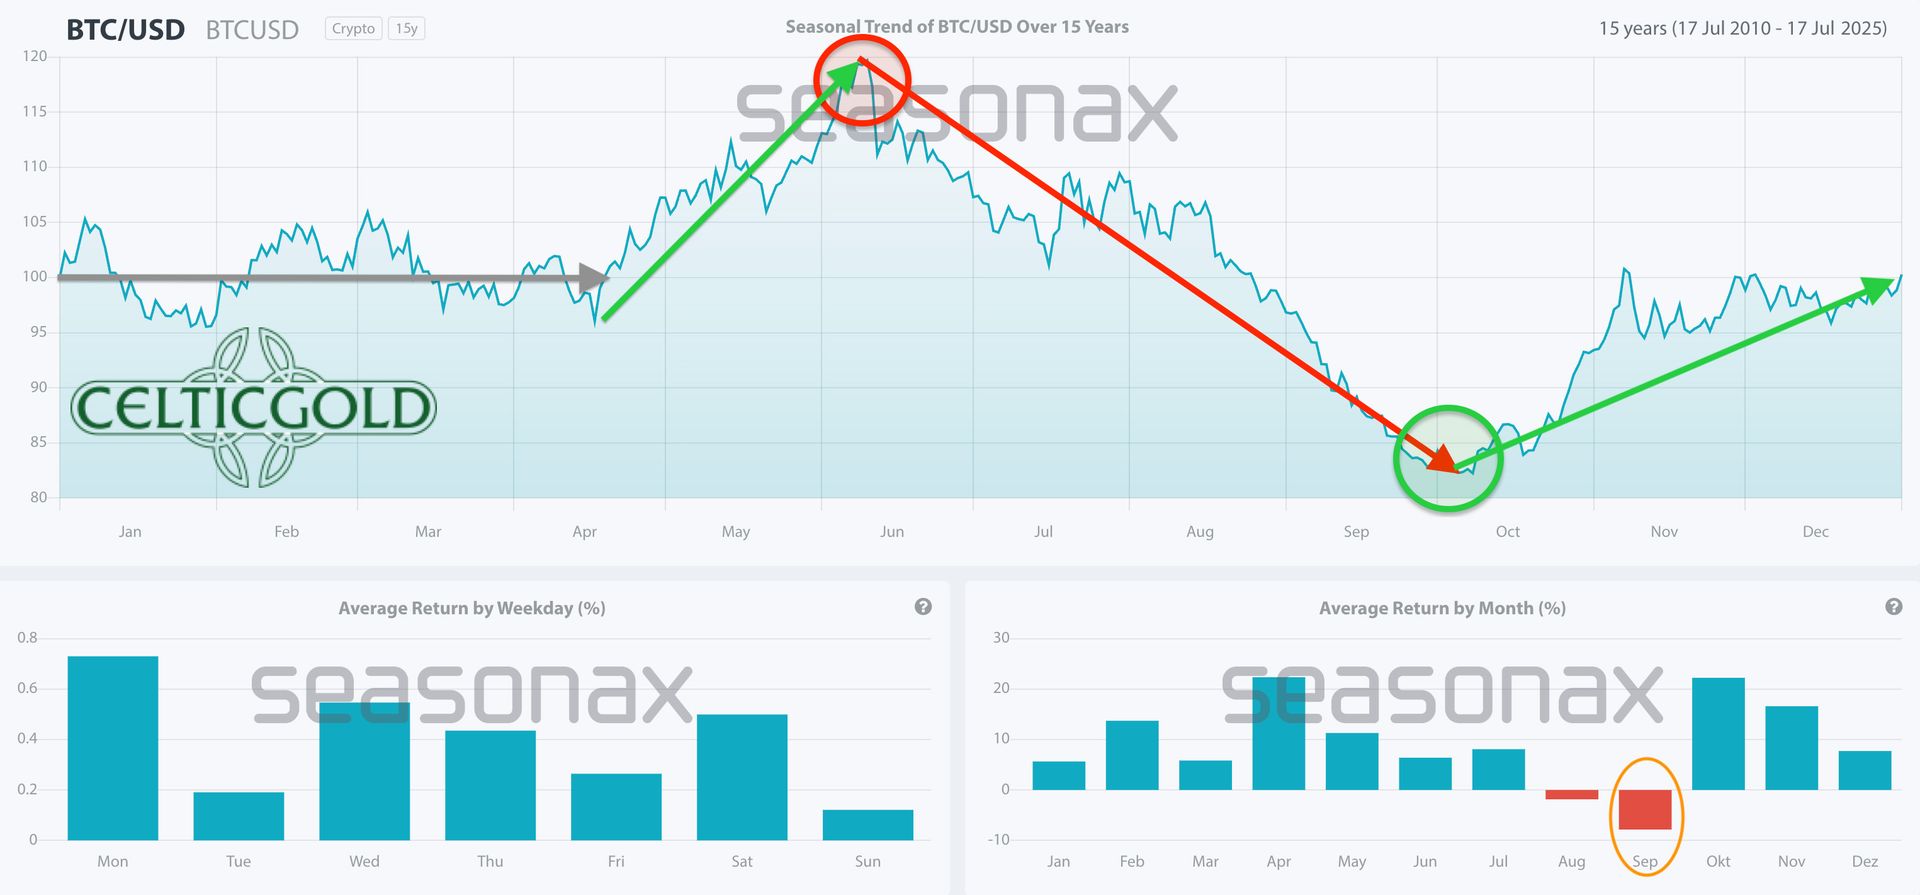
Bitcoin seasonality as of 6 September 2026. Source: Seasonax
Statistically, the period between mid-September and mid-October frequently coincides with a significant low followed by a trend reversal to the upside. This year, however, this pattern appears to have shifted in time: the early-summer high was already reached in early May (instead of mid-June), while the low in early July already marked an important turning point.
Either a phase of weakness still follows in September/October, or this year's cycle is running ahead of schedule — in which case the coming months could belong to the bulls.
In summary, the seasonal component remains neutral for the coming weeks. From mid-October onward, however, the light turns green.
5. Bitcoin vs. Gold (Bitcoin/Gold Ratio)
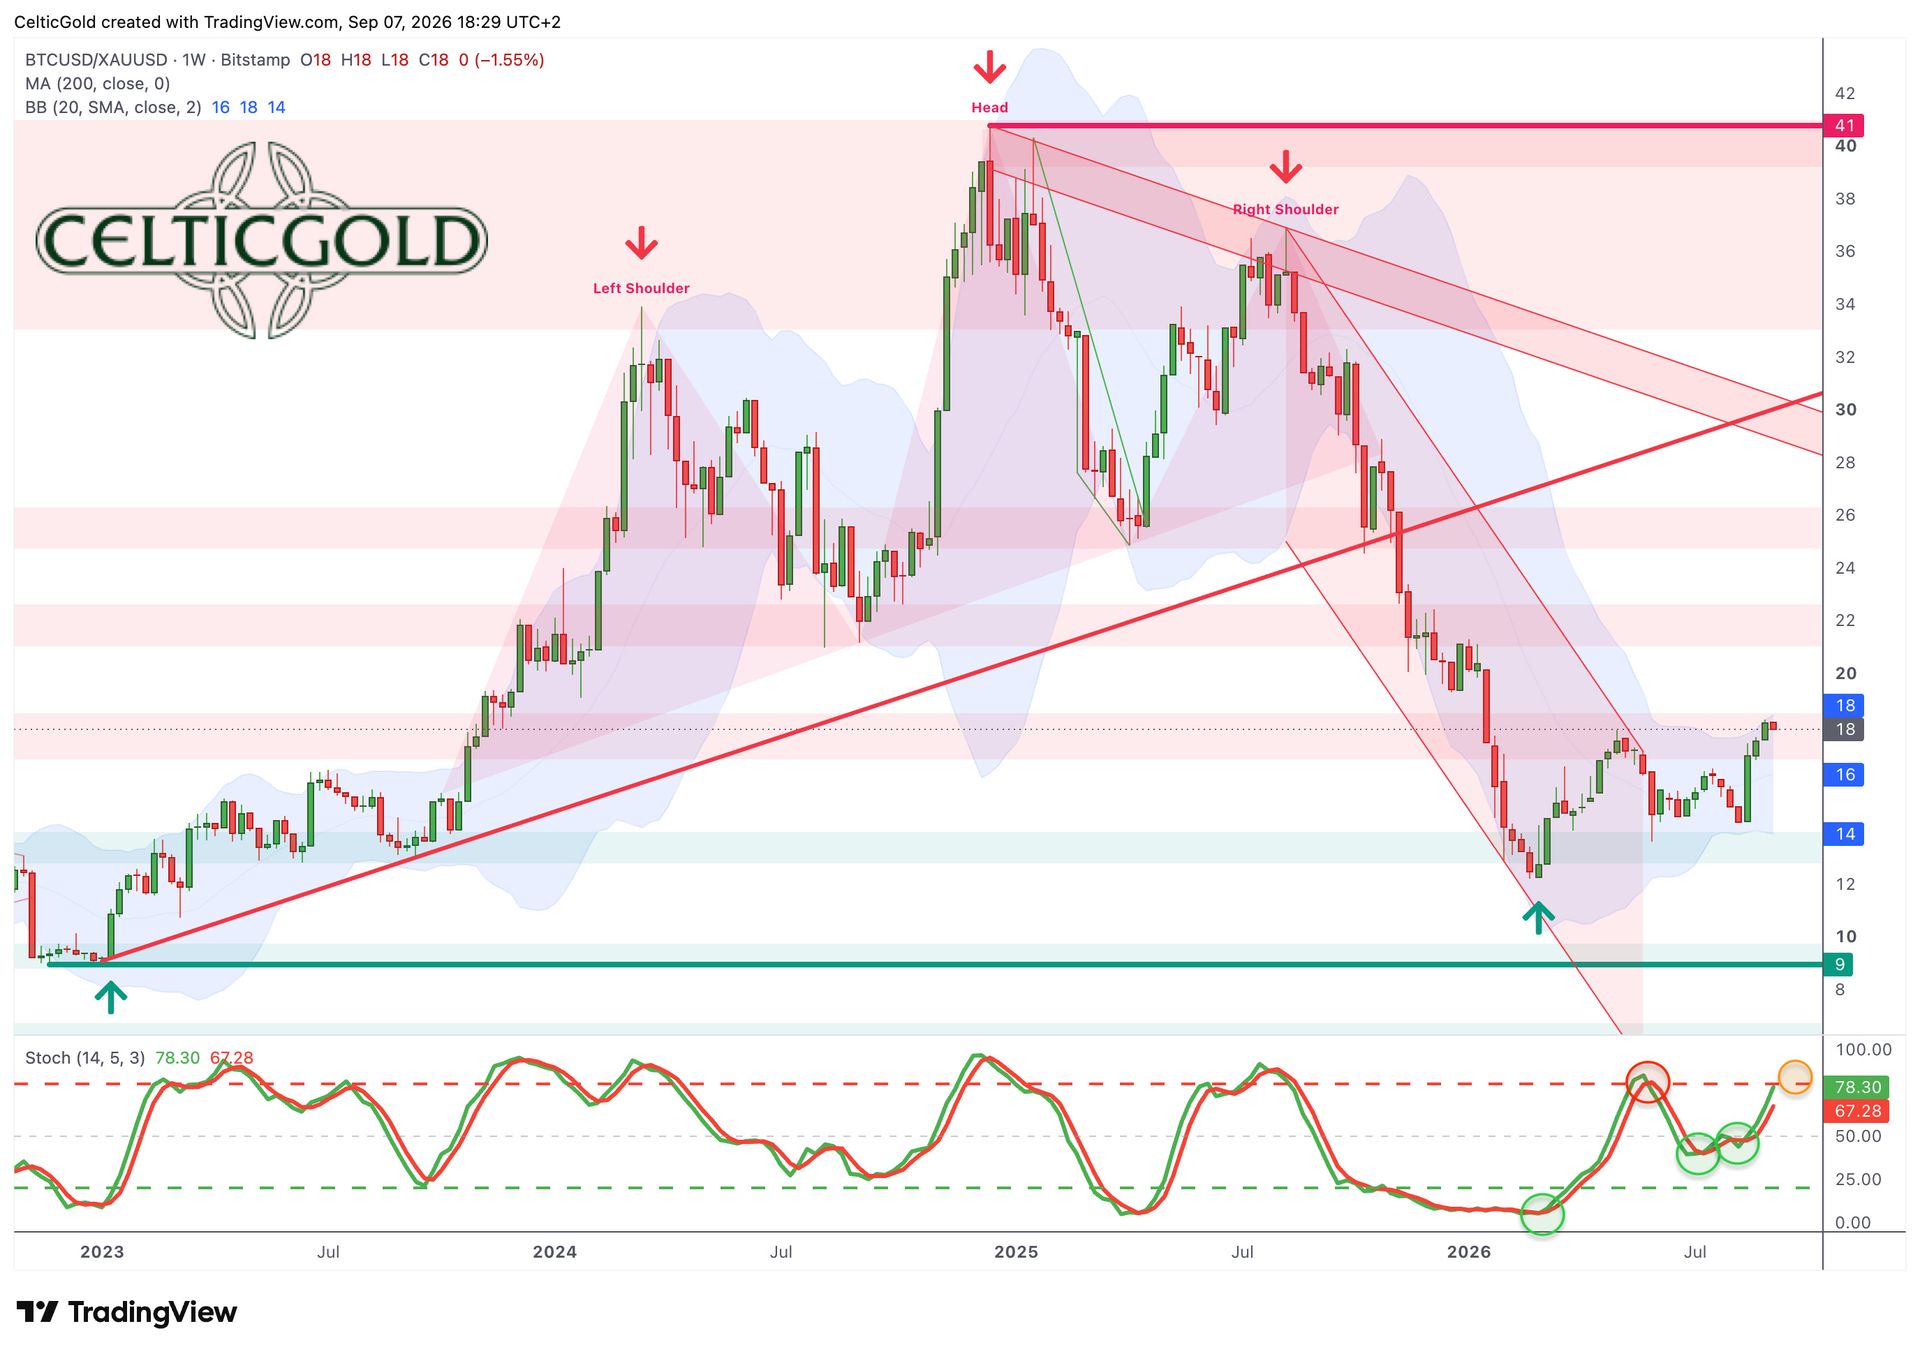
Bitcoin/Gold ratio, weekly chart as of 7 September 2026. Source: Tradingview
At a Bitcoin price of around USD 79,500 and a gold price of about USD 4,405 per ounce, one Bitcoin currently equals nearly 18.05 ounces of gold. Conversely, one ounce of gold currently costs around 0.055 Bitcoin.
After the Bitcoin/Gold ratio corrected sharply from around 37 down to around 12 over seven and a half months starting mid-August 2025, the ratio has been gradually recovering in Bitcoin's favor since late February. With values just above 18, the first Fibonacci retracement (23.6%) has been reached.
However, the stochastic is overbought on both the daily and weekly charts. In the short term, the upside potential therefore appears largely exhausted. Nonetheless, much suggests that the ratio could continue recovering toward 20–22 in the coming months.
In summary, the Bitcoin/Gold ratio increasingly points to a trend reversal in Bitcoin's favour. It may, however, take some time before this is also confirmed technically on the chart. For that, a rise in the ratio above 22 would be necessary.
6. Macro Update: A Volatile Late Summer – Is a Rate Hike Coming?
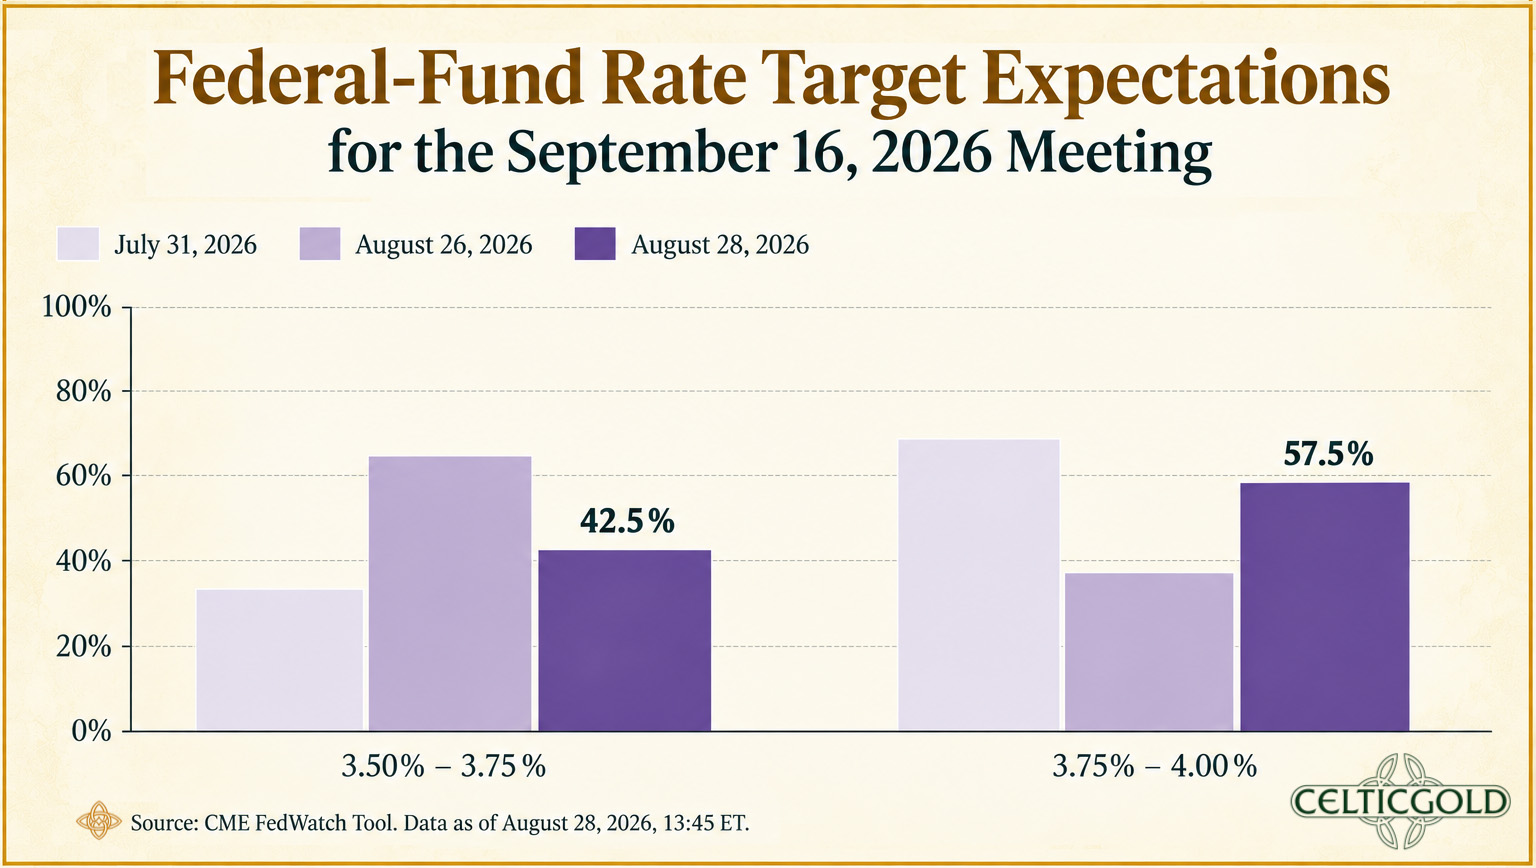
Expectations for the US Federal Reserve's key interest rate, as of 7 September 2026. Source: CME FedWatch Tool
At the start of the year, the market was still betting on a continuation of the easing cycle — further rate cuts were considered the base case. In the meantime, the picture has flipped: instead of rate relief, a hike in September is now on the table. This reversal is being driven by stubborn inflation, fuelled in particular by the Iran conflict and the resulting oil price shock. The macroeconomic headwinds are palpable — and yet equity markets have continued to advance, driven by hopes that growth (especially thanks to the AI boom) is more resilient than feared.
But underneath the surface, things are simmering. While crude oil was long the laggard, it has now become the central inflation driver, forcing all other markets to readjust. Still below its breakout threshold just last week, WTI has since gained almost 10% — a signal that the energy market is no longer waiting. The real point, though: nobody consumes crude oil directly. What matters are the refined products — diesel, gasoline, jet fuel. And virtually everything we use is produced and transported using diesel.
This is exactly where the inflation risk lies: if the prices of these end products go through the roof, the resulting inflation becomes broad, persistent, and politically hard to ignore. Come autumn, the illusion that the oil price shock is only a temporary phenomenon could therefore burst — because in the end, nobody fills up on crude oil. What drives the economy is diesel and gasoline.
Fed in a Bind: Strong Jobs, Hot Inflation
The latest US labor market report has only sharpened the Fed's dilemma. August payrolls rose by 162,000 jobs — almost three times more than expected — pushing the probability of a September rate hike further upward.
Yet even as rate hike expectations rise, gold, silver, mining stocks, and Bitcoin are showing hardly any real weakness. This resilience signals that hard assets have long since seen through the real problem: the Fed can tighten financial conditions, but it cannot eliminate the supply-side pressures rebuilding beneath the surface of inflation.
And even a robust labor market and rising yields were not enough to push the US Dollar Index back above the 100 mark. At the same time, copper remains stubbornly strong, global food prices continue to rise, and crude oil has begun a new upward move. This is a broad inflationary impulse spreading across nearly all commodity markets, with energy prices pulling the entire commodity cycle higher with them.
CPI on September 11: The Spark for the Markets?
This puts the US consumer price index for August, due for release on 11 September, at the centre of attention. A soft reading would strengthen the case for lower financing costs, while an upside surprise could keep rates higher for longer. Currently, expectations for the federal funds rate at the 16 September 2026 meeting are again above 50% — a clear signal that the market is pricing in a further rate hike as a realistic option. The next nine days will therefore be tense and could bring significant market moves.
The Bigger Picture: Debt, Money Printing, and the Flight to Real Money
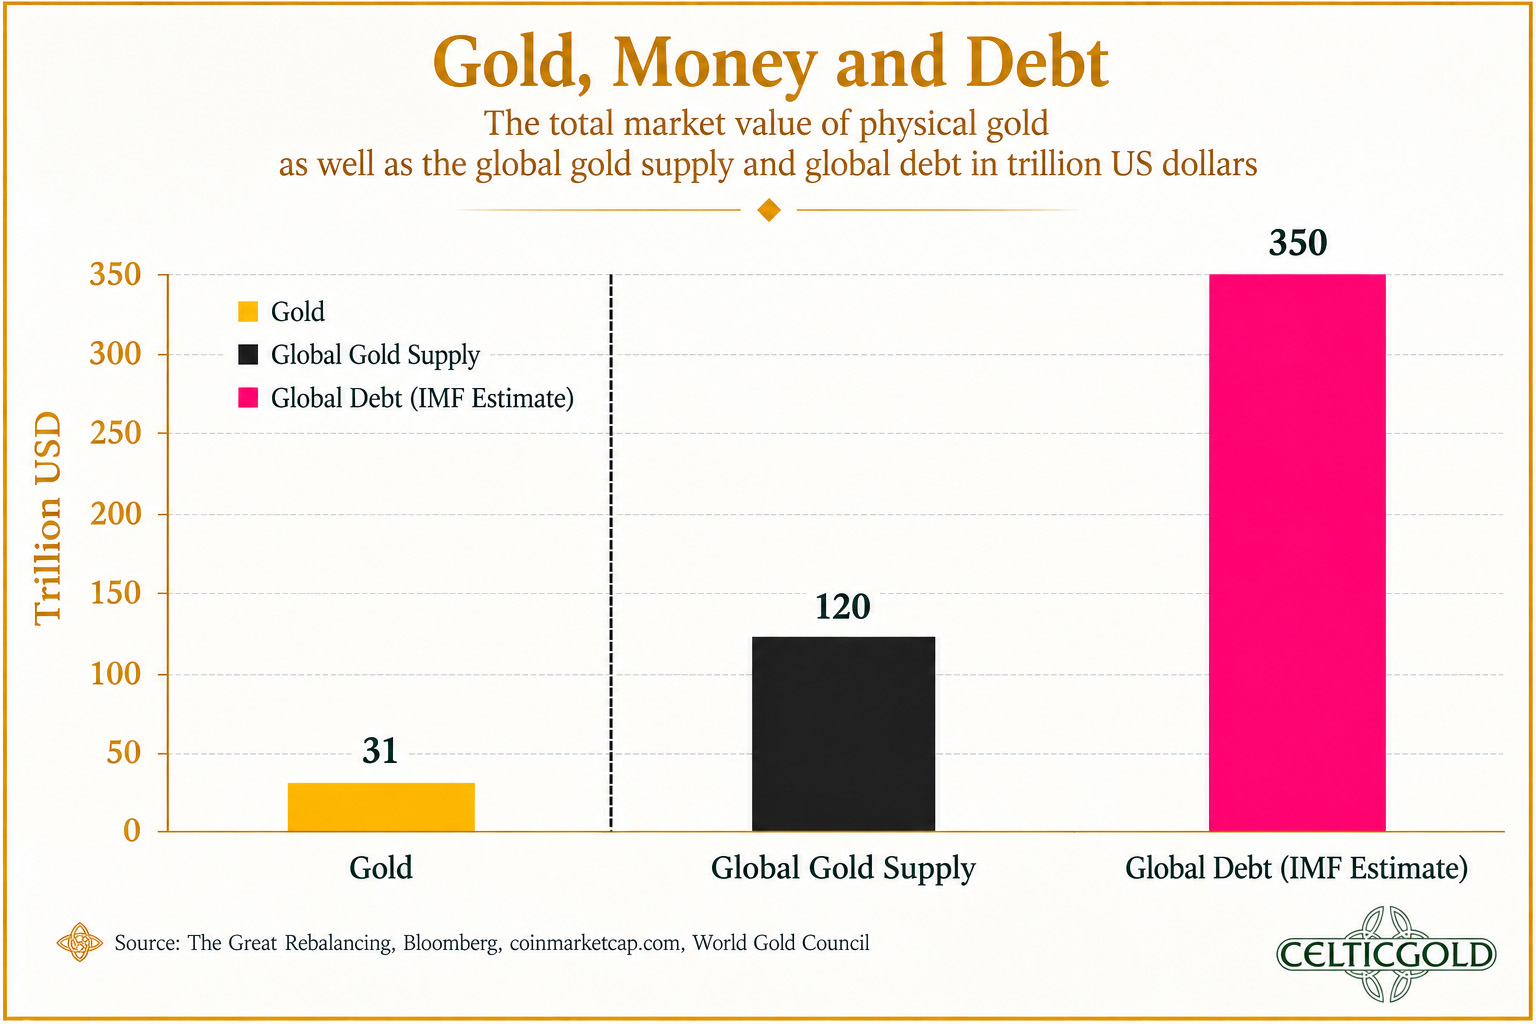
Gold, money, and debt, as of 2 June 2026. Source: The Great Rebalancing, Bloomberg, coinmarketcap.com, World Gold Council
When governments finance deficits of enormous scale year after year, the point inevitably arrives where it is no longer possible to sell all the new debt to willing buyers. Instead, new fiat money is created out of thin air to absorb the issuance. This money does not stay locked inside the financial system — it seeps into prices. Bondholders wake up one day to find their holdings yield less than inflation. Savings that seemed “safe” quietly lose purchasing power year after year. Those who thought they invested conservatively realise they effectively lent at a loss. It is precisely at this moment that capital begins to move. Investors no longer want to hold debt instruments, but things that cannot be multiplied at the push of a button.
Gold takes on its historical role in such phases. For 5,000 years it has proven itself as a store of value that no central bank can print. Its supply grows only slowly, it has no CEO, no expiration date, and no promise that can be broken. When Ripple's Brad Garlinghouse warns that the Dutch central bank moved gold worth around USD 11 billion from New York to London over several months — with roughly 70% of it never physically moved but merely sold in New York and repurchased in London — that is more than an anecdote. It recalls 2013, when Germany needed four years to repatriate 674 tonnes of gold worth USD 36 billion from Paris and New York. Such manoeuvres suggest that central players are strategically reshuffling their reserves behind the scenes — an environment in which decentralised, non-sanctionable assets like Bitcoin could structurally benefit as well.
When paper assets deliver negative real returns, gold does not need to “go to the moon”. It is enough for it to hold its value while everything else is diluted. This is exactly the point most people overlook — until the dilution becomes impossible to ignore.
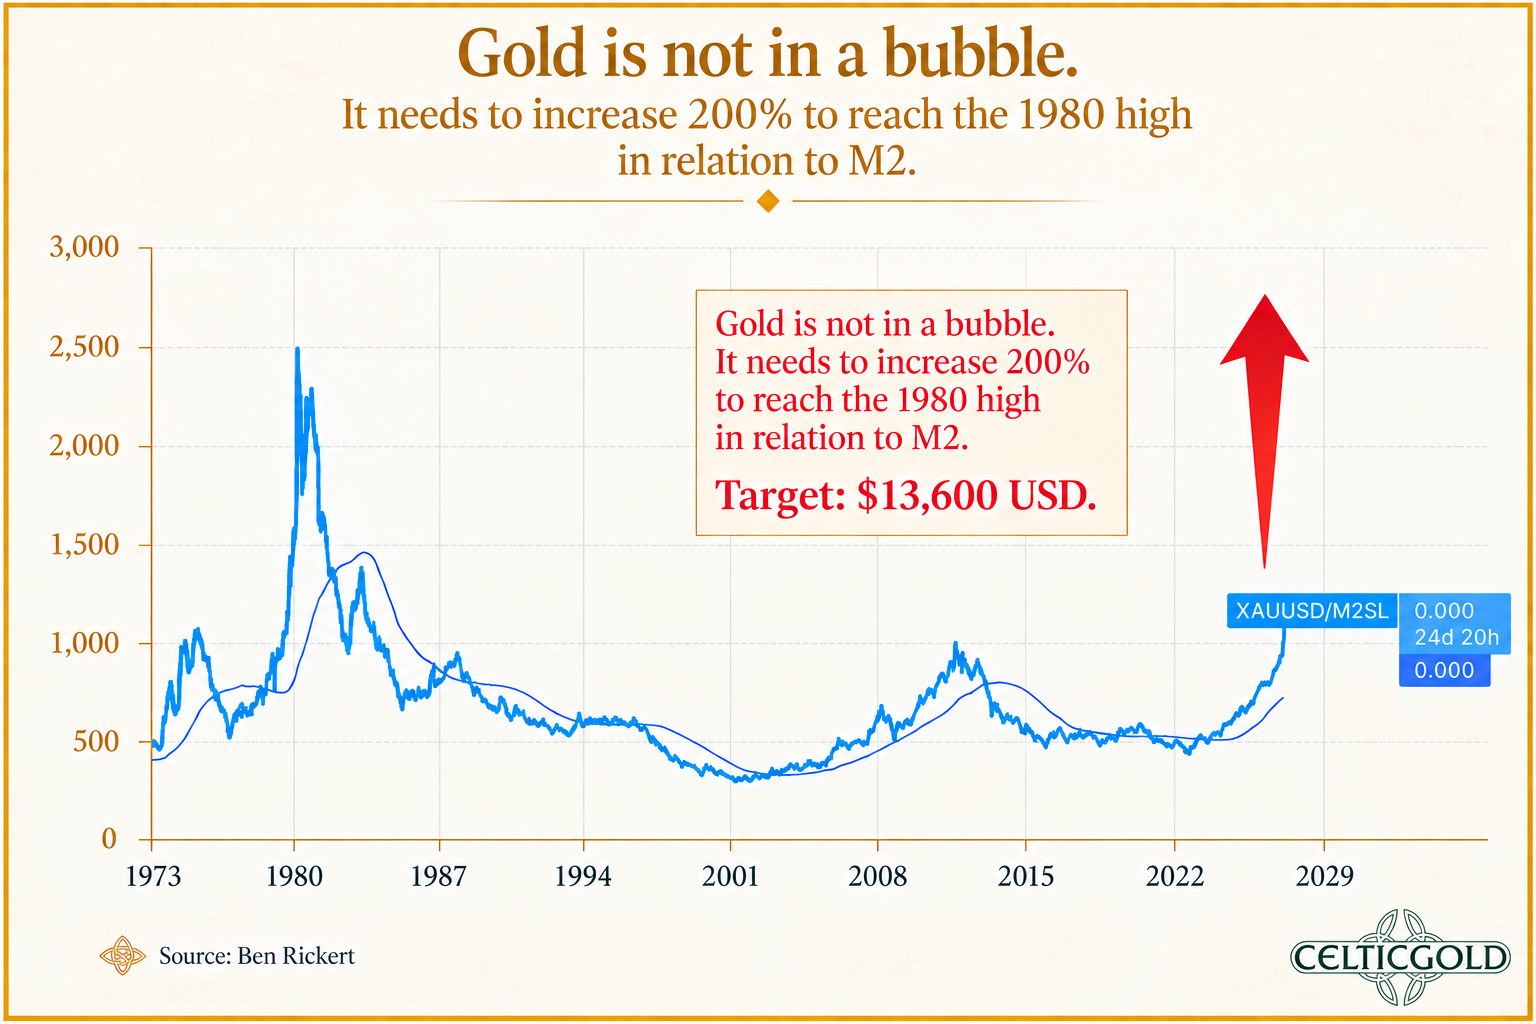
Gold measured against the M2 money supply, as of 6 September 2026. Source: Ben Rickert
Ray Dalio recently made clear that the next two years are essentially already decided: more debt, more money printing, more gold. Measured against the M2 money supply, gold remains significantly undervalued; to reach its 1980 high relative to today's paper money supply, the price would need to rise by roughly 200% to about USD 13,600!
Big Tech vs. Treasury: The New Battle for Bond Capital
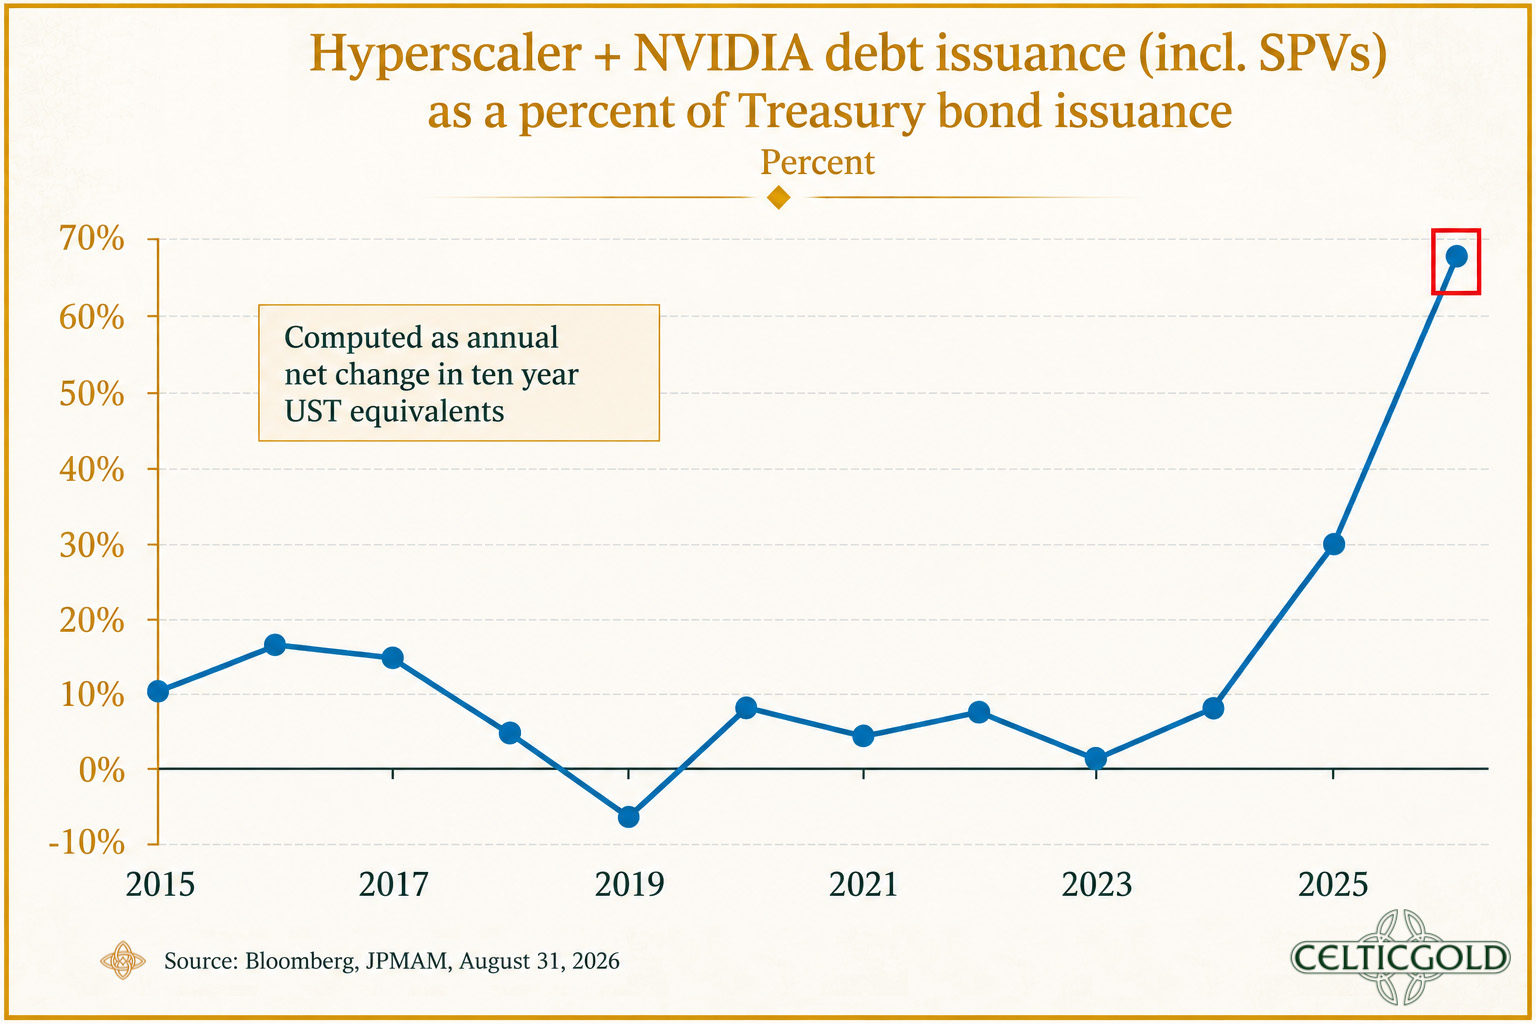
Hyperscaler & NVIDIA bond issuance as a percentage of US Treasury issuance, as of 6 September 2026. Source: Bloomberg, JPMAM, August 31, 2026, The Kobeissi Letter
At the same time, competition in the bond market is intensifying: the AI-driven debt boom keeps pushing yields higher. Combined issuance by Big Tech companies — including their special purpose vehicles (SPVs) — is expected to reach a record USD 320 billion this year, an increase of USD 120 billion over the prior year (+60%). Measured against US Treasury issuance, this would represent a share of around 70% — more than double the 2025 figure and nearly nine times the 2024 level. Big Tech is thus increasingly becoming a serious competitor to the US government at the long end of the bond market, competing for the same pool of investors, who in turn are demanding higher compensation for holding this debt.
The Quiet Discrepancy: Tech CDS vs. Bank Credit
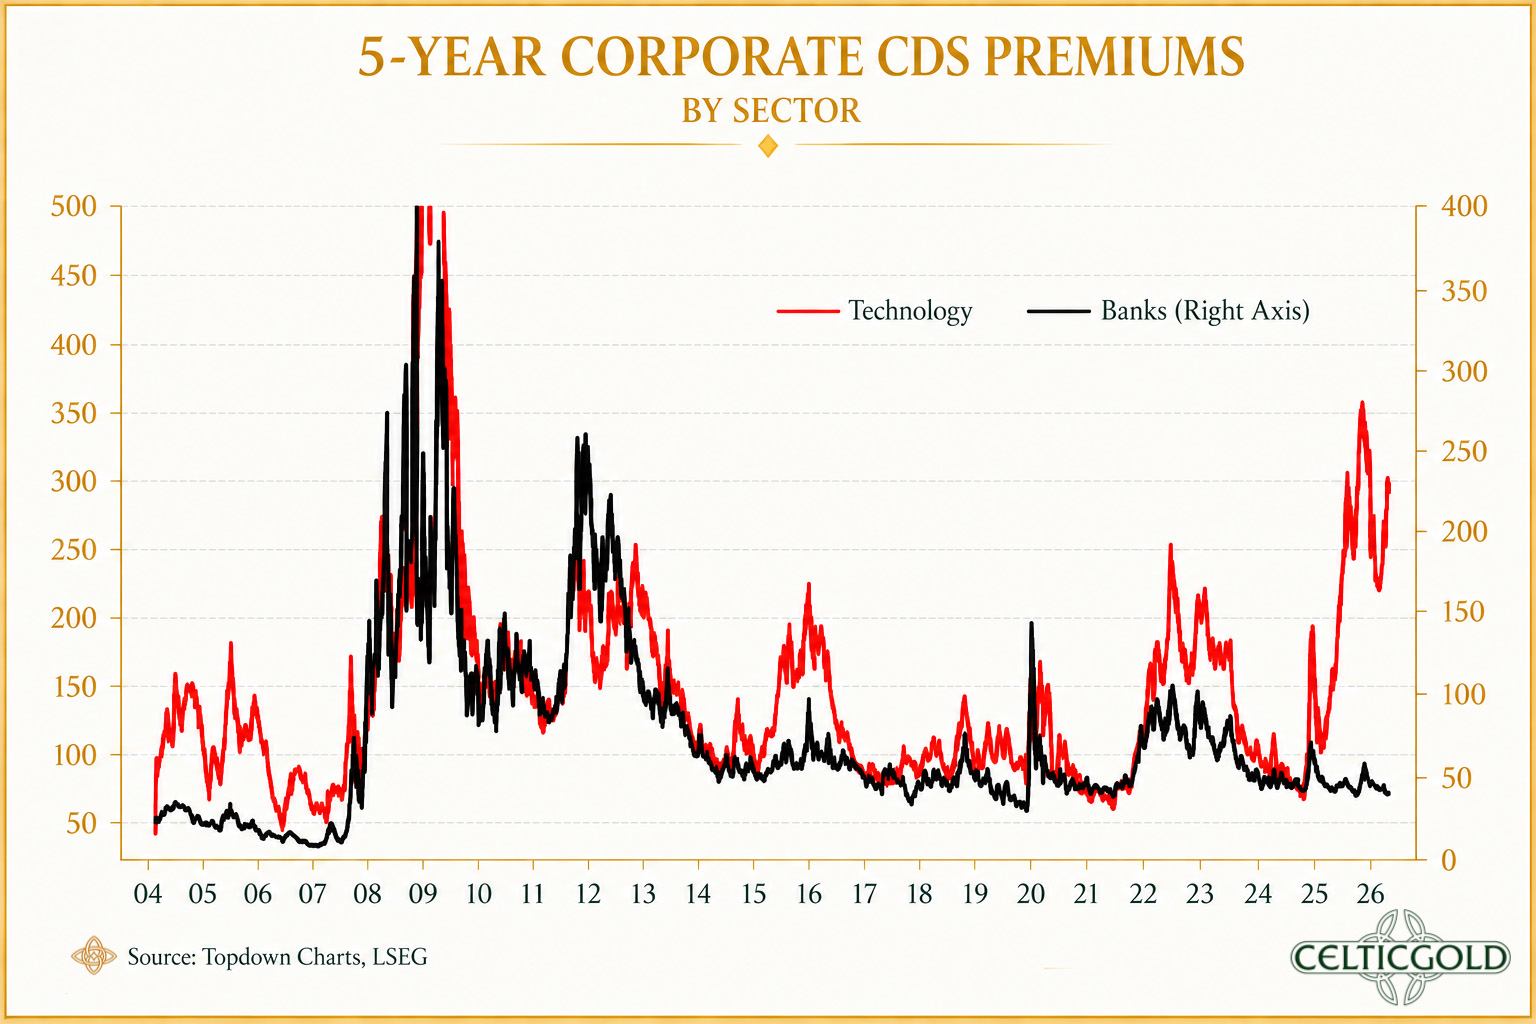
5-year CDS premiums for corporate bonds by sector, as of 5 September 2026. Source: Topdown Charts, LSEG
Anyone who assumes the financial system is not exposed to debt risk in the technology sector is mistaken. Credit default swaps (CDS) are considered an important early indicator of perceived creditworthiness for sovereigns and corporations — a rising CDS spread signals higher default risk. While bank CDS spreads remain at low levels, credit risk in the technology sector rose sharply in 2025. Behind this development lie primarily the high costs of the hyperscalers' ambitious build-out pace. Still, the divergence from the banking sector is notable.
The AI Revolution and Bitcoin: From Tools to Autonomous Economic Agents
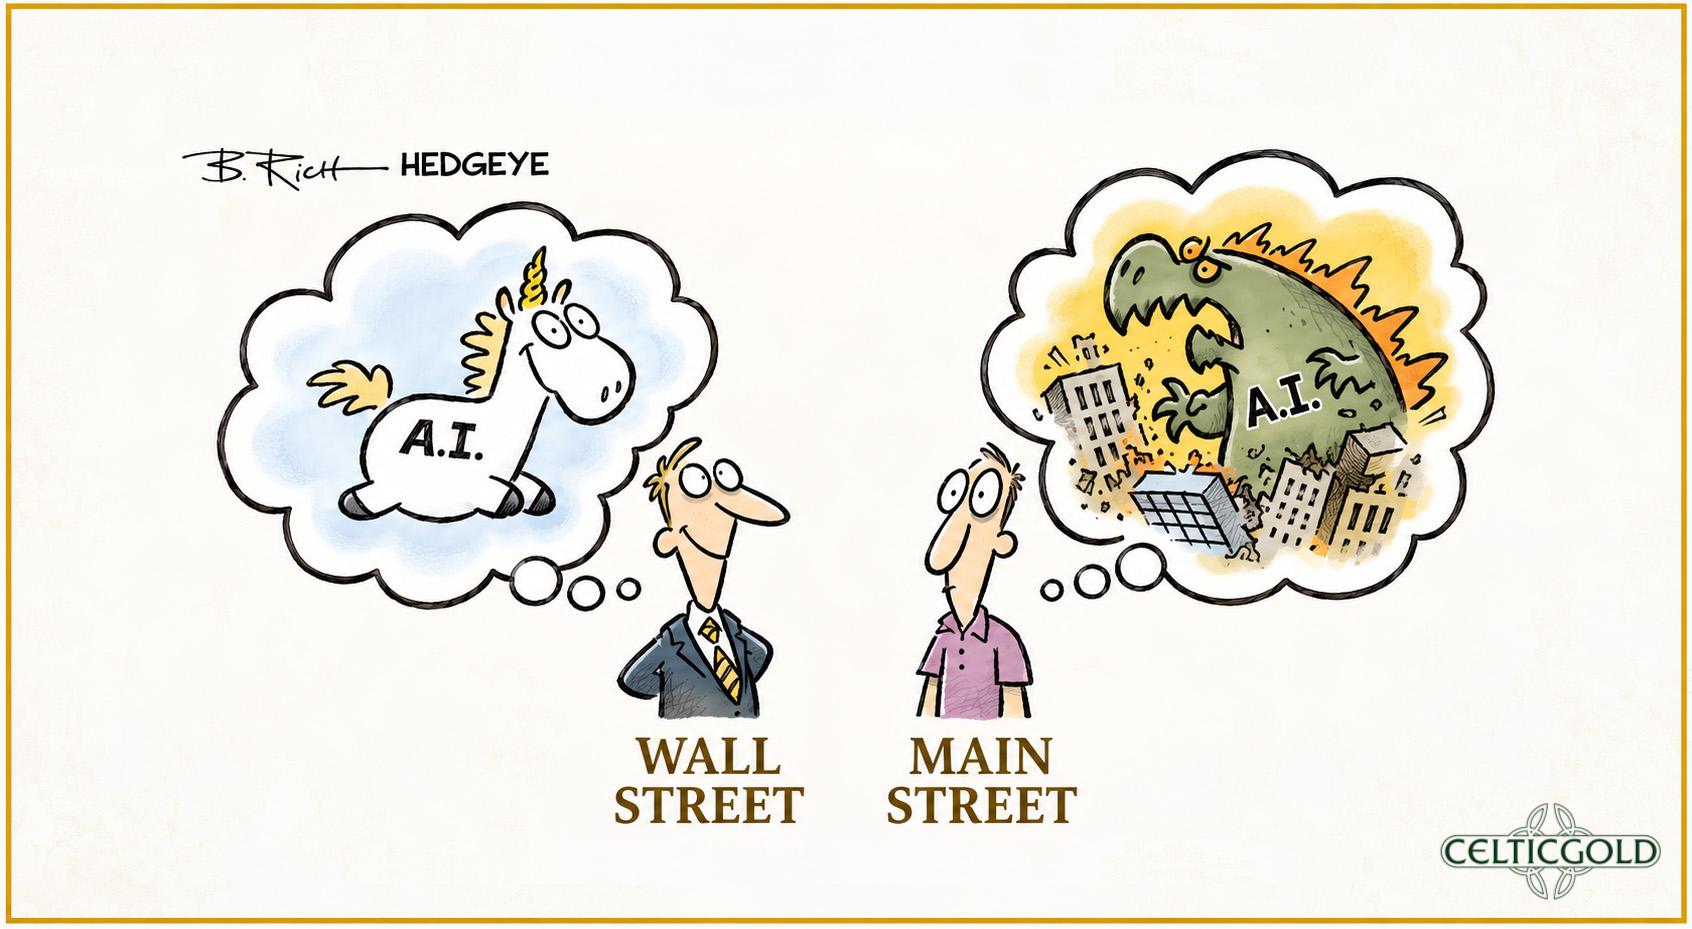
Source: B.Rich, Hedgeye
At the same time as the bond market is being recapitalised, the AI revolution is transforming the real economy in parallel — with direct implications for Bitcoin.
The accelerating industrial AI revolution could give Bitcoin a long-term boost. Artificial intelligence is evolving from a helpful tool into an independently acting economic factor. While ChatGPT and similar applications initially generated mostly text, images, or code, the age of so-called agentic AI is now beginning: intelligent systems that can independently plan complex tasks, make decisions, and manage complete workflows without constant human intervention.
At the same time, AI is transforming global finance. Digital assets, stablecoins, and blockchain technologies are increasingly being linked with intelligent agent systems. AI agents could in the future independently execute payments (e.g. an AI agent paying rent in BTC), manage assets (e.g. autonomous treasury management in BTC), conclude contracts, or prepare investment decisions — all based on predefined rules and objectives.
In such a world, Bitcoin gains additional importance as a decentralised, censorship-resistant, and globally available reserve asset. While AI increases the productivity of the world economy, Bitcoin, thanks to its mathematically capped supply of a maximum 21 million units, remains a scarce digital good. If the economic output created by AI grows faster than the available Bitcoin supply, its long-term monetary appeal is likely to keep increasing.
Macro Risk Window: Midterms, Liquidity, and the Next Cycle
From a macro perspective, however, the next two months remain a risk window for Bitcoin: on 3 November 2026, the US midterm elections will decide control of the House of Representatives and part of the Senate — and with it, fiscal policy, regulation, and the administration's room to manoeuvre in the second half of the term. Historically, midterms generate volatility but rarely a lasting trend reversal; they can, however, trigger brief and sharp risk-off phases before clarity emerges on majorities and the agenda.

Source: unknown, own illustration, CelticGold Research
At the same time, the cyclical signals for the next Bitcoin upswing are building: the sharpest liquidity contraction of the correction is behind us, the yen carry trade and the BoJ's rate normalisation are known headwinds that are partly priced in, while geopolitically driven inflation and a possible later monetary policy response from the Fed structurally support Bitcoin's scarce supply.
The next bull cycle therefore does not need to be formally “declared” — with the sharp price rise from the summer low, it may already have begun. It is more likely, however, that it will only clearly assert itself after the midterm event.

Source: own illustration, inspired by the Monopoly rulebook
In the short term, the dynamic therefore remains macro- and policy-driven; in the medium term, however, it will be carried by tighter supply, growing institutional demand, and a world order in which liquidity shocks and AI-driven productivity leaps structurally increase the appeal of hard, decentralised reserve assets like Bitcoin.
7. Conclusion: Bitcoin – Explosive Breakout
The breakout from its nine-month downtrend is likely more than just a technical recovery for Bitcoin: it is the visible symptom of a deeper regime shift in the macroeconomic environment. While the Fed remains caught between stubborn inflation, a robust labour market, and political pressure, global capital allocation is quietly shifting away from pure paper assets towards scarce, non-manipulable stores of value. Within this tension, Bitcoin — having weathered the anticipated crypto winter — once again serves as a digital, decentralised counterweight to a world in which mountains of debt, money printing, and supply-side inflation shocks are becoming the new normal.
At the same time, current sentiment issues a short-term warning against too much euphoria. The overbought stochastic and a still-uncertain seasonal environment increase the probability of short, sharp pullbacks — particularly ahead of the US midterms as well as the CPI release and Fed meeting already in September. Yet even a pullback all the way to the 200-day line would not invalidate the broader trend; on the contrary, it could offer attractive entry zones for the next cycle. The real question, therefore, is not whether the crypto winter is over, but whether markets are ready to reassess Bitcoin's structural role as a scarce, censorship-resistant reserve asset in a world shaped by AI, debt, and geopolitical fractures.
In the long run, much suggests that we are not merely at the beginning of a classic “Bitcoin cycle,” but at a transition to a new monetary regime in which hard assets — whether gold, Bitcoin, or other scarce goods — are no longer merely speculative objects but necessary portfolio building blocks. In the short term, volatility remains high; in the medium term, however, the thesis gains weight that Bitcoin has not only weathered the crypto winter but has once again proven its function as digital “hard money” in an increasingly unstable financial architecture.
This “Bitcoin – Explosive Breakout” analysis was sponsored and initially published exclusively for CelticGold on 7 September 2026, by www.celticgold.de. Translated into English on 8 September 2026.
Join us in our free Telegram channel for daily charts, real time data and a great community. If you like to get regular updates on precious metals, commodities, and bitcoin, subscribe to our free newsletter.
Disclosure:
This article and the content are for informational purposes only and do not contain investment advice or recommendations. Every investment and trading move involves risk, and readers should conduct their own research when making a decision. The views, thoughts, and opinions expressed here are the author's alone. They do not necessarily reflect or represent the views and opinions of Midas Touch Consulting.
About the Author: Florian Grummes
Florian Grummes is an independent financial analyst, advisor, consultant, mentor, trader & investor as well as an international speaker with more than 30 years of experience in financial markets.
Florian is the founder and managing director of his company Midas Touch Consulting, which is specialised in trading & investments as well as consulting, analysis & research with a focus on precious metals, commodities and digital assets.
Via Midas Touch Consulting he is publishing daily and weekly gold, silver, bitcoin & cryptocurrency analysis for his numerous international readers. Florian is well known for combining technical, fundamental/macro and sentiment analysis into one often accurate conclusion about the markets.