1. Review
After a sharp two-month rise to a new all-time high of USD 2,149 on 4th December, the gold market experienced a sharp pullback to USD 1,973 in the final weeks of the old trading year, followed by a rapid recovery to USD 2,088. To digest this overall quite tumultuous market activity, gold prices had entered a slow and confusing sideways phase since the beginning of the year. This was necessary to calm down the overbought situation after this rollercoaster ride. Gold – This breakout is undeniable.
During this consolidation, all attempts to break out on the upside repeatedly failed at the resistance zone around USD 2,055. At the same time, the psychological level of USD 2,000 resisted the bear attacks. Only in mid-February did they seem to successfully break through to the downside. However, the drop below USD 2,000 quickly turned out to be a bear trap because, starting from the low of USD 1,985, gold prices reclaimed the psychological round number support with a closing price of USD 2,004 on the next trading day.
1.1 Bear trap below USD 2,000
Subsequently, gold prices rose steeply and continuously for a total of 18 trading days from 14th February. Since breaking through the downtrend line at USD 2,055 on Friday of the previous week, this rally accelerated. Gold prices not only effortlessly surpassed the old all-time high at USD 2,075 but also reached the highest level ever, peaking at USD 2,195 last Friday.
Undoubtedly, this marks the definitive end of the 13-year correction and consolidation phase that repeatedly hindered bullish efforts in the range between USD 1,900 and USD 2,075. Consequently, the steep breakout rally pushed gold up by over USD 210 in a very short period of time. Regardless of short-term pullbacks or interim consolidations, this likely signifies only the beginning of the next major uptrend in the precious metals sector!
2. Chart Analysis – Gold in US-Dollar
2.1 Weekly chart: Medium-term price target at USD 2,525
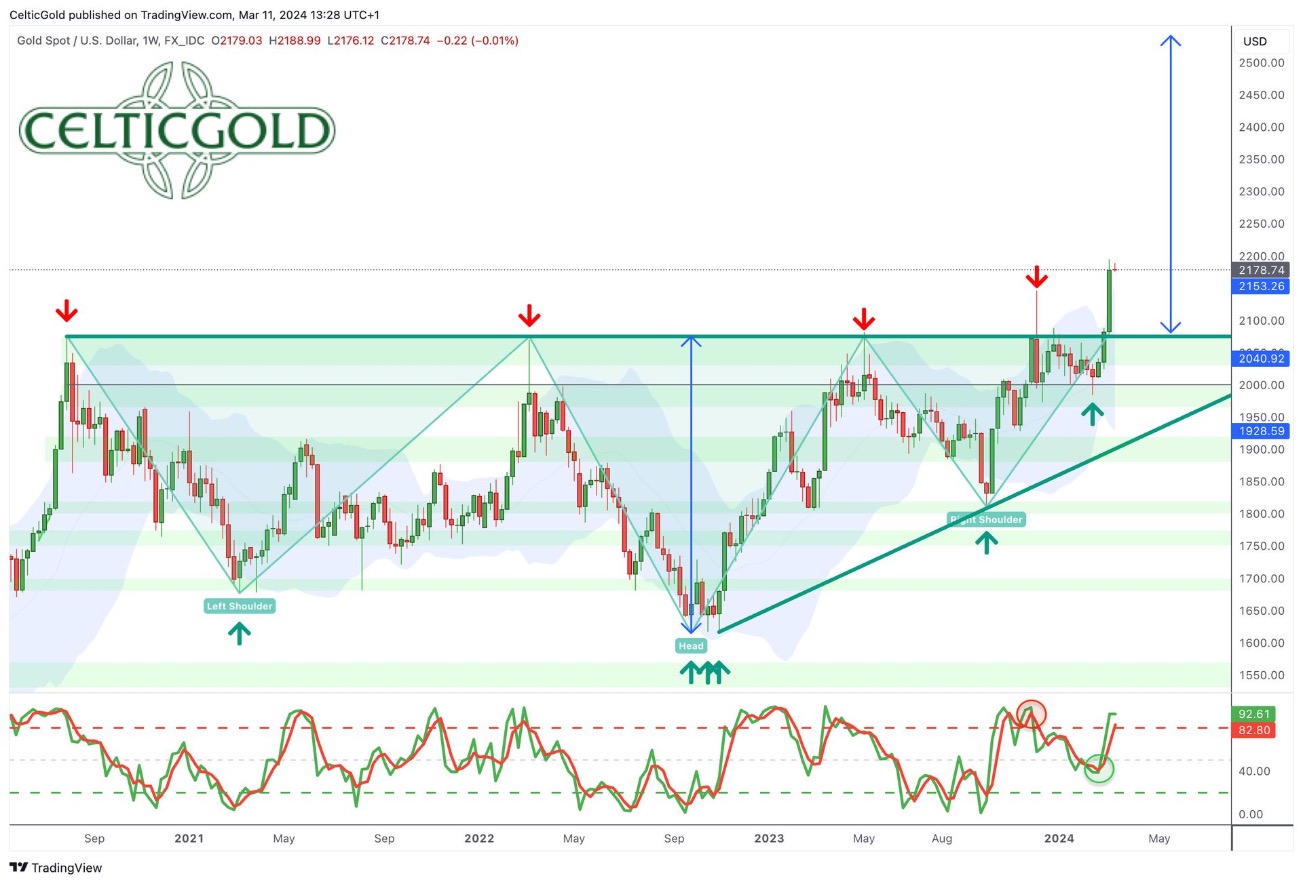
Gold in US-Dollar, weekly chart as of March 11th, 2024. Source: Tradingview
After the initial attempt failed back in December, gold finally and decisively surpassed the major resistance of the last three and a half years around USD 2,075 on Friday, 1st March. This bullish price action confirms the significant inverse head and shoulders formation and brings an end to the long wait. The target from this formation is approximately USD 2,535 and could potentially be reached in one volatile surge!
However, on the weekly chart, gold prices are currently trading well outside the upper Bollinger Band (USD 2,153). Statistically, the air is somewhat thin with prices around USD 2,180 at least in the short term.
Yet, it is essential not to underestimate the fact that the energy accumulated over three and a half years is now being unleashed in the gold market. The momentum is clearly on the side of the bulls. It can also be assumed that after the two-and-a-half-month consolidation, the ongoing rally is unlikely to end after just three weeks. In case of doubt, the new uptrend may continue swiftly but with volatility.
Overall, the weekly chart is bullish. Gold should be on its way towards USD 2,535 in the medium term. Significantly higher prices are also conceivable afterward. Possible pullbacks to the old resistance zone in the range between USD 2,075 and USD 2,100 should still be anticipated and would be a buying opportunity.
2.2 Daily chart: Stochastic Bullish Embedded
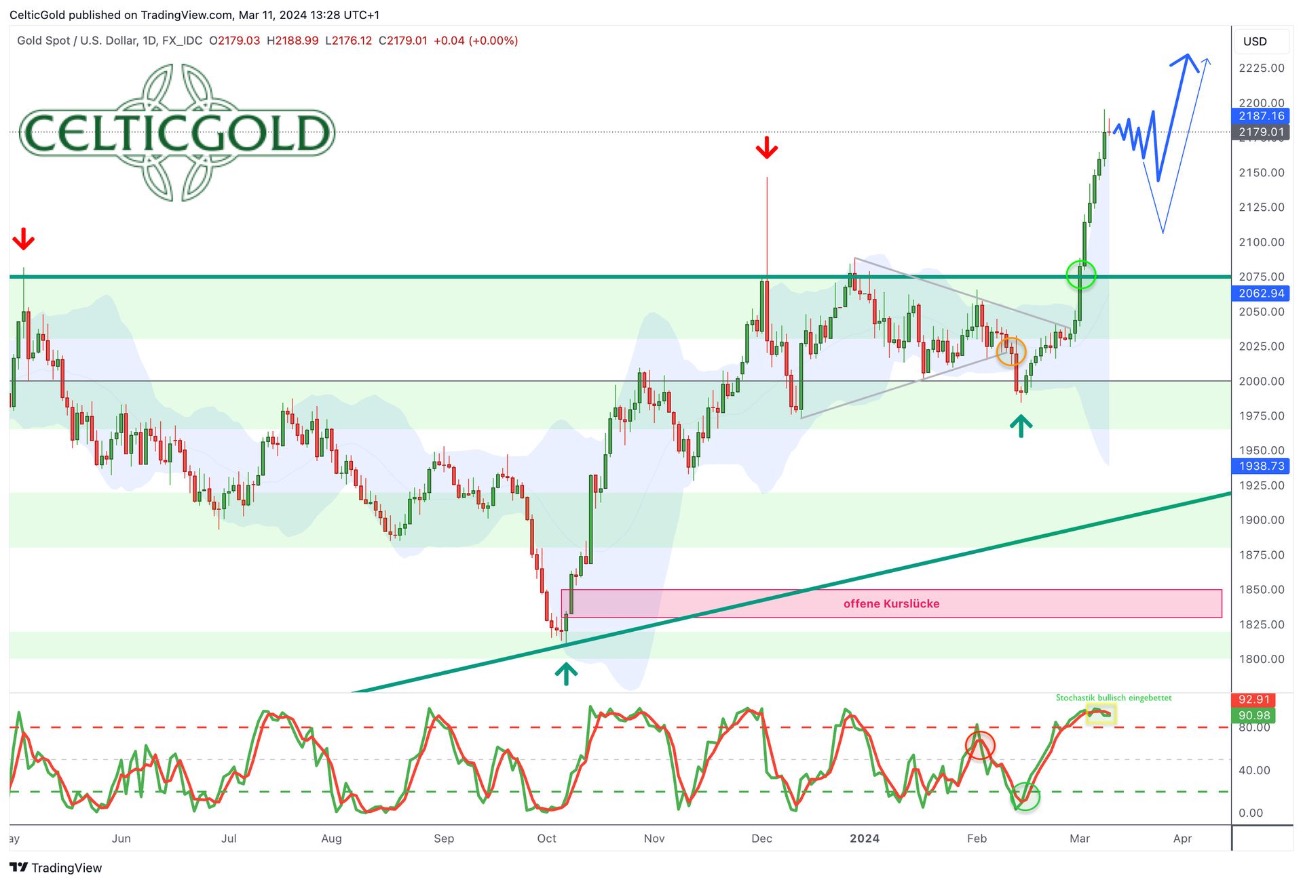
Gold in US-Dollar, daily chart as of March 11th, 2024. Source: Tradingview
Since the low on 14th February at USD 1,985, gold initially exploded slowly, but since Friday, 1st March, has almost vertically surged upwards. Any resistances were quickly shattered, and gold climbed higher every day. A new all-time high was reached at USD 2,195 last Friday. The old high from 4th December USD 2,149 only slightly slowed down the upward momentum.
The sharpness and speed of this rally may be surprising to many, but we have repeatedly pointed out that the breakout will release tremendous energy.
From a technical perspective, the gold price is now in unchartered territory because there are no more known resistance and support zones above USD 2,150. One can only speculate, project, and calculate possible trend extensions.
However, a warning comes from the Bollinger Bands on the daily chart, too, as gold climbed higher six days in a row outside the upper Bollinger Band (USD 2,187). Statistically, six to seven days are an absolute rarity and usually the utmost limit.
2.3 Gold needs a bit of a breather here
To restore balance, it does not necessarily have to lead to a sharp reversal. A sideways consolidation at a high level would also bring the price action back within the Bollinger Bands. In the current new trading week, this is the most likely scenario.
At the same time, the daily stochastic is extremely bullish. The oscillator has transformed into the rare “bullishly embedded status” since the beginning of last week, firmly locking in the uptrend. Only if one of the two signal lines closes below 80 by the end of the day would this special state be lost, likely resulting in a larger pullback. As long as the embedded status remains, any consolidations and pullbacks should only be viewed as a temporary breather.
In summary, the daily chart is in “super-bull mode.” The likelihood of gold returning to the USD 2,100 range at least once is not low. However, from which level, when, and if at all, is entirely unclear. Instead, the bulls firmly control the situation, and the only sensible strategy for those who have missed the rally so far is to patiently wait for a slightly larger pullback.
3. Commitments of Traders for Gold – Bearish
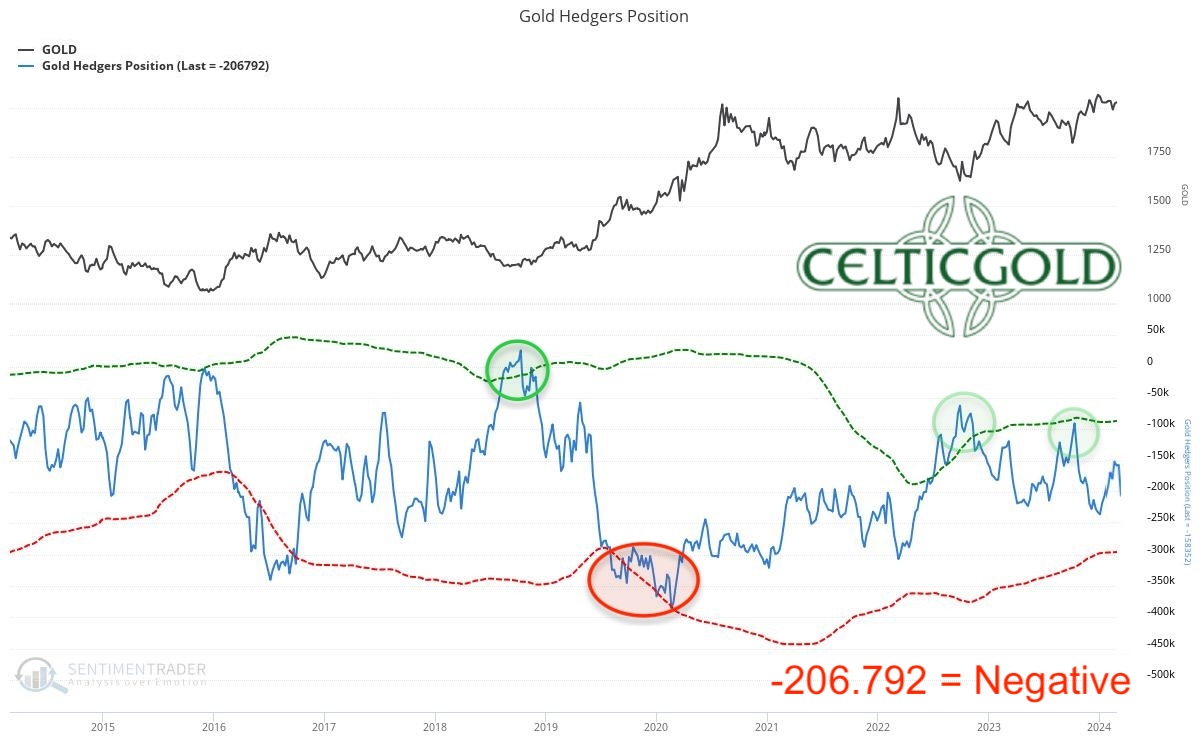
Commitments of Traders (COT) for gold as of March 8th, 2024. Source: Sentimentrader
At a gold price of USD 2,128, commercial traders held a cumulative short position of 206,792 gold futures contracts as of last Tuesday. Previously, commercial traders had utilised the two-and-a-half-month consolidation period to significantly reduce their hedges and bets on falling prices. Now, the sharp increase in the gold price has consequently led to a rapid surge in their short positions within just one week. However, the positioning is not yet at extremely alarming levels.
Overall, the current Commitments of Traders (CoT) report is negative and contradicts the furious rally in the gold market.
4. Sentiment for Gold – Neutral
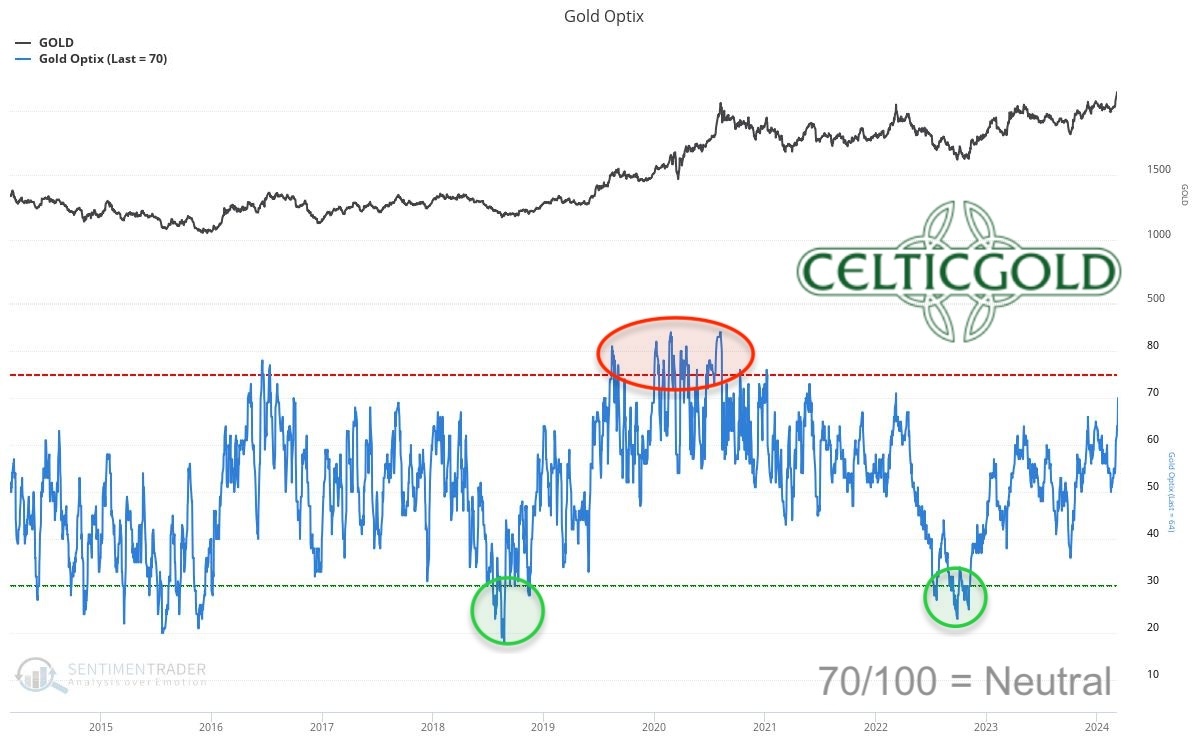
Sentiment Optix for gold as of March 8th, 2024. Source: Sentimentrader
With a value of 70, the sentiment in the gold market is rapidly approaching the danger zone. However, extreme optimism is not yet present. What stands out more is that the mainstream seems not to have noticed the breakout rally in the gold market so far. This leaves plenty of room for significantly higher prices.
The sentiment in the gold market is still neutral and does not pose an obstacle to higher prices for the time being.
5. Seasonality for Gold – Bullish
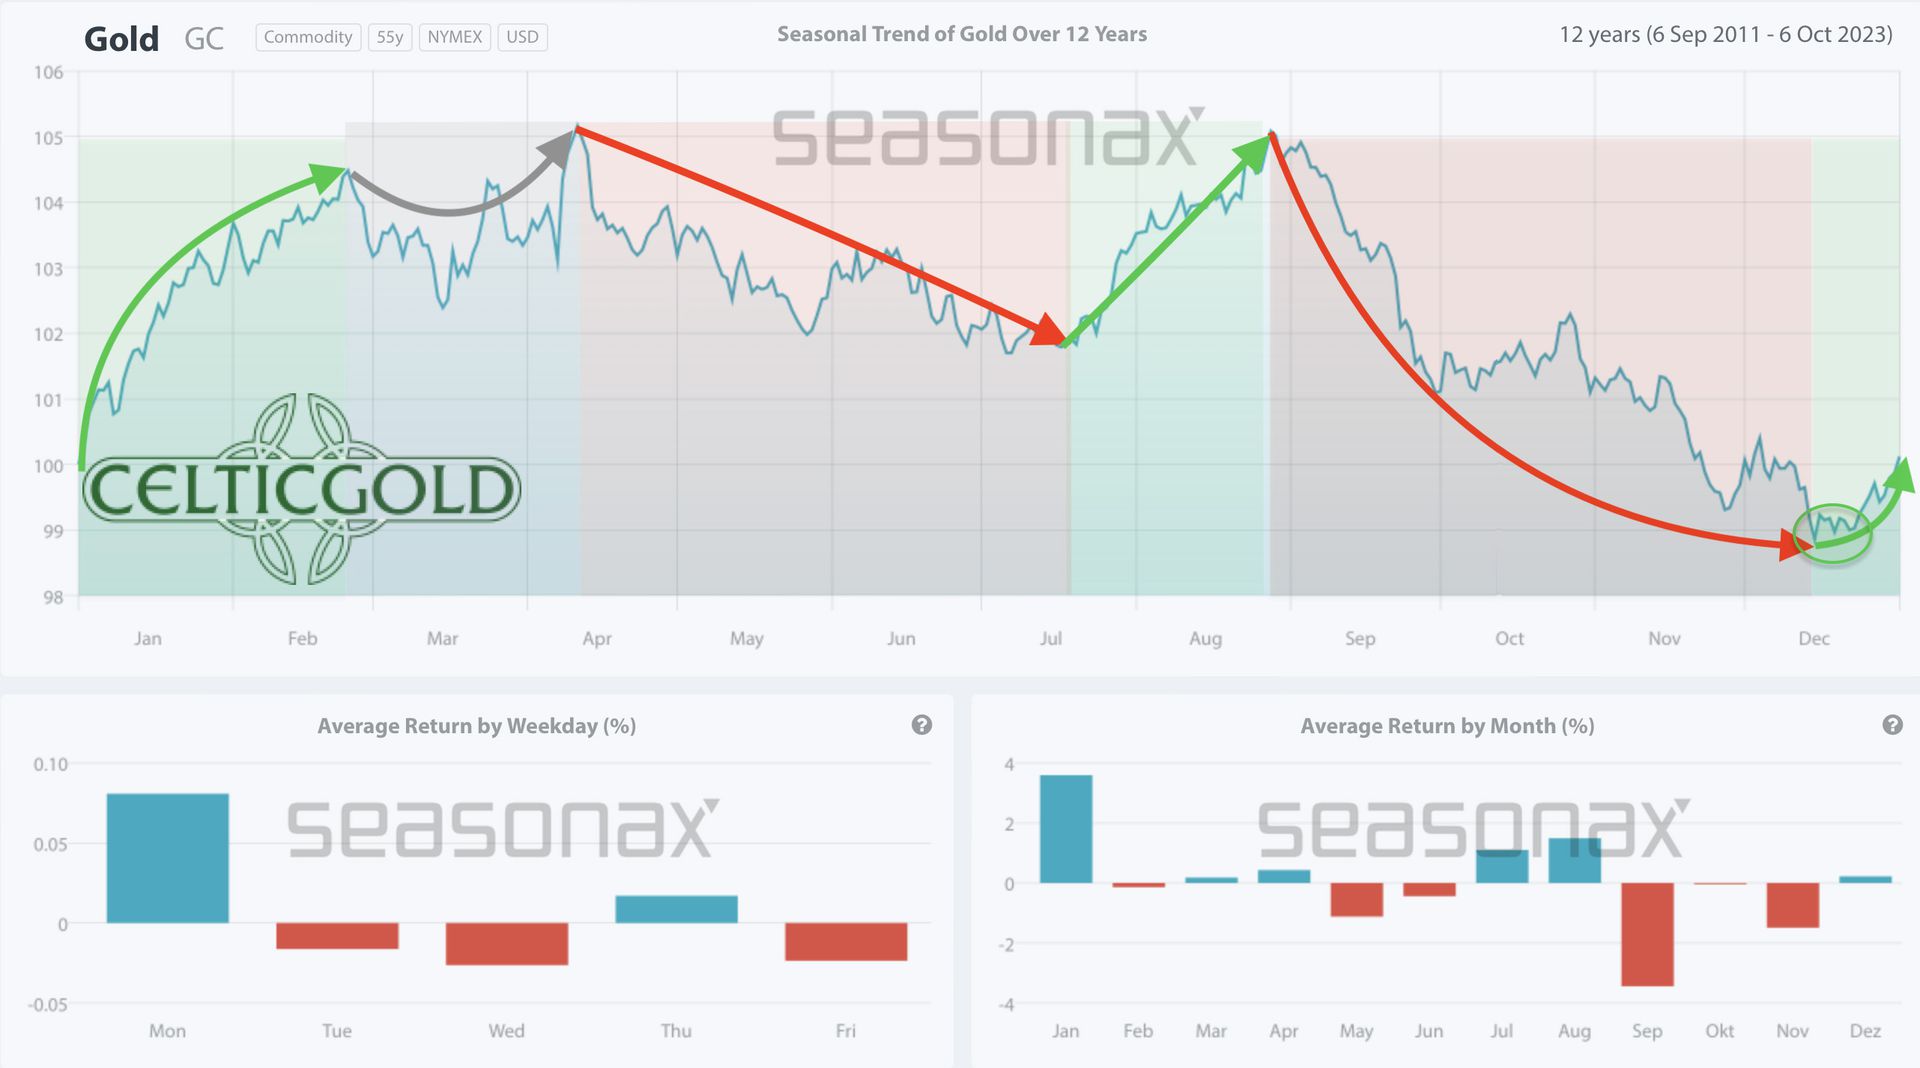 Seasonality for gold over the last 12-years as of March 8th, 2024. Source: Sentimentrader
While gold used its best phase of the year in January and February for an extensive consolidation, the statistically favourable seasonal window is slowly but steadily closing. Nevertheless, the price surge in the first week of March showed no signs of stopping. In general, a somewhat positive seasonality can be assumed for the gold market until early May. Only after that does the typically challenging phase in early summer come into play.
Based on the last 12 years, the seasonal component for the next two months is still somewhat bullish or at least supportive.
6. Macro update – The gold price is now made in China
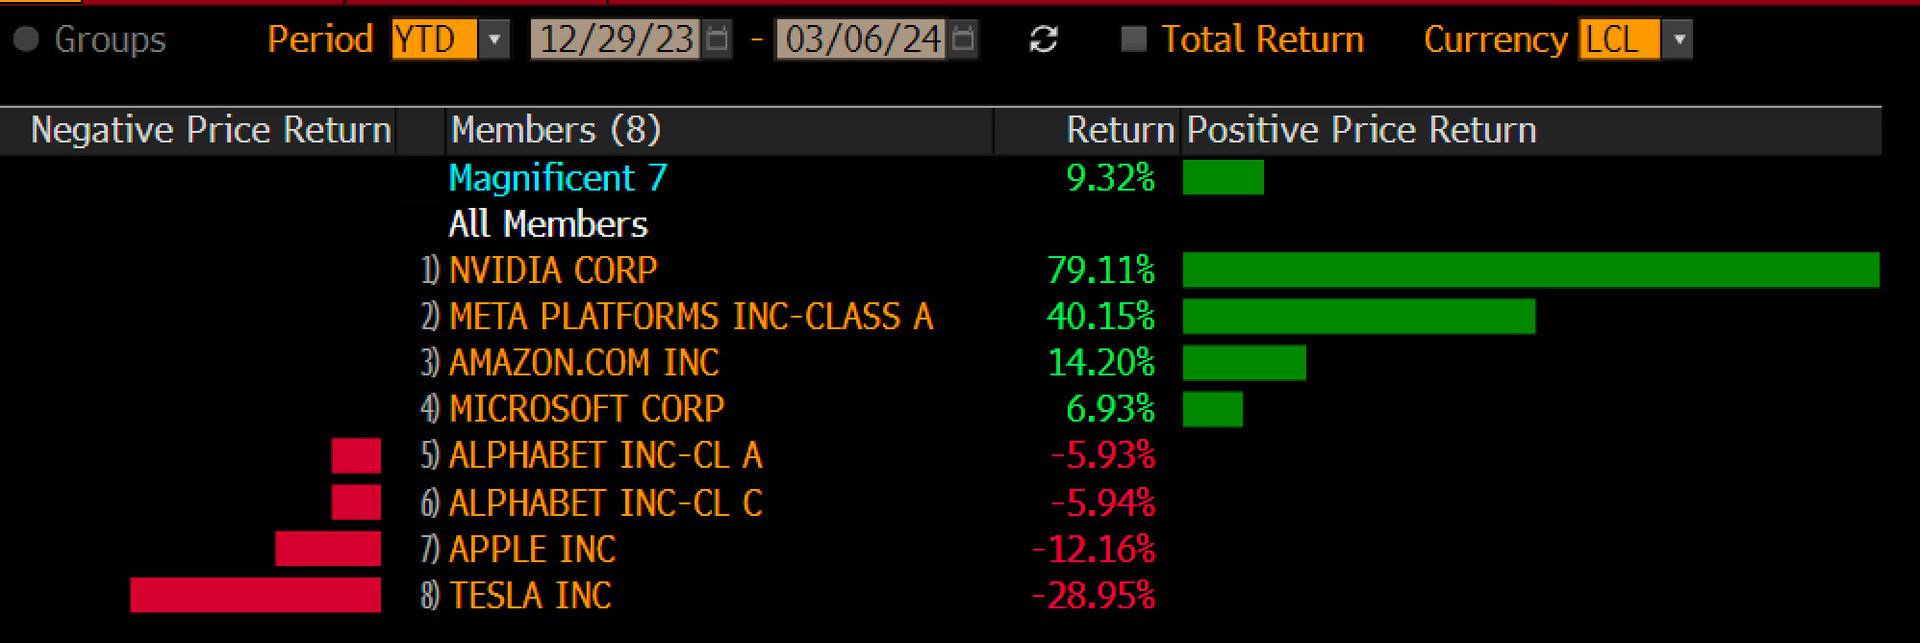 The Magnificent Seven in 2024, as of March 7th, 2024. Source: Holger Zschäpitz
For months, the western financial markets have enthusiastically celebrated the profit and stock price explosions of Nvidia, the American technology giant that has gained a significant lead in the field of AI semiconductors. Thanks to Nvidia, major stock indices have been reaching new highs, even though only four of the original “Magnificent Seven” have continued to advance. Alphabet/Google, Apple, and Tesla, on the other hand, have been trading in negative territory since the beginning of the year.
6.1 Nvidia is pulling back
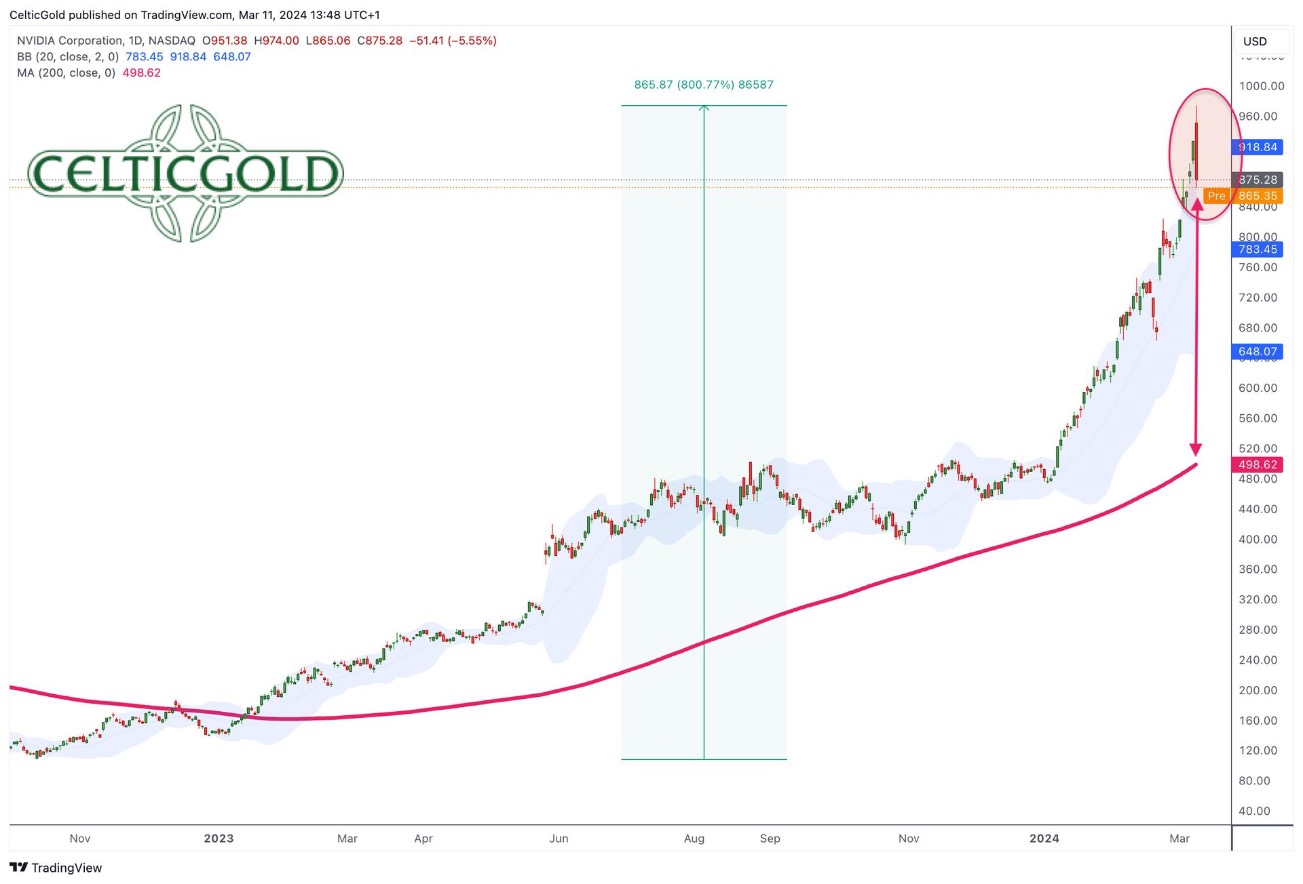
Nvidia in US-Dollar is pulling back, daily chart as of March 11th, 2024. Source: Tradingview
However, on Friday afternoon, Nvidia’s stocks experienced a sharp “intraday reversal,” dropping by 11.2% within just three hours. Over USD 250 billion in market capitalisation was wiped out pretty quickly. Just four years ago, Nvidia wasn’t even among the 50 largest publicly traded companies globally, but recently, it was only 15% away from surpassing Apple as the second-largest company.
Despite having a market capitalisation of around USD 2.17 trillion, the company’s stock price can exhibit volatility comparable to a penny stock. Moreover, the gap to the rising 200-day moving average (USD 498) has become quite large, suggesting a potential pullback/correction. If Nvidia were to take a deeper breather here, it could have severe consequences for the entire financial market. However, the rally or melt up in the markets is still intact. Typically, the bulls should maintain control until early May.
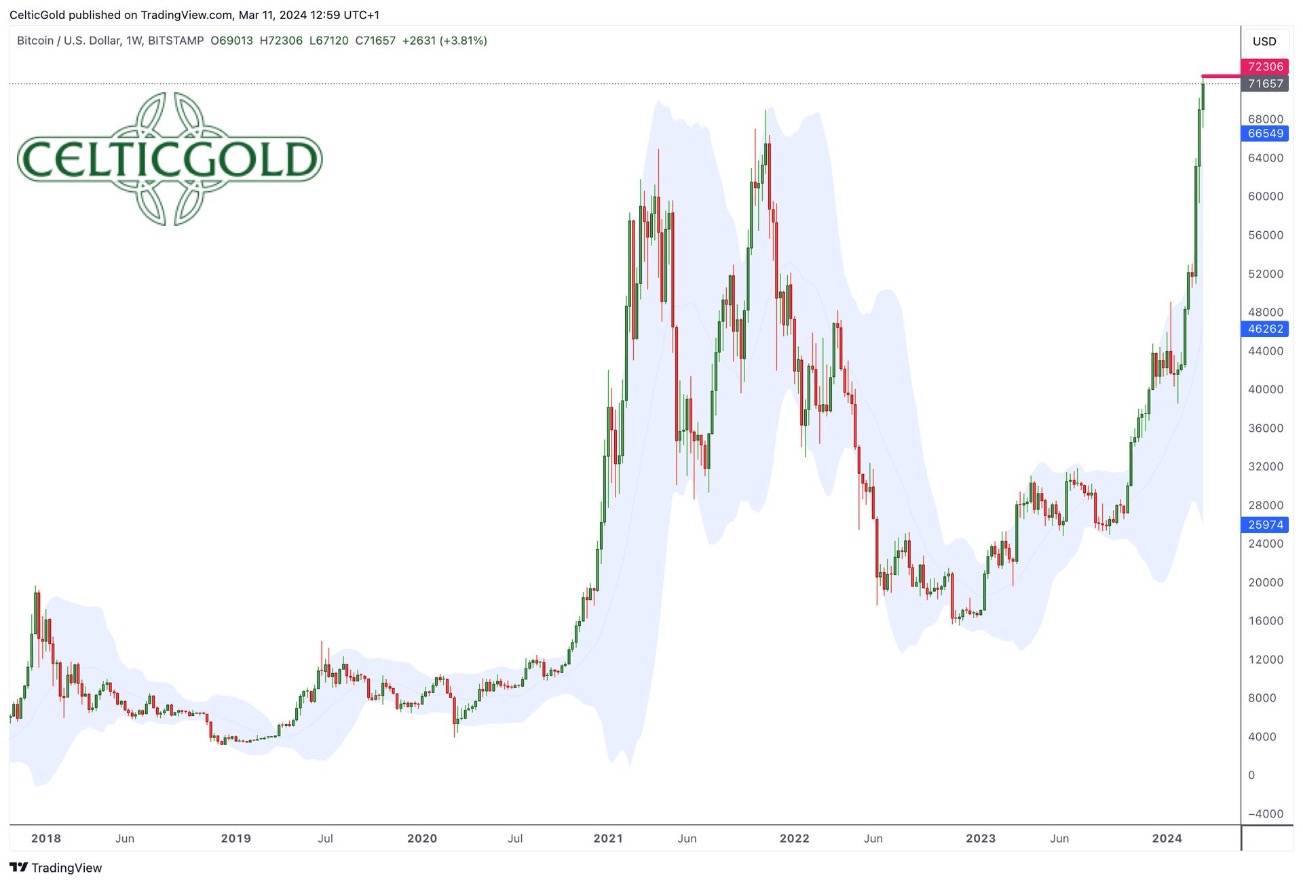
Bitcoin in US-Dollar with new all-time high, weekly chart as of March 11th, 2024. Source: Tradingview
Parallel to the hype around Nvidia, the new Bitcoin spot ETFs have generated astonishing demand, with as many as 12 buyers for one seller. The enthusiasm is spilling over into the tech sector, accelerating the trend. At times, it feels reminiscent of the late 1990s.
6.2 Commercial real estate in the US continues to be under pressure
Despite the excitement around Nvidia, another US bank, New York Community Bank ($NYCB), has been affected by the turbulences in US commercial real estate. While the bank had saved the failed Signature Bank back in March 2023, a group of hedge funds, including former US Treasury Secretary Steven Mnuchin, had to come to the rescue with a USD 1 billion financial injection last Wednesday evening. The hastily arranged capital infusion became necessary as the stock of the USD 114 billion credit lender came under increasing pressure in recent weeks due to a dividend cut, an unexpected quarterly loss, and credit rating downgrades. At its peak, the losses since the beginning of the year amounted to almost -84%. After the announcement of the USD 1 billion deal, the stock recovered significantly. However, whether this USD 1 billion will be sufficient, given a leverage ratio of 975% in 2023, remains doubtful.
A year after the collapse of the Silicon Valley Bank and Signature Bank, the increasing weakness in US commercial real estate is spreading to other banks, as expected. In Germany, the Deutsche Pfandbriefbank, heavily engaged in the US office real estate sector, has made headlines after a profit slump and significant share losses. Dividends and new business in the US were recently cut. The Pfandbriefbank emerged from the 2008 financial crisis when its predecessor, the “Münchner Immobilienbank Hypo Real Estate” (HRE), had to be nationalised by the government in 2010 due to the threat of collapse. The former German government then divided HRE into a state owned “bad bank” with bad and risky loans and a “healthy” bank with the rest of the HRE portfolio.
6.3 Central banks remain “data-dependent”
Unfortunately, the decline of US regional banks is unfolding as expected and is likely to trigger second-round effects worldwide. However, Federal Reserve Chairman Jerome Powell described the risks in the US banking sector as manageable, even though some lenders would incur losses. The Fed is in contact with the banks to ensure they have enough liquidity and capital to absorb any losses. The European Central Bank (ECB), officially at least, seems to be turning a blind eye to the cannon shots and, like the Fed, pursues a “data-dependent approach” in determining the interest rate path.
Given the nearly vertical price increases in many tech stocks and the still elevated inflation, imminent interest rate cuts in the US have become extremely questionable. However, only until the market really crashes. That could happen very quickly as the end of the Bank Term Funding Program BFTP is near. The next crisis may only be manageable with massive rescue packages in the trillions from the Fed and the FDIC deposit insurance.
6.4 The gold price is now made in China
Meanwhile, gold has reacted to the recent problems in the US banking sector with a sharp breakout, reaching new record levels last Friday. This development was long forecasted from a technical perspective. Now it has happened. However, it seems that the phenomenal rally is primarily due to the physical buying pressure from China.
While in Germany, beleaguered citizens must partially liquidate their accumulated precious metals to cope with rising living costs and a challenging economic situation, the Chinese government encourages its citizens to buy gold and leads by example.
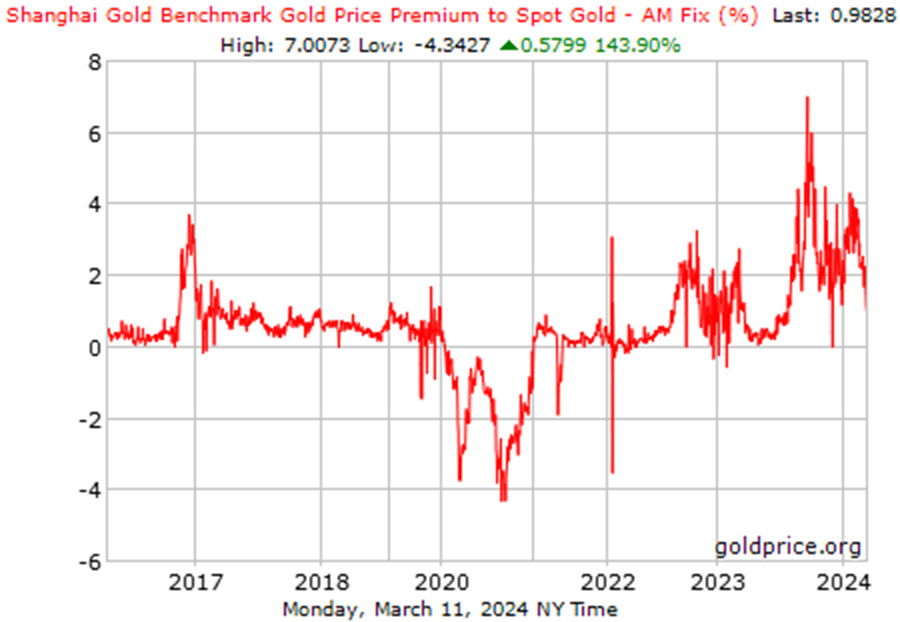
Shanghai Gold Premium as of March 11th, 2024. Source: Goldprice.com
At the Shanghai Gold Exchange, premiums have been surging since late summer 2023. Although the premiums compared to gold prices in the West are slightly lower at the beginning of the week, the gold price in Shanghai was trading around USD 2,200 this morning. Record levels have been reported for seven consecutive days. China dominates the physical gold market through strong demand from the central bank and the buying frenzy at the beginning of the Year of the Dragon. Through arbitrage trading, the paper gold market in the West is increasingly under pressure.
Overall, the macroeconomic environment remains highly favourable for the gold price.
7. Conclusion: Gold – This breakout is undeniable
Gold has broken out to a new all-time high in the last trading week and so far shows no signs of a significant pullback. However, a brief pause at high levels would be healthy.
After years of unsuccessful attempts to breach the resistance around USD 2,075, the situation has now fundamentally changed for the gold price. The trend is clearly up, and the first price target in the range of USD 2,535 seems to be achievable in the next one to three months or by early summer.
Nevertheless, sharp pullbacks and high volatility can cause temporary discomfort and, above all, confusion. Even though a deep retracement to the range between USD 2,075 and USD 2,125 appears unlikely at the moment, it would represent an excellent buying opportunity.
“Conclusion: Gold – This breakout is undeniable” – analysis initially published on March 11th, 2024, by www.celticgold.de. Translated into English and partially updated on March 11th, 2024.Feel free to join us in our free Telegram channel for daily real time data and a great community. If you like to get regular updates on our gold model, precious metals and cryptocurrencies you can also subscribe to our free newsletter.
Disclosure:
This article and the content are for informational purposes only and do not contain investment advice or recommendations. Every investment and trading move involves risk, and readers should conduct their own research when making a decision. The views, thoughts and opinions expressed here are the author’s alone. They do not necessarily reflect or represent the views and opinions of Midas Touch Consulting.
About the Author: Florian Grummes
Florian Grummes is an independent financial analyst, advisor, consultant, trader & investor as well as an international speaker with more than 20 years of experience in financial markets. He is specialized in precious metals, cryptocurrencies, and technical analysis and is publishing weekly gold, silver & cryptocurrency analysis for his numerous international readers. Florian is also running a large telegram Channel and a Crypto Signal Service. Florian is well known for combining technical, fundamental and sentiment analysis into one accurate conclusion about the markets.
