Gold has captivated investors and markets alike, surging from USD 2,585 on 18th December 2024, to a staggering new all-time high of USD 3,500 within just four and a half months, marking a remarkable 35.4% rally. Fueled by economic uncertainties, geopolitical tensions, and a robust gold rush in China, this meteoric rise has now paused, with prices consolidating in a volatile sideways range between USD 3,260 and USD 3,370. As the market catches its breath, the interplay of technical signals, futures positioning, and macroeconomic dynamics—particularly China’s voracious gold demand and global market volatility—sets the stage for a critical juncture. This analysis delves into the forces shaping gold’s trajectory, assessing whether the rally will resume toward USD 4,000 or face a deeper correction.
1. Review
Since the last significant low and trend reversal on 18th December at USD 2,585, the gold price has surged spectacularly over the past four and a half months. In January and February, gold prices climbed almost daily. A brief but sharp pullback to USD 2,832 occurred in the final week of February.
Subsequently, the uptrend accelerated, effortlessly breaching the psychological USD 3,000 mark. Amid collapsing stock markets, another sharp but fleeting pullback hit USD 3,167, finding technical support at USD 2,955. As this support held, the gold price exploded upward by USD 543 (+18.39%) within just ten trading days.
The rally halted abruptly at the round figure of USD 3,500, with bears pushing prices down by USD 240 to USD 3,260 in just 32 hours. Since then, a volatile consolidation has ensued, with bulls unable to surpass USD 3,370 and bears failing to break below USD 3,260. Thus, the gold price is currently trapped in a short-term sideways phase.
Overall, after a massive USD 915 (+35.4%) surge in just four and a half months, the gold price has likely entered a healthy and necessary consolidation. A larger top formation, including a multi-month correction, is conceivable. However, silver has not yet shown independent momentum, suggesting only a minor intermediate high in gold for now. Nonetheless, consolidation or correction above USD 3,000 could extend over time.
A decline significantly below USD 3,000 would likely require renewed stock market turmoil or liquidity shortages, which currently seem unlikely. Rather, a stock market recovery could potentially lift silver as well.
2. Chart Analysis – Gold in US-Dollar
2.1 Weekly chart: Long-Term Uptrend Intact
 Gold in US Dollars, Weekly Chart as of April 29th, 2025. Source: Tradingview
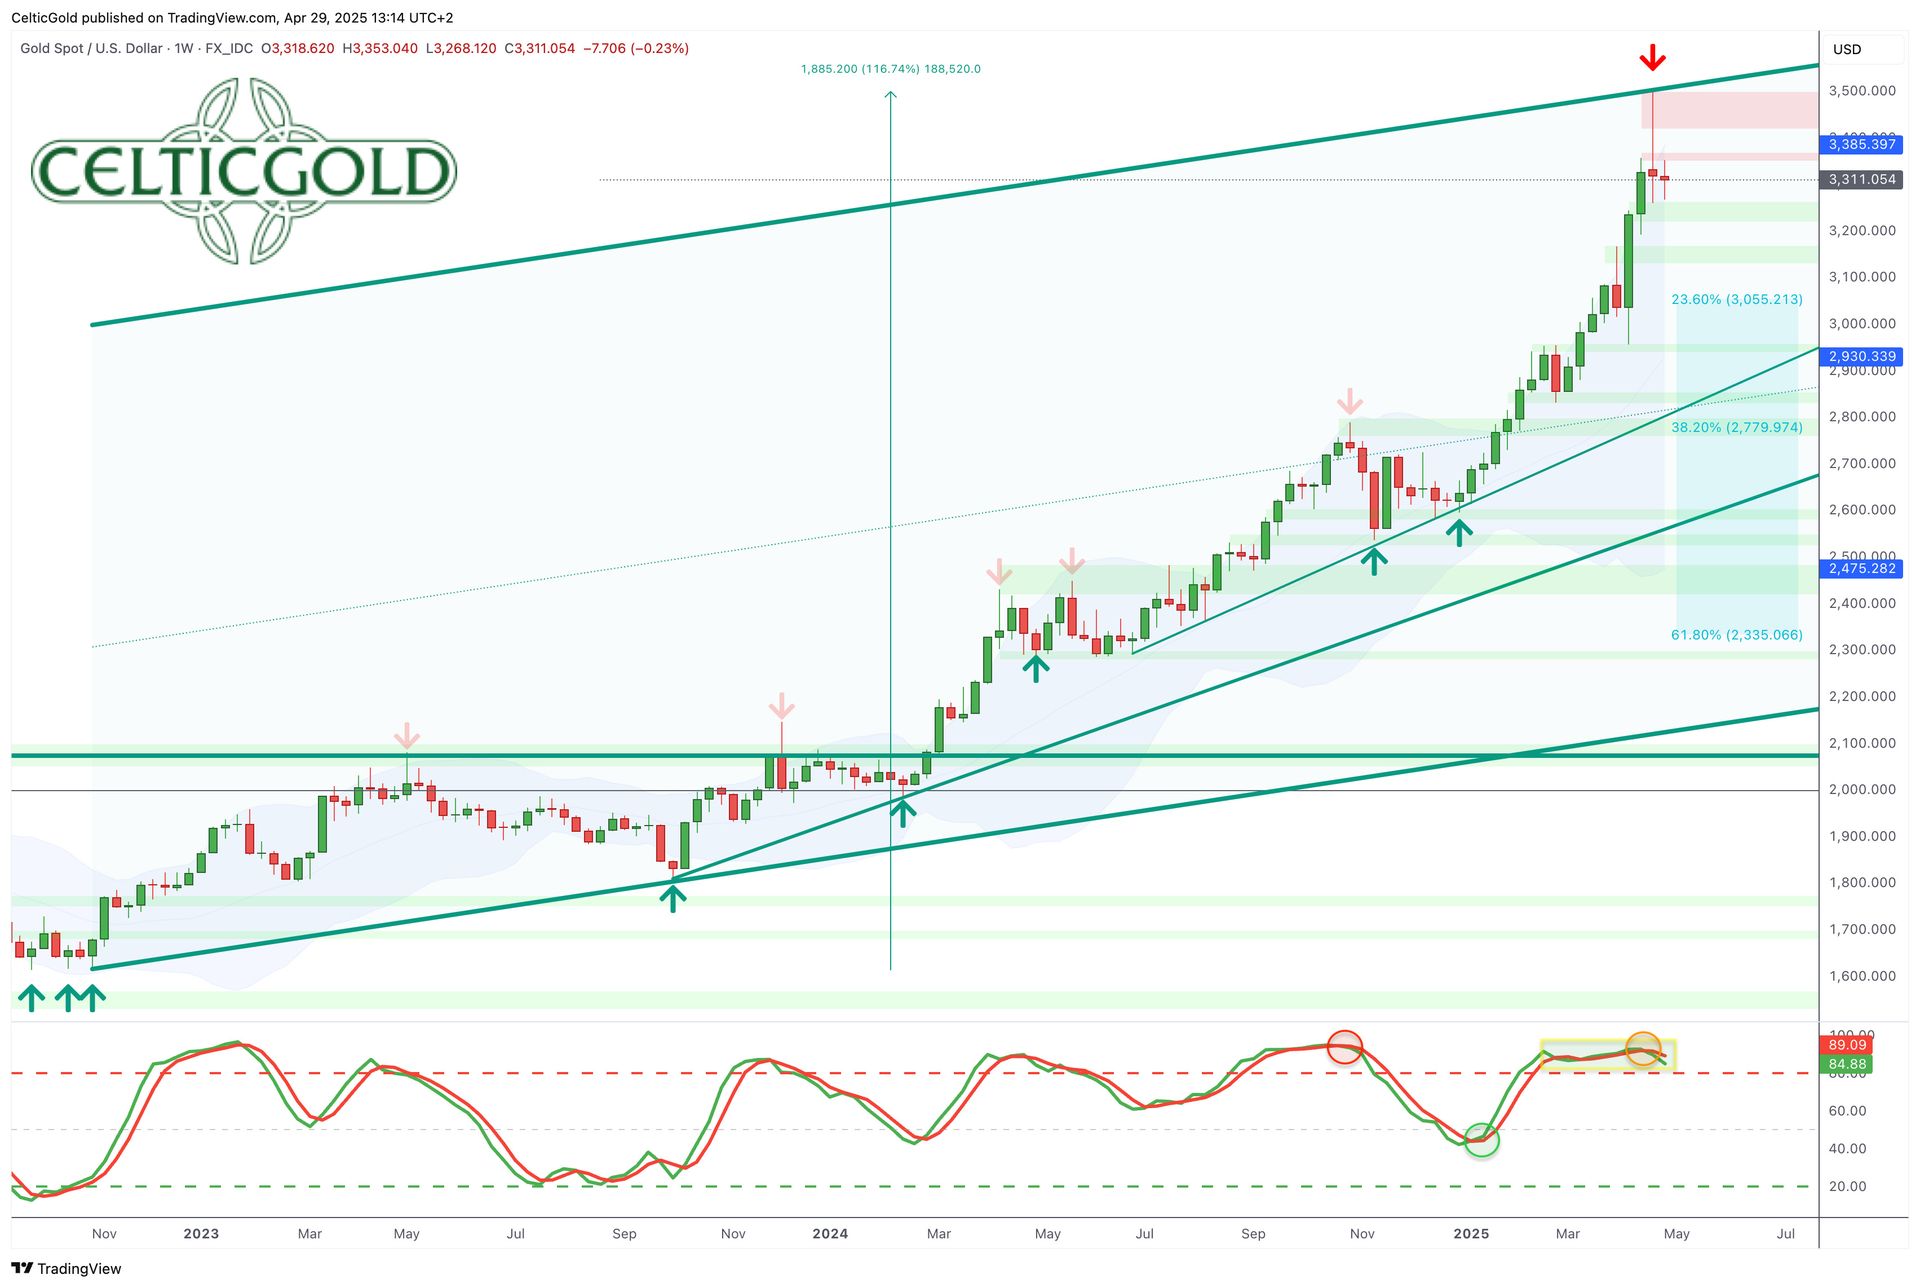
The weekly chart shows gold firmly in a strong, long-term uptrend. The new all-time high at USD 3,500 marks the peak of the rally that began with a triple bottom at USD 1,615 in autumn 2022. The breakout above USD 2,075 in February 2024 gradually accelerated this rally, recently taking on near-vertical momentum.
The price explosions in the last three weeks appeared exaggerated. Unsurprisingly, reaching the psychological USD 3,500 mark triggered a sharp pullback to USD 3,260. Since then, profit-taking has kept bulls below USD 3,370, while bears have made no progress on the downside.
The long upper wick of the prior week’s candle suggests short-term exaggeration and a potential reversal. The bullishly embedded weekly stochastic oscillator remains somewhat steady, but momentum is waning. Losing this embedded state could lead to a multi-week correction, potentially driving the stochastic into oversold territory.
Overall, the weekly chart remains bullish as the stochastic is still bullishly embedded, securing the uptrend until this condition is lost. Both stochastic signal lines have turned downward, and a clear sell signal is not far off. We expect the ongoing pullback to push gold toward USD 3,050 - 3,175. However, the long-term uptrend remains intact as long as the critical support zone of USD 2,955 - 3,050 holds.
A clear rise above USD 3,370 would defuse the unfavourable setup, likely extending the rally toward new all-time highs soon.
2.2 Daily chart: Sideways Consolidation at High Levels
 Gold in US Dollars, Daily Chart as of April 29, 2025. Source: Tradingview
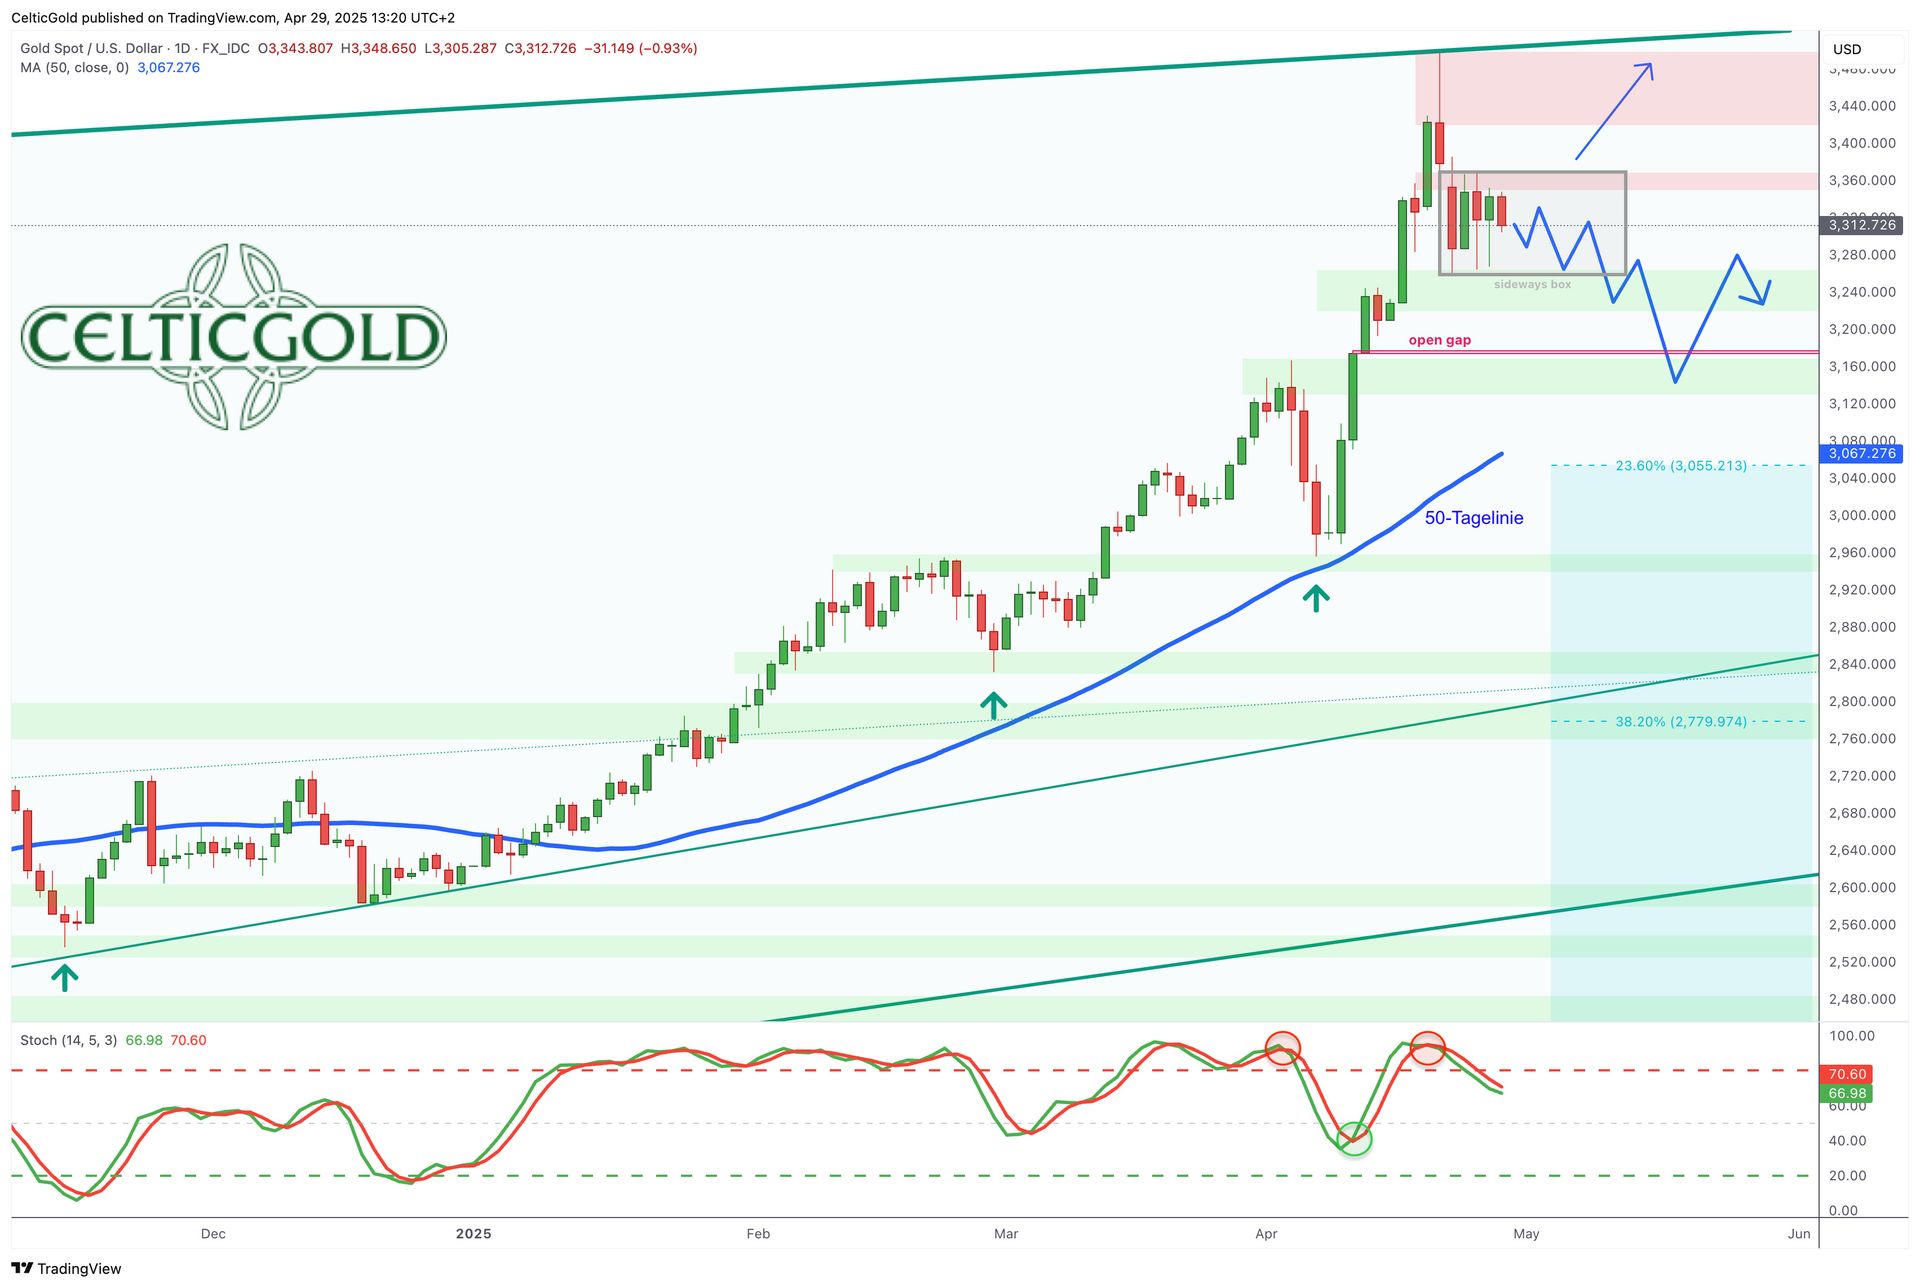
On the daily chart, gold had moved far above its rapidly rising 50-day line (USD 3,067) and surged almost vertically. The sharp reversal at USD 3,500 followed, with recent candlestick patterns indicating a potential top formation.
Bears need a break below USD 3,260 for confirmation. So far, bulls have managed three notable recoveries above USD 3,300 and USD 3,330. Thus, the market has been in a tricky sideways phase at high levels for about a week.
If the stochastic oscillator’s sell signal develops further, renewed selling pressure and new lows should follow soon. Beyond the rising 50-day line (USD 3,067), the open price gap around USD 3,175 is the next logical target.
Overall, the daily chart presents a bearish picture, but the high-level sideways movement keeps the possibility of resuming the steep rally alive. The USD 3,260–3,370 zone is neutral. Above USD 3,370, bulls would prevail, accelerating the rally toward USD 4,000. Below USD 3,260, the correction scenario would be confirmed, likely targeting the USD 3,175 gap swiftly.
3. Commitment of Trades (CoT): Gold
 Commitments of Traders Report for Gold Futures as of April 28, 2025. Source: Sentimentrader
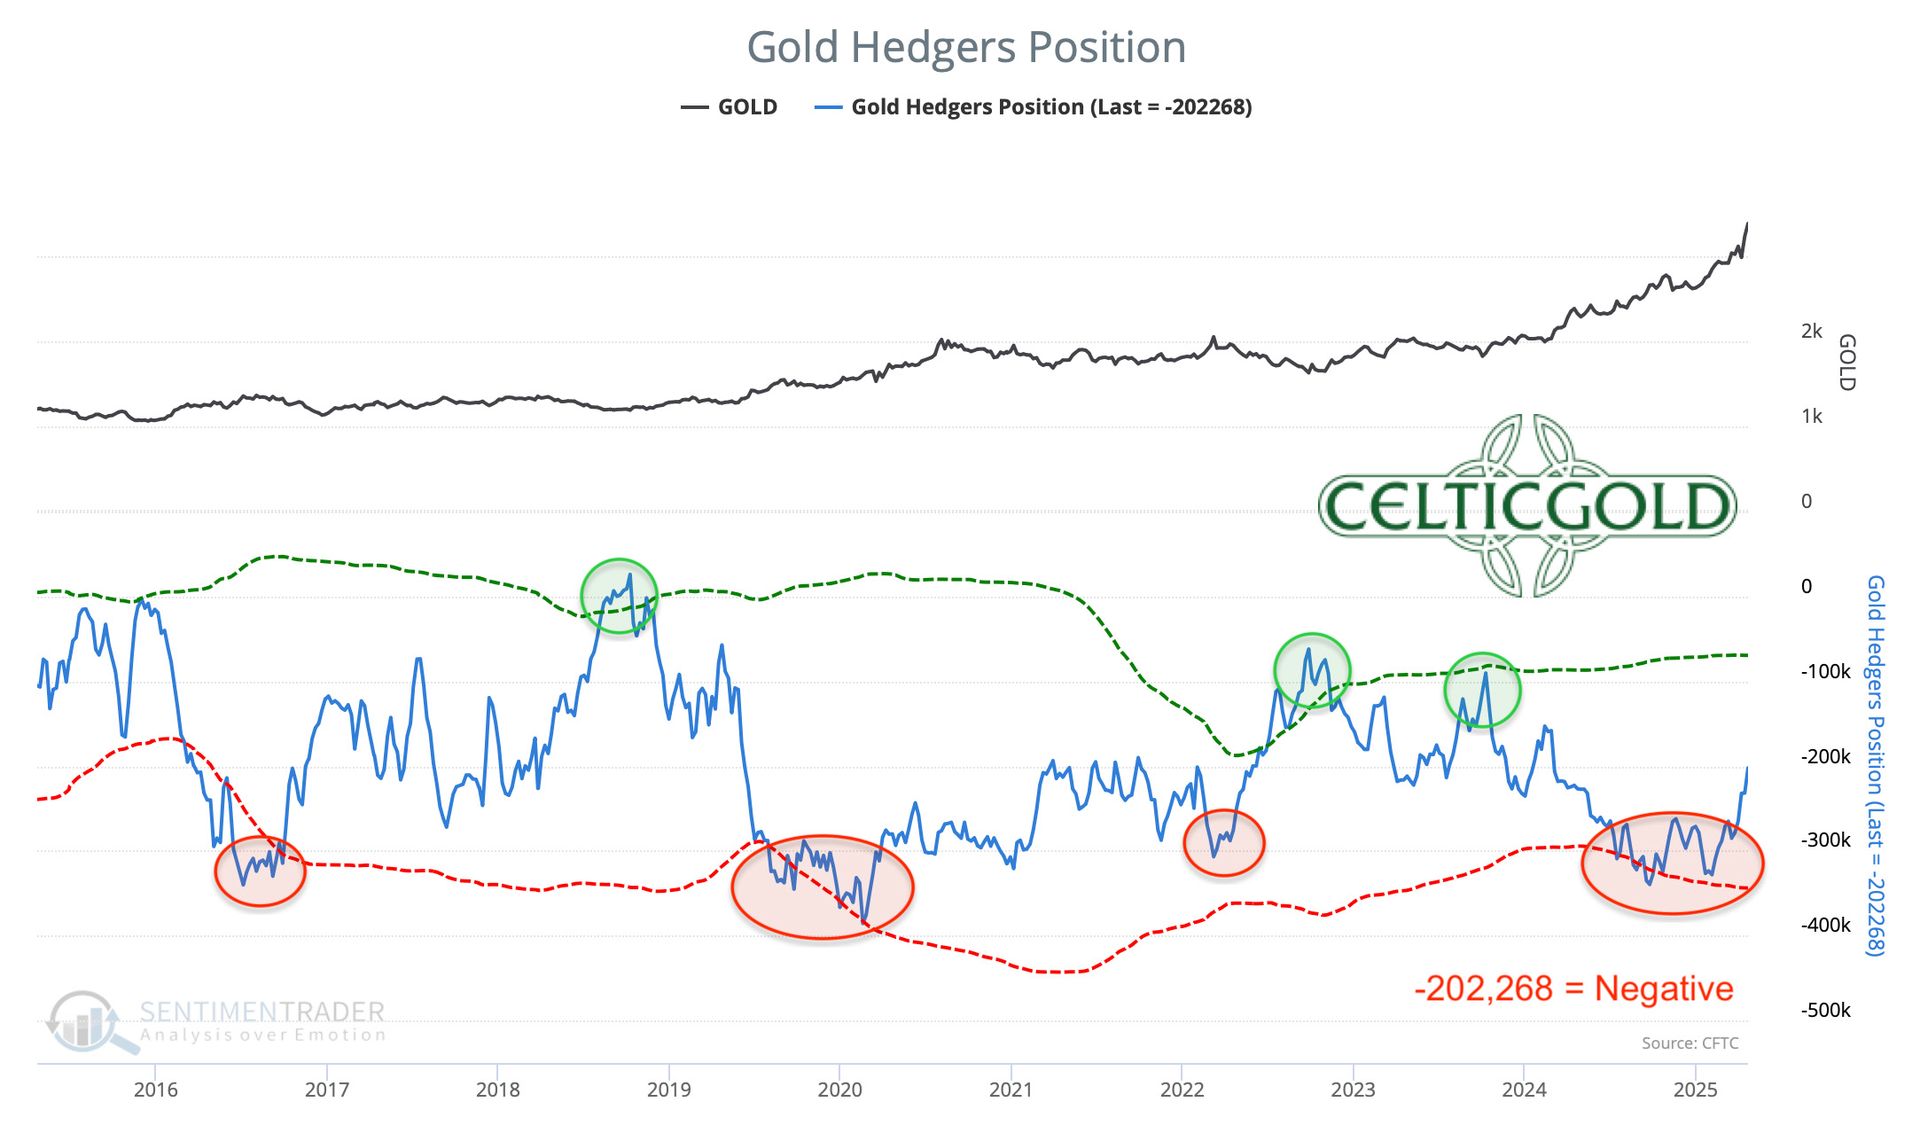
At a closing price of approximately USD 3,380, commercial traders held a cumulative short position of 202,268 gold futures contracts on Tuesday, April 22. Following the breakout above USD 3,000, professionals evidently closed or were forced to reduce their short positions. The current short position is nearly 100,000 contracts lower than two months ago, when gold traded around USD 2,900, about USD 400 lower.
Meanwhile, open interest in gold futures has been volatile over the past two months. After a strong rise in March, April saw a sharp decline, followed by a slight increase of 8,723 contracts to 465,351 last week.
In summary, the CoT report remains negative based on the past 20 years. Both bulls and bears appear to have used the steep rally to reduce their futures market positions. Notably, commercial traders closed a third of their short positions into rising prices, engaging in deleveraging.
4. Sentiment: Gold
 Sentiment Optix for Gold as of April 28, 2025. Source: Sentimentrader
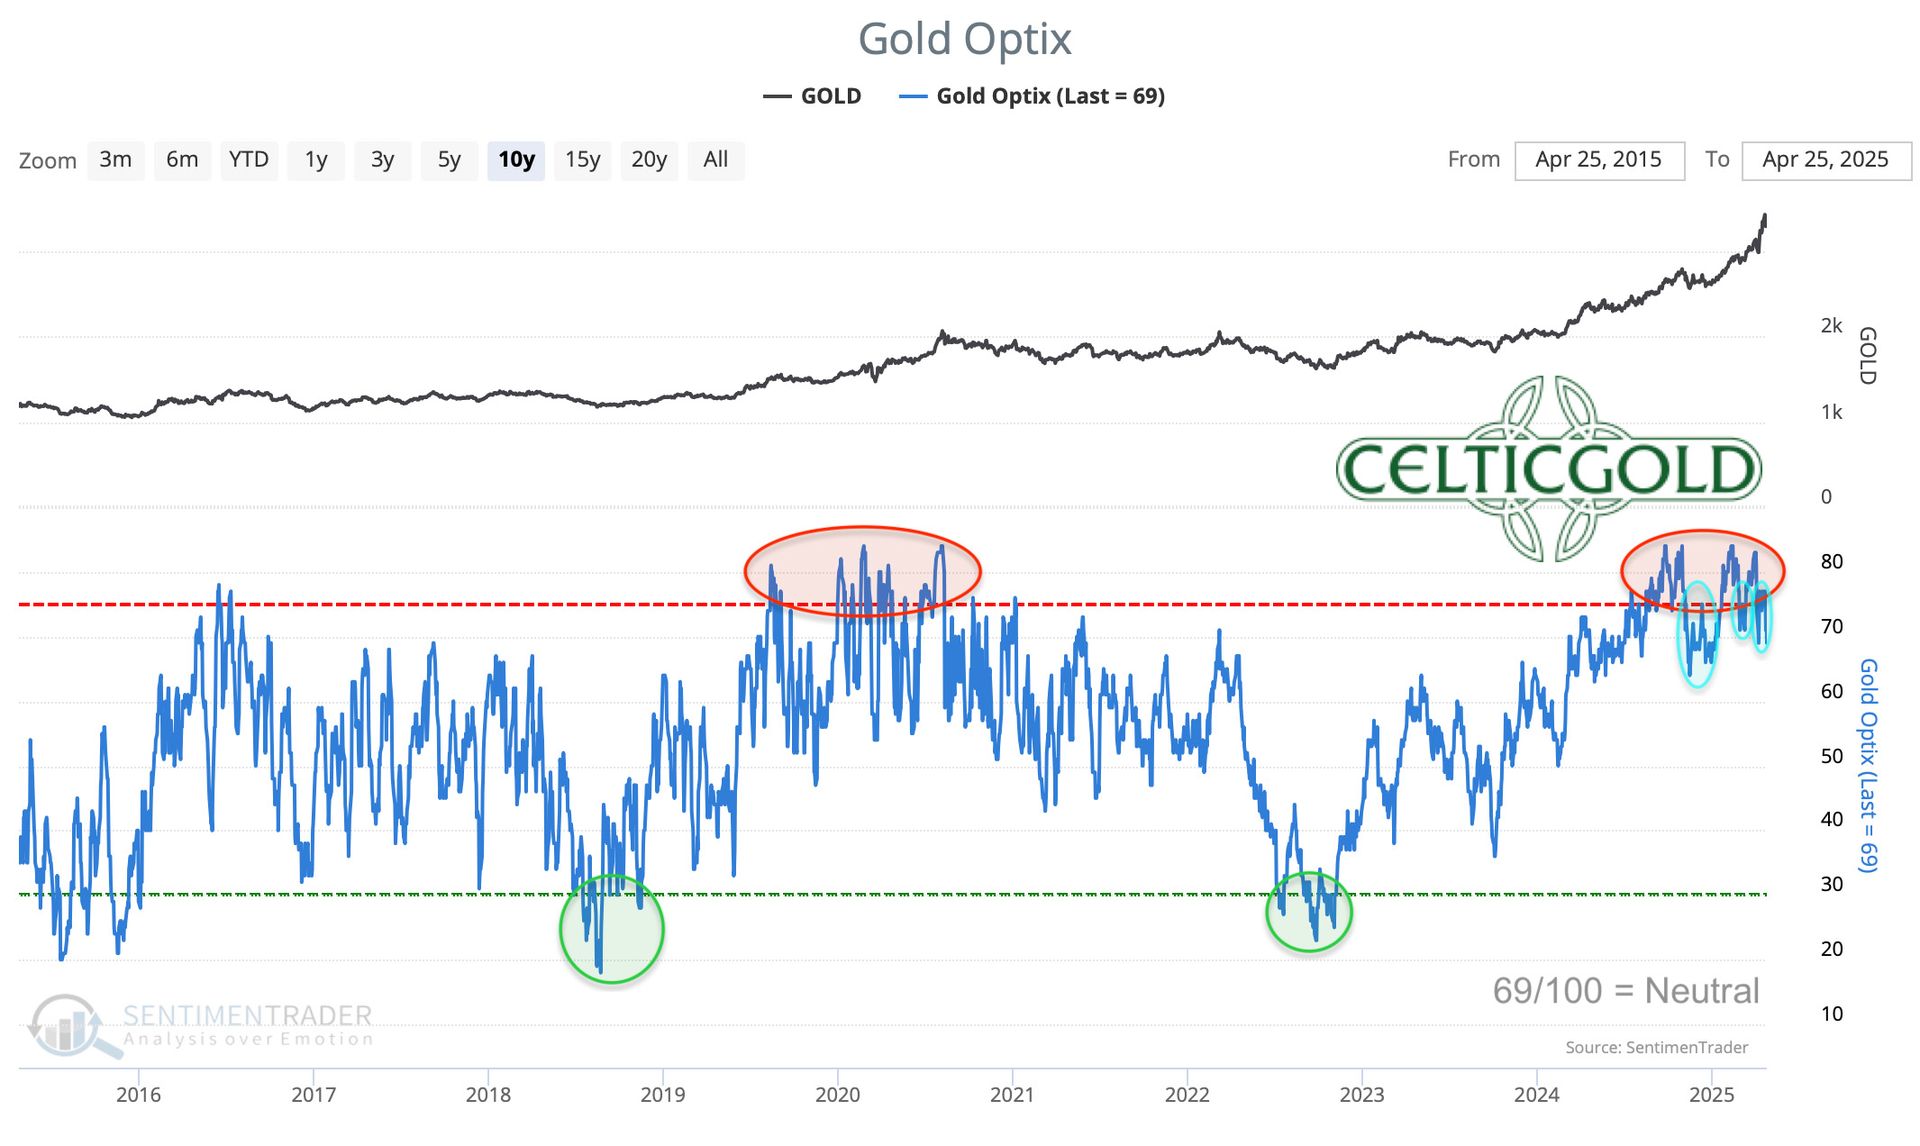
Since mid-September 2024, gold market sentiment has repeatedly reached excessive optimism. Unlike typical overheated scenarios, we did not expect a sentiment reversal into panic. Instead, our “cold shower” thesis was confirmed: sharp but brief price drops fostered skepticism, cooling sentiment healthily without triggering destabilising overreactions. This pattern has lent remarkable resilience to the gold market, with overheated conditions self-correcting regularly.
Following the sharp pullback from USD 3,500, the Gold Optix has retreated from the extreme zone, reporting a relatively neutral sentiment at 69. A further drop below 50–60 could signal a larger correction.
In total, optimism in the gold market has cooled significantly, no longer obstructing the rally’s continuation.
5. Seasonality: Gold
 Seasonality for Gold Prices Over the Last 15 Years as of April 28, 2024. Source: Seasonax
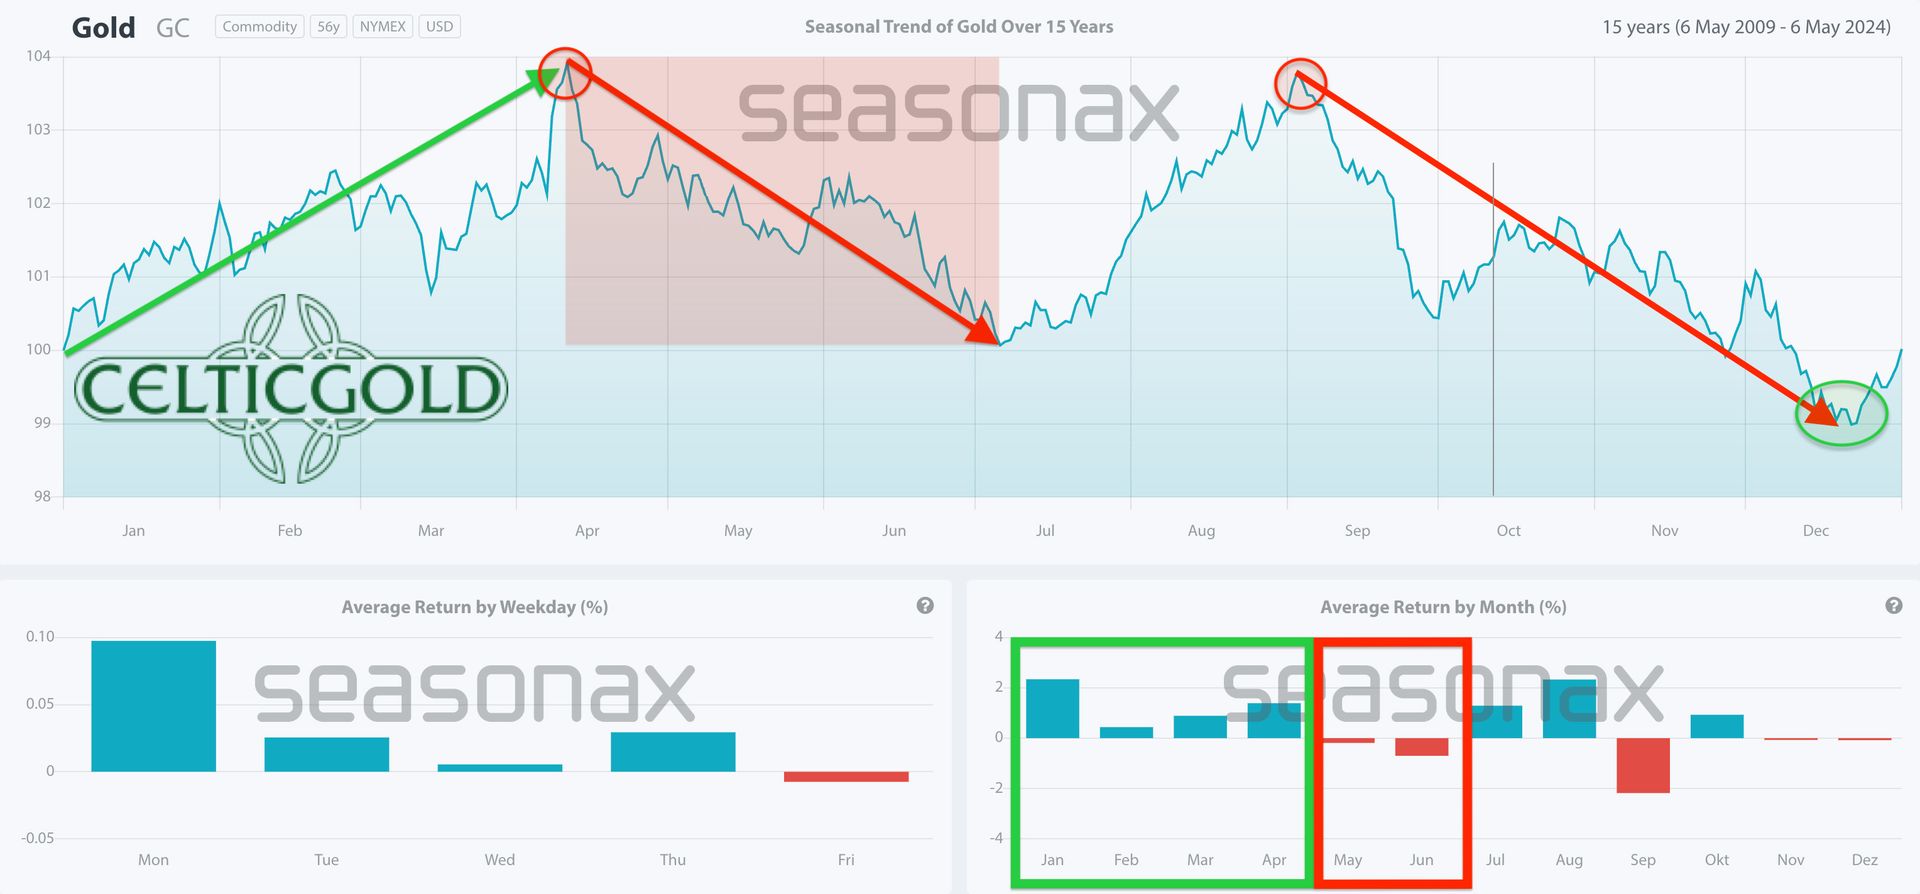
Historically, late April 2025 marks a phase of seasonal strength for gold. Significant highs have often occurred between March and mid-May. The new all-time high at USD 3,500 on 22nd April fits this window well. Over the next two months, until mid-June or early July, declining or consolidating gold prices are likely.
However, this argument lacks the typical late-stage silver rally. Gold could consolidate sideways while silver rises alongside stock markets, but both precious metals typically move in tandem.
Overall, favourable seasonality ends by mid-May, suggesting a correction until mid-to-late June.
6. Macro Update – Gold Rush in China
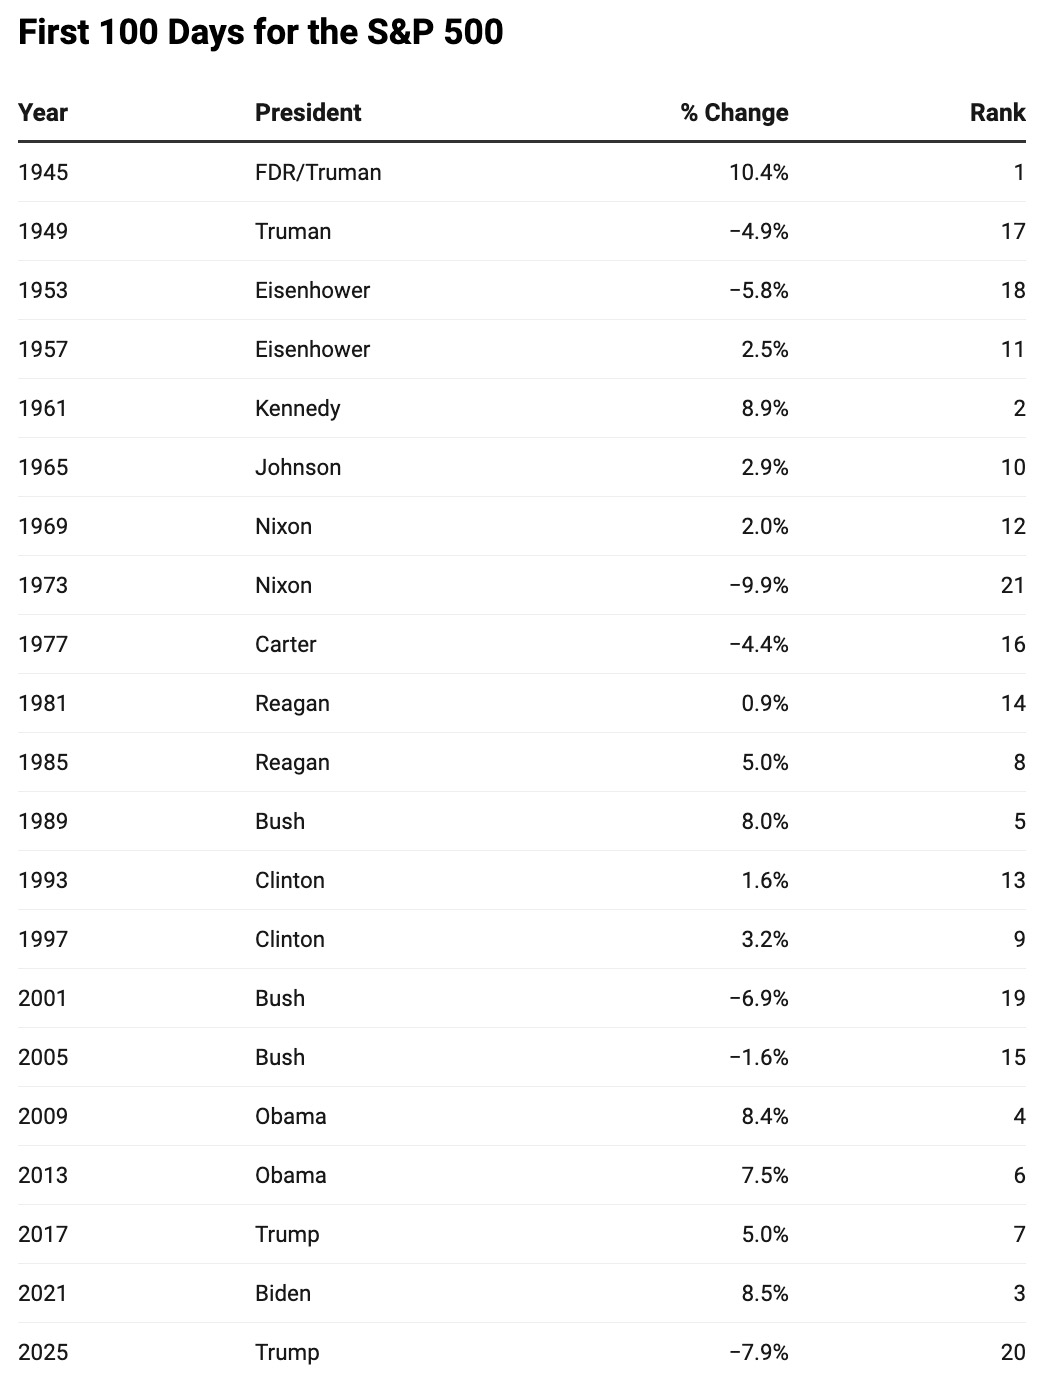
The First 100 Days for the S&P 500 Under a New US President. Source: Holger Zschaepitz
In the first 100 days of President Trump’s new administration, the US stock market experienced its steepest decline since Nixon’s inauguration in 1973, raising global concerns. The VIX volatility index spiked above 60, a level seen only five times in 35 years, signaling high uncertainty and structural exhaustion in macro, political, and liquidity systems. A VIX of 60 reflects liquidity asymmetry triggered by macroeconomic divergences, derivatives cascades, and volatile politics, causing risk models to fail and liquidity to vanish temporarily.
Buy When Fear Is Greatest
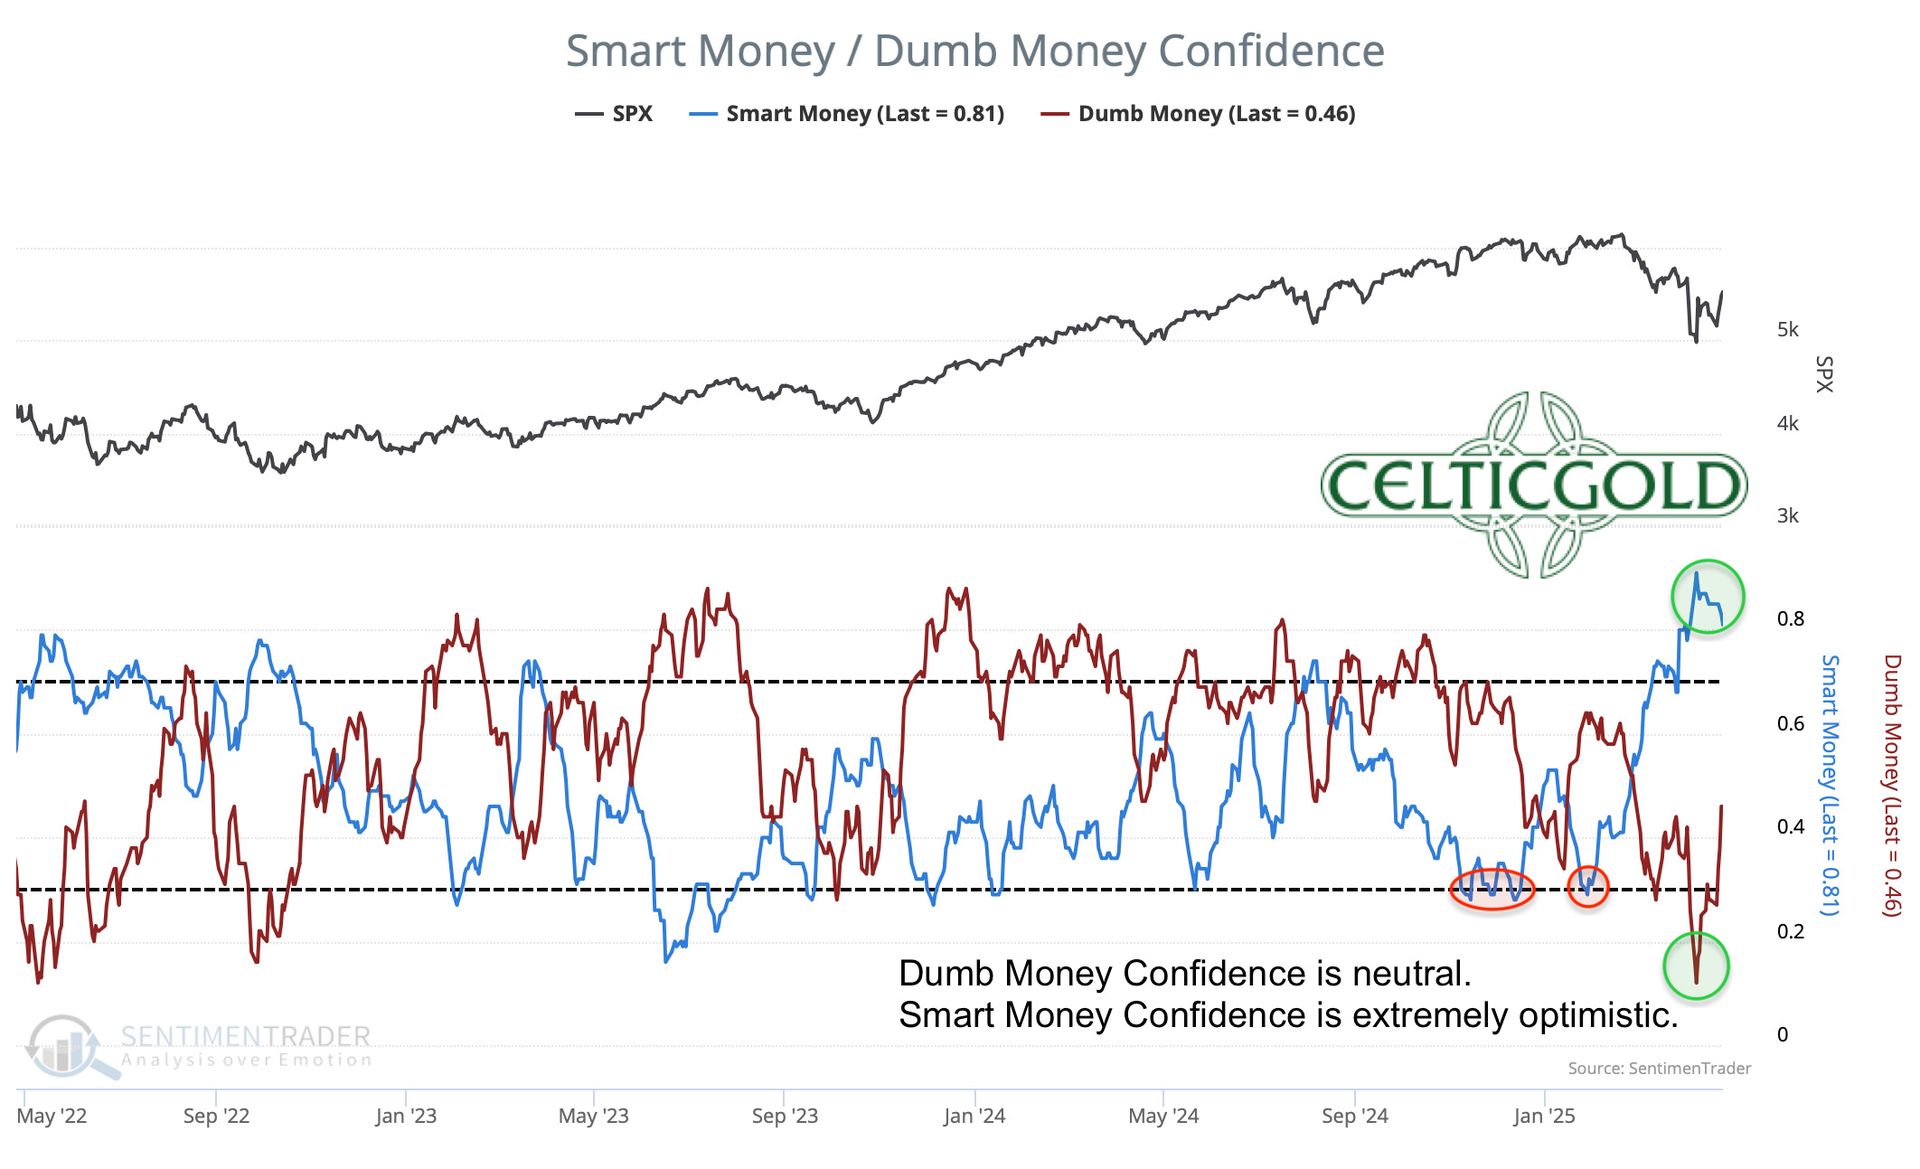
Smart Money vs. Dumb Money Confidence as of April 28, 2025. Source: Sentimentrader
Historically, markets recover significantly within six to twelve months after such extreme fear spikes, as seen in 2008, 2020, and 2023, following narrative overcorrections and liquidity restoration. Current instability has prompted stabilizing measures from Trump, the ECB, and China, including ECB rate cuts, Chinese stimulus, and Trump softening his China tariff stance. Deep pessimism now suggests a strong, broad market recovery is likely.
Short-Term Pain for Long-Term Gain
Successful trading lies in anticipating capital reallocation: capital first seeks safety (bonds, megacaps), then narrative assets (gold, Bitcoin, AI). This reflects capital mechanism reactivation when systemic fear becomes tradable. The dramatic interpretation of recent events may be overstated. The Trump administration is boldly tackling entrenched economic challenges unconventionally, aiming for sustainable growth through structural reforms despite short-term volatility. The motto is: “Short-term pain for long-term gain”.
China’s Long Struggle with the US
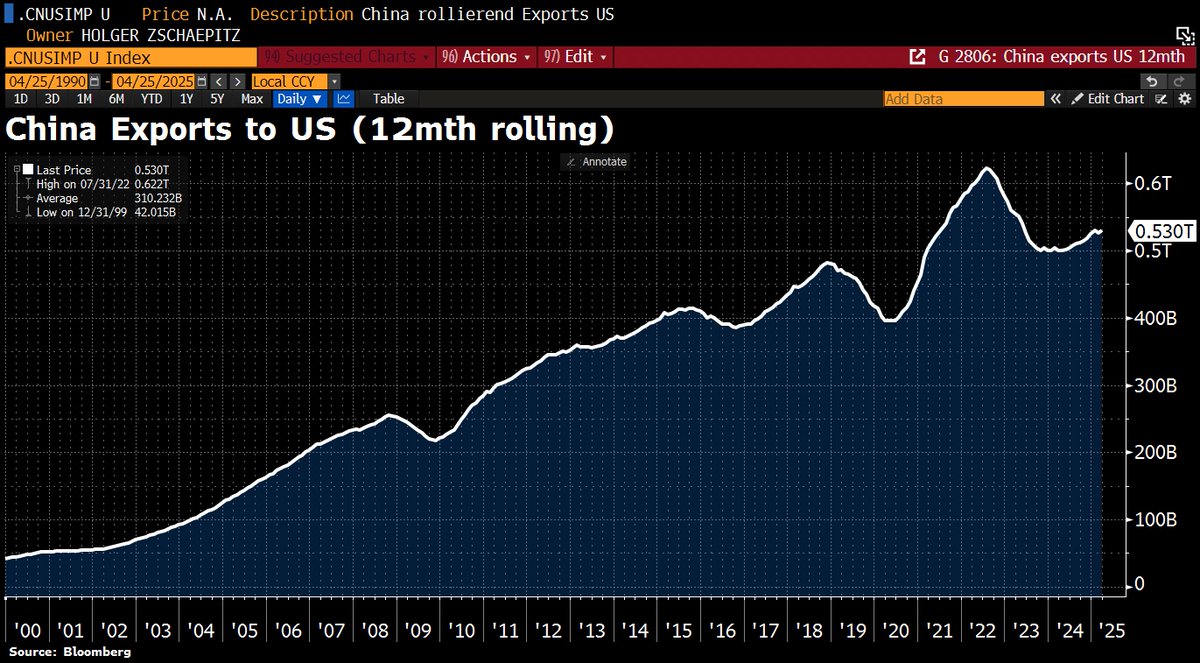
Chinese Exports to the US. Source: Holger Zschaepitz
China has been increasing its pain tolerance for years in its long-term rivalry with the US. Unlike Western democracies reliant on short-term electoral success, China’s authoritarian regime can endure short-term economic or social strain due to limited electoral pressure. To achieve technological autonomy and global leadership, China relies on central planning, state intervention, and political control.
Citing Mao’s legacy, Chinese leadership emphasizes readiness for prolonged confrontation with the US, contrasting the Communist Party’s entrenched rule with US electoral volatility. Since the first Trump administration’s trade disputes, Xi Jinping has strengthened authoritarian systems, expanding censorship and surveillance to prepare for US economic challenges.
Xi’s centralized power, bolstered by abolished term limits and prioritized propaganda and security, ensures stability. Despite export reliance, China’s economy is supported by a robust “stability maintenance” apparatus, including AI-driven surveillance and a USD 209 billion internal security budget in 2023. Refined during Covid-19 lockdowns and 2022 protests, this system suppresses dissent and mitigates tariff impacts through fiscal stimuli and subsidies.
Significant tariff disruptions could strain China’s social fabric, particularly among workers, but sophisticated control mechanisms, including AI-powered predictive policing and community surveillance, prevent unrest. Only an internal leadership split, as in 1989, could destabilize the regime, but Xi’s consolidated power appears unassailable.
Gold Trading in China Explodes
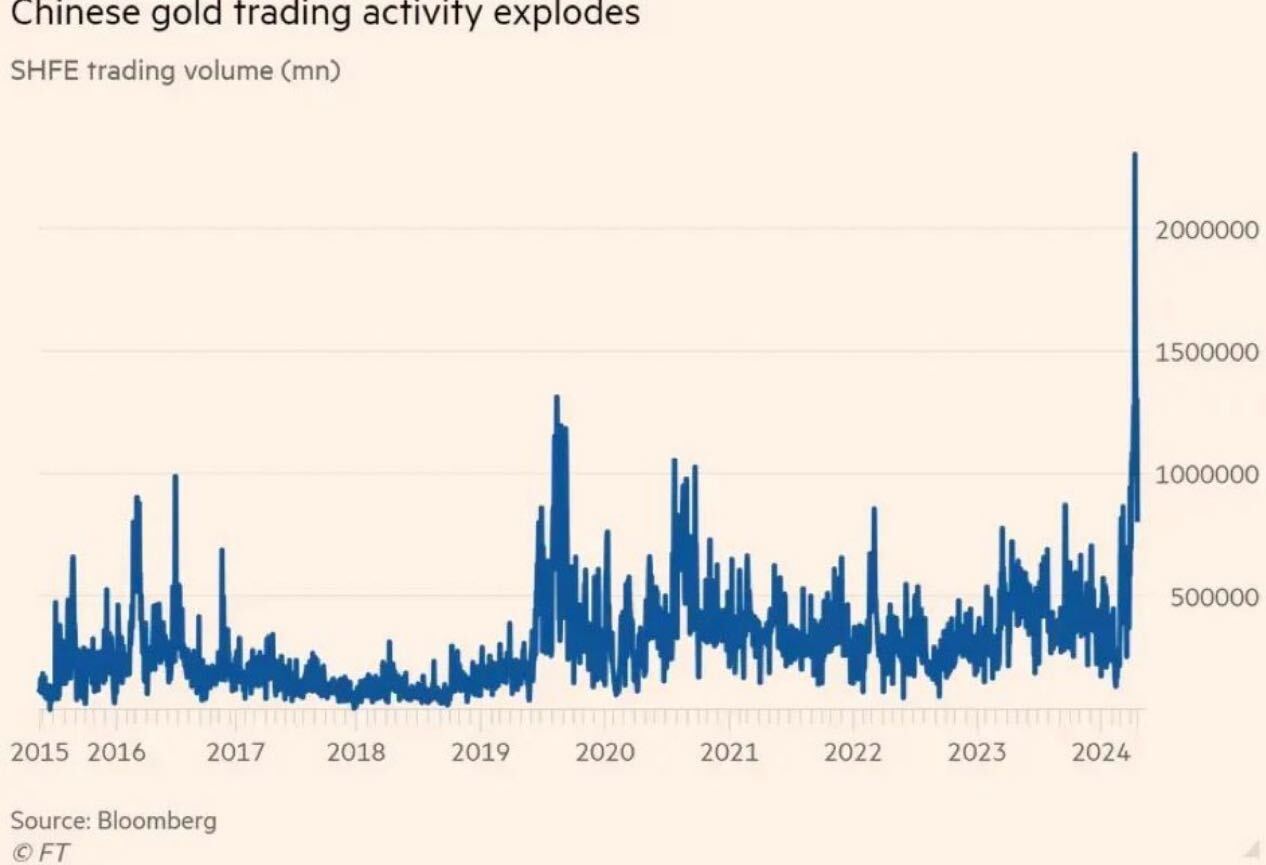
Gold Trading in China Explodes. Source: Bloomberg
Unsurprisingly, Chinese citizens are buying more gold. With Bitcoin banned, collapsed real estate markets, and strict capital controls, gold is the primary liquid store of value, fueling a gold rush in China.
This rush has gained momentum, driven by economic uncertainty, geopolitical tensions, and rising inflation. The growing middle class and loose monetary policy from the People’s Bank of China have boosted gold consumption in jewelry, bars, and investments. The government also promotes gold purchases to diversify currency reserves.

Gold Trading in Shuibei as of April 28, 2025. Source: Bai, Xiaojun
In Shuibei, a key gold trading hub, nearly 12,000 gold shops serve 100,000 daily customers, trading about 1,100 kg of gold. Some 36,000 gold products are sold daily, sourced from South Africa, Russian miners, and the Shanghai Gold Exchange. Despite short-term price peaks, China’s gold rush is likely to persist medium-term.
Contrarian Opportunities Amid Global Market Upheaval
Despite expected short- to medium-term stock market recovery, global financial markets face structural challenges: demographic shifts, AI, and the economic power shift to Asia require strategic realignment. The Trump administration emphasizes protectionism, while China and India expand globally.
Investors must prepare for a decade of upheaval, where flexibility and diversification are key. Precious metals will remain a bedrock, essential portfolio components. Current uncertainties also offer countercyclical opportunities, particularly in undervalued inflation-resistant energy assets (oil and gas). Narrative assets like AI and Bitcoin will likely stay in demand, and greater geographic diversification into emerging markets is advisable.
7. Conclusion: Gold – Taking a Breather Amid the Gold Rush
Since its low of USD 2,585 on 18th December 2024, the gold price has surged USD 915 (+35.4%) in just four and a half months. Following the new all-time high at USD 3,500, the gold market has been consolidating in a sideways range between USD 3,260 and USD 3,370 for about a week.
Chart-wise, the long-term uptrend remains intact as long as the USD 2,955–3,050 support zone holds. A multi-month correction is possible, but the absence of a typical silver sprint prevents a definitive call of an intermediate gold high.
A deeper low below USD 3,260 would provide clarity, confirming a trend reversal and likely triggering a larger pullback to USD 3,050–3,125. Conversely, a breakout above USD 3,370 would signal the gold rush continuing unabated, with new all-time highs possible in May and annual targets of USD 4,000+ realistic.
About the Author: Florian Grummes
Florian Grummes is an independent financial analyst, advisor, consultant, mentor, trader & investor as well as an international speaker with more than 30 years of experience in financial markets.
Florian is the founder and managing director of his company Midas Touch Consulting, which is specialised in trading & investments as well as consulting, analysis & research with a focus on precious metals, commodities and digital assets.
Via Midas Touch Consulting he is publishing daily and weekly gold, silver, bitcoin & cryptocurrency analysis for his numerous international readers. Florian is well known for combining technical, fundamental/macro and sentiment analysis into one often accurate conclusion about the markets.