Over the past few days, the gold market has experienced significant volatility and a notable decline as well as a sharp recovery in prices. Following a gradual decline in price fluctuations since mid-April, volatility has increased significantly again in recent days. Gold – Only a short-lived pullback after speculative spike.
1. Review
After a sluggish start to the trading year 2024, gold ended its consolidation phase in mid-February and transitioned into a strong trending phase. Initially, this led to a sustainable breakout above the multi-year resistance zone around USD 2,075. Consequently, gold prices surged further to USD 2,430 within just two months. However, the gold rally abruptly ended on 12th April with a significant price drop late on Friday afternoon. Despite further attempts, the bulls could not reclaim the USD 2,400 mark in the following week.
Instead, a tricky consolidation between approximately USD 2,300 and USD 2,400 began at a high level. Simultaneously, solid support around USD 2,280 to USD 2,300 was defended. Eventually, on Whit Monday, about five weeks later, gold temporarily broke out to a new all-time high of USD 2,450, only to quickly fall back into the sideways trading range. During this period, the support around USD 2,300 was breached several times without a sustainable downward breakthrough.
1.1 Assassination Attempt on Trump Causes a Short-Lived Spike in the Gold Market
Overall, the chart pattern gradually deteriorated as reversal signals steadily increased. On 26th June, gold fell below the psychological support at USD 2,300 once again. However, new buyers quickly entered the market, and the breach turned out to be a false signal (bull trap). Encouraged by this, gold prices surged again from the end of June to 17th July.
The failed assassination attempt on Donald Trump caused a spectacular spike to a new all-time high of USD 2,483. The joy over this new all-time high was short-lived, though, as gold made a sharp reversal and plummeted by about USD 130 to USD 2,353 within the following seven days. This brought prices back into the tough sideways range that had formed since mid-April. At the same time, an ugly reversal candle or “blow-off top” appeared on the weekly chart.
Just a week later, however, gold is back above USD 2,450 trying to reach the new all-time-high at USD 2,483. This resilient behaviour is impressive and can be observed from mid-April. Like a “Stehaufmännchen”, gold is able to bounce back from any pullbacks or failures. The term “Stehaufmännchen” is German and is derived from a type of toy that always rights itself when knocked over, symbolising the ability to recover from difficulties.
1.2 Relative Strength in Silver Was a Clear Warning Signal
Silver on the other hand, has not been following gold in recent weeks to new highs. While silver prices showed relative strength against gold in May, it recently failed to reach a new high. Instead, the annual high of USD 32.52 from 20th May was clearly missed, and a new two-and-a-half-month low of USD 27.29 was reached this Monday. Thus, silver’s relative strength in May turned out to be a clear warning signal, as suspected. The rally that began in early October 2023 is likely over, and, together with the correction in the stock-markets, silver might enter a healthy correction in the coming weeks and two to three months.
1.3 Harris’s Candidacy Heats Up the US Election Campaign and Fuels Uncertainty
Simultaneously, recent political developments in the USA have led to significant disruptions in the financial markets. Initially, the increasing likelihood of another Trump presidency triggered a rotation away from technology towards value stocks. This movement was abruptly stopped when President Biden announced his withdrawal from the election campaign, and Vice President Kamala Harris declared her candidacy. This unexpected turn of events caused great uncertainty among investors, as an intense and possibly prolonged election campaign is now expected until 5th November and possibly beyond.
As a result, nearly all market sectors came under pressure, with technology stocks being particularly affected. On Wednesday 24th July, the Nasdaq 100 recorded its largest drop since October 2022, with a daily loss of 3.7%. Overall, over USD 1.1 trillion in market capitalisation was wiped out from the US stock market in a single trading day last week. Even gold and silver prices were not able to escape this carnage. In the meantime, stock-markets have corrected further following a rather uncertain-looking press conference of the Fed this Wednesday.
Overall it seems as if the typically correction into September and October has started in the financial system. The situation once again highlights the close interconnection between political events and short-term market reactions. Investors must brace themselves for continued high volatility in the coming months, as the election campaign and its potential impacts on economic policy will continue to influence the markets.
2. Chart Analysis – Gold in US-Dollar
2.1 Weekly chart: Stochastic snaps with a renewed buying signal
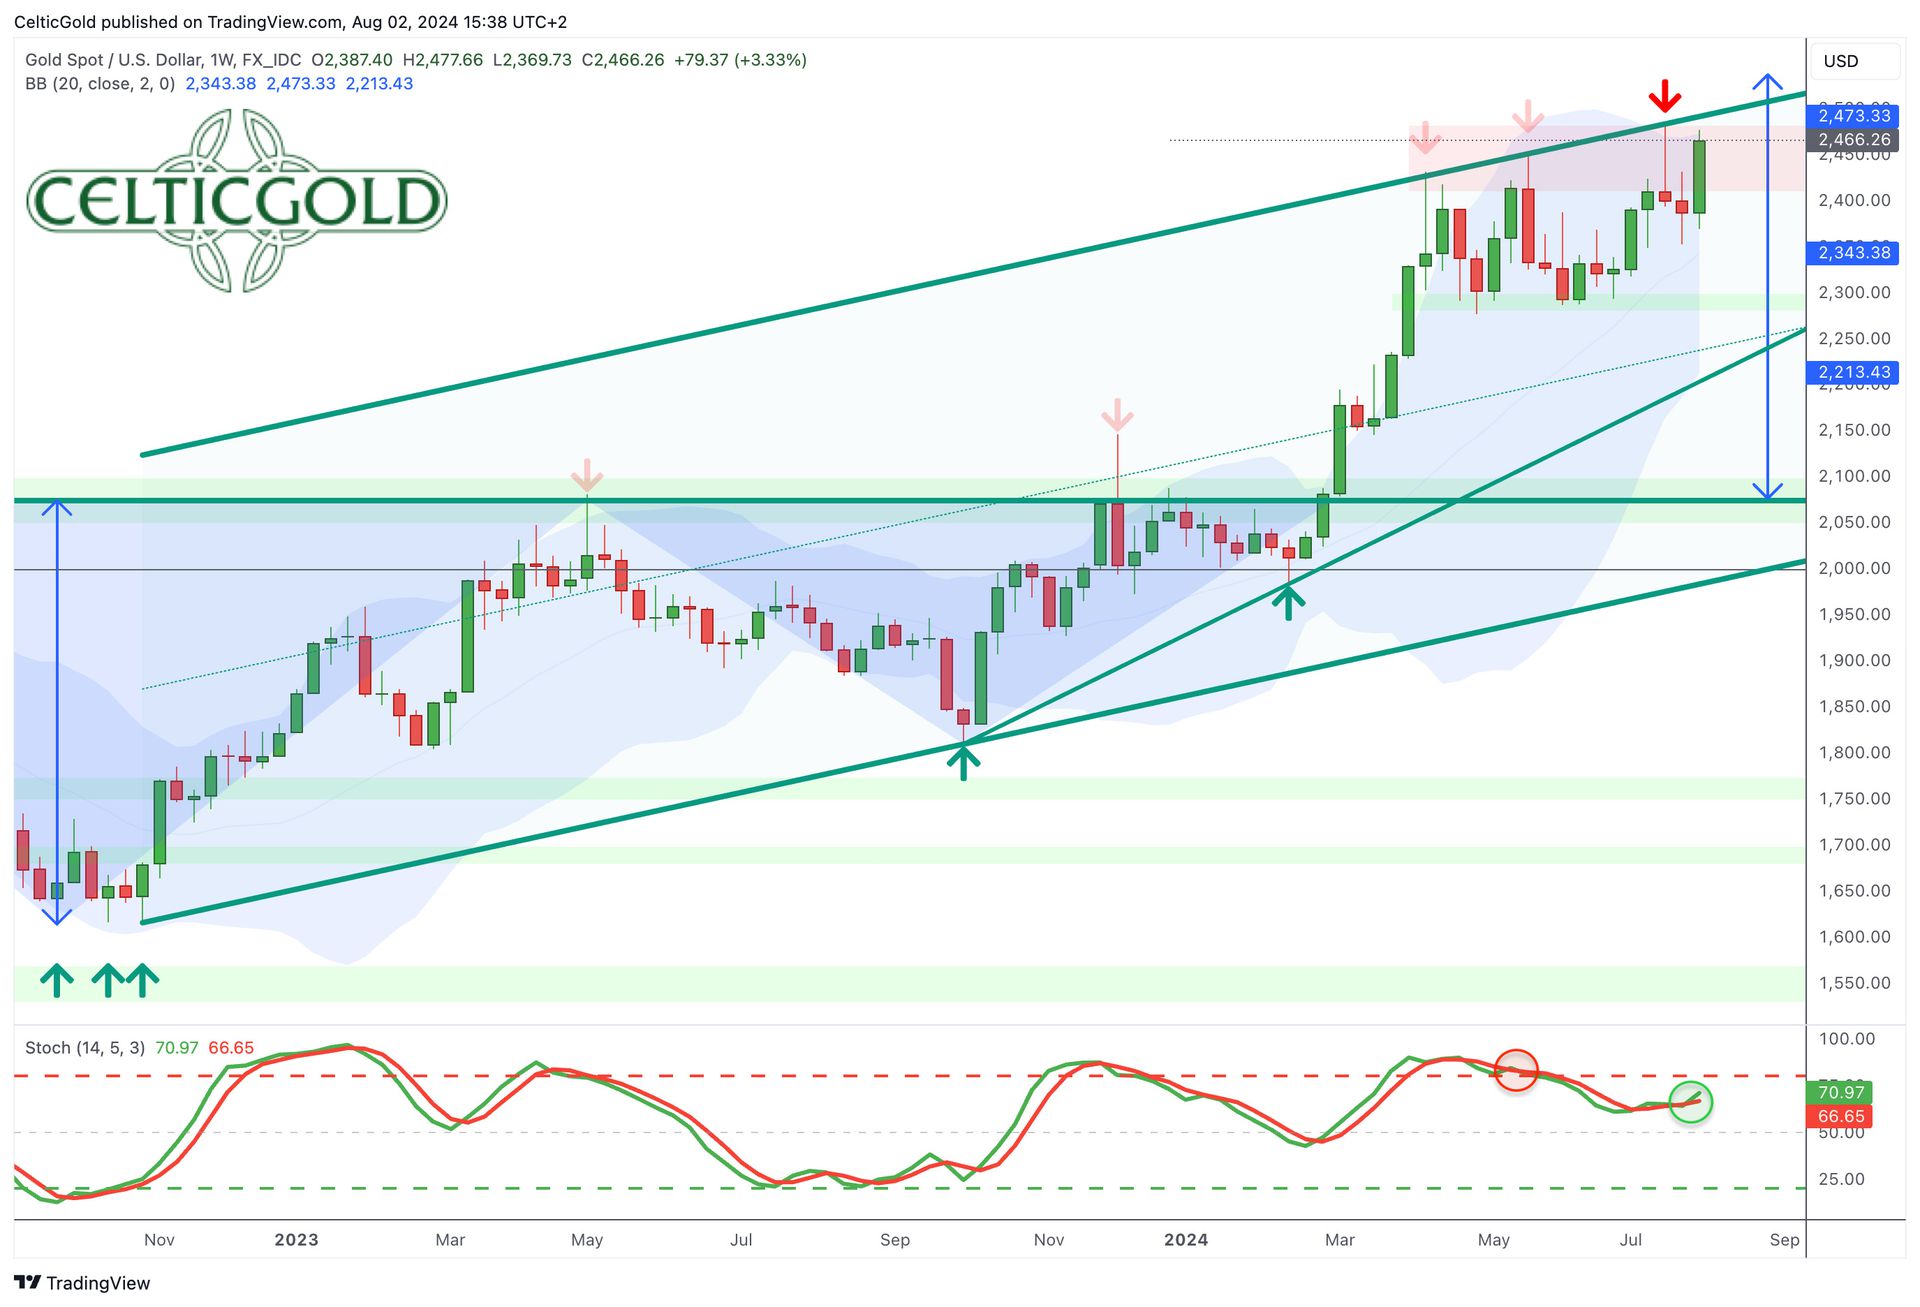
Gold in US-Dollar, weekly chart as of August 2nd, 2024. Source: Tradingview
On the weekly chart, gold had been increasingly consolidating since mid-April. The temporary breakout to the new all-time high of USD 2,483 seemed to be a bull trap last week. This week’s large bullish candle however makes this assumption very questionable. While stock-markets most likely are sliding into a correction, gold is holding up very well so far. But to unleash new momentum gold needs to break through the psychological resistance around USD 2,500. That would also mean to jump out of the uptrend channel of the last 22 months.
Overall, the weekly chart is slightly bullish as the slow stochastic has switched back up. Despite growing negative divergences, the uptrend is still intact.
2.2 Daily chart: Stochastic buy signal has more room to the upside
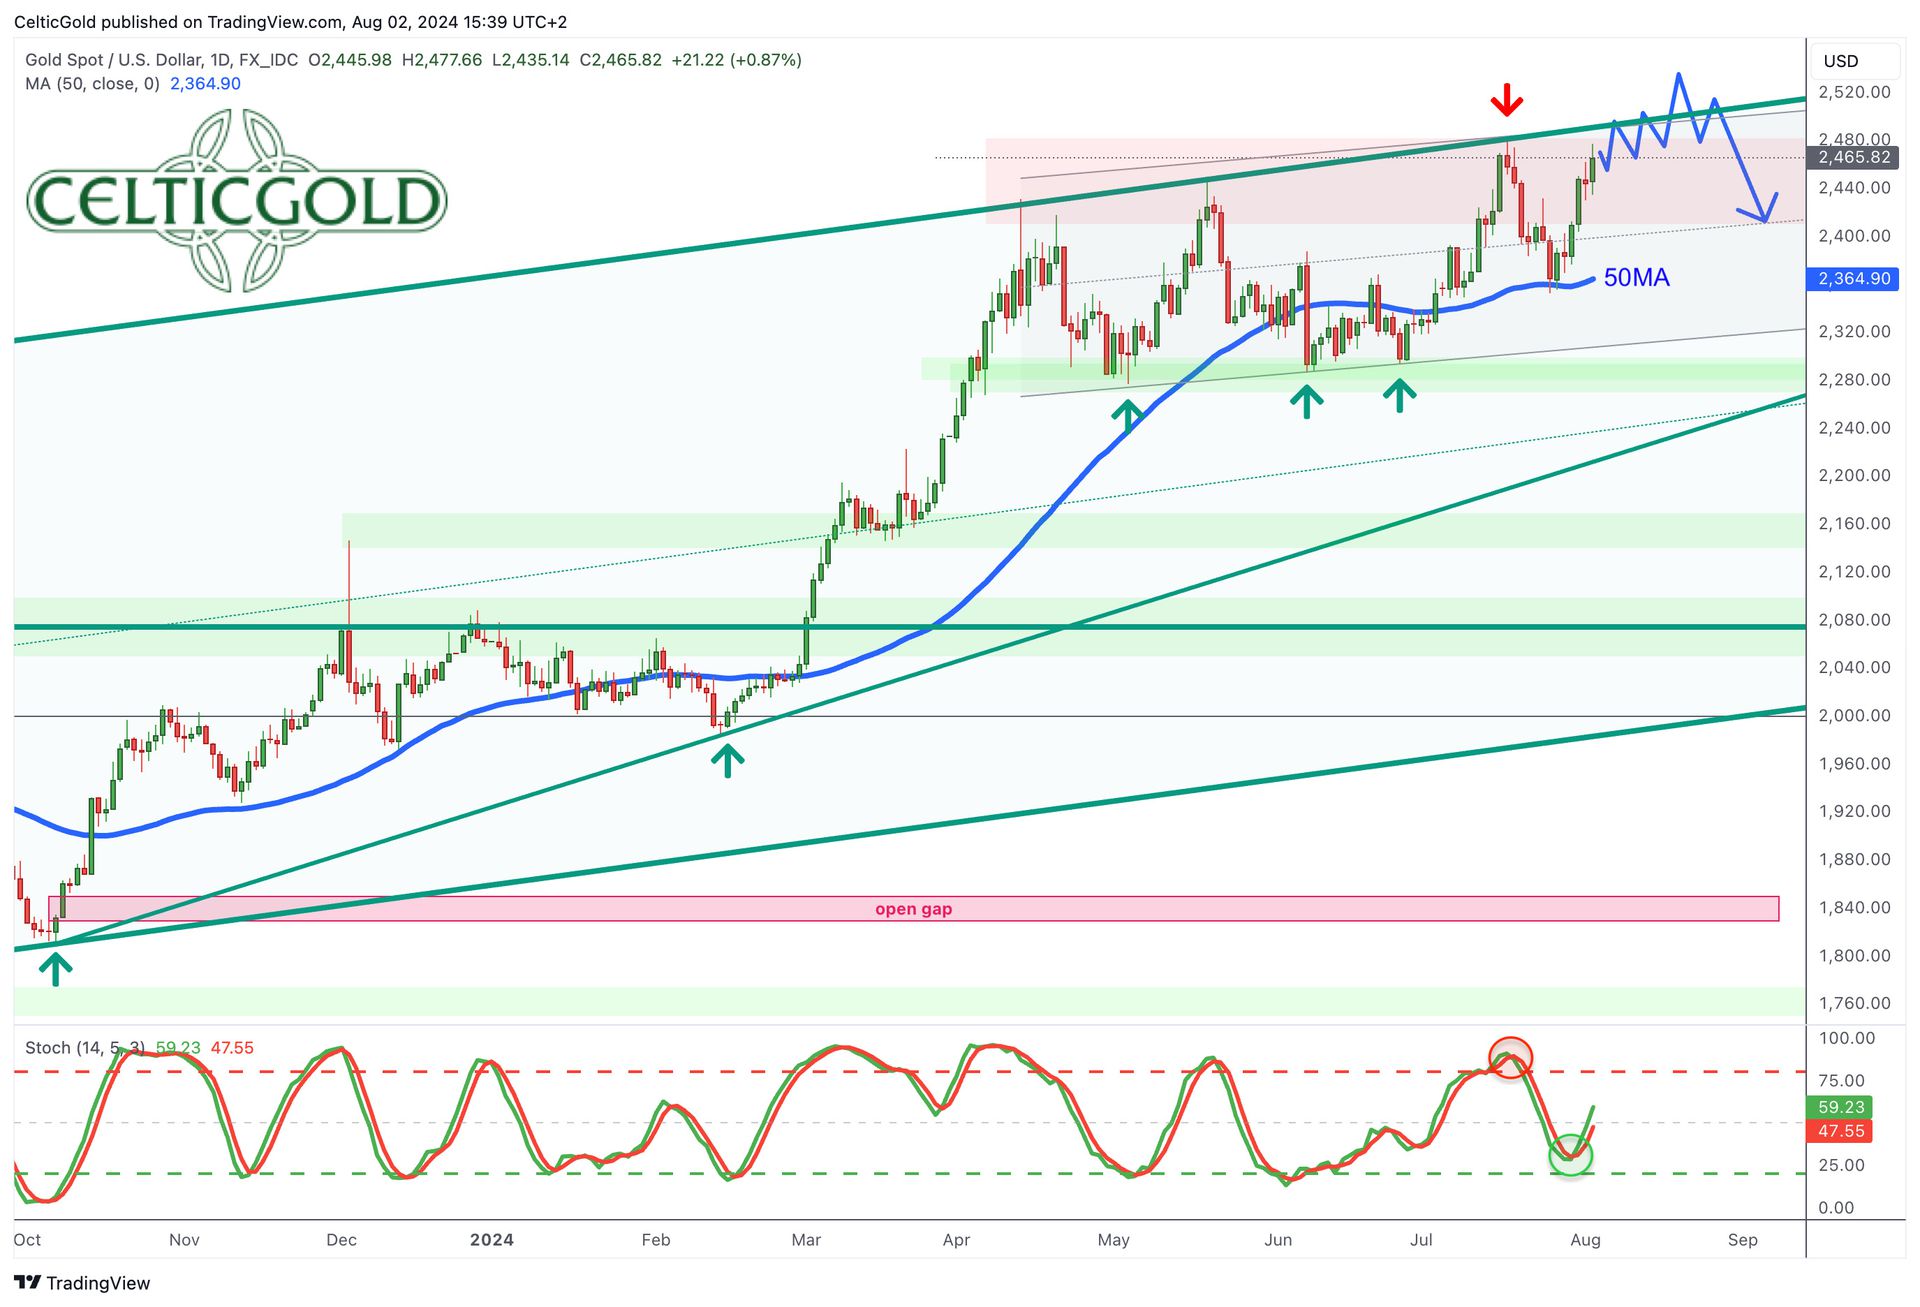
Gold in US-Dollar, daily chart as of August 2nd, 2024. Source: Tradingview
On the daily chart, last week’s price drop has led to a revisit of the 50-day moving average (USD 2,363). This moving average has barely risen since early June due to the extended sideways phase. However, prices bounced off this solid support and rallied USD 115 from there in a matter of six days.
The resulting new buy signal from the stochastic oscillator still has a lot of room to the upside and indicates that the rally has further to go. However, the user daily Bollinger Band (USD 2,477) will likely create some struggles for the bulls.
In summary, the daily chart is bullish. Support between USD 2,420 and USD 2,450 will have to hold for this rally to continue.
3. Commitments of Traders for Gold – Bearish
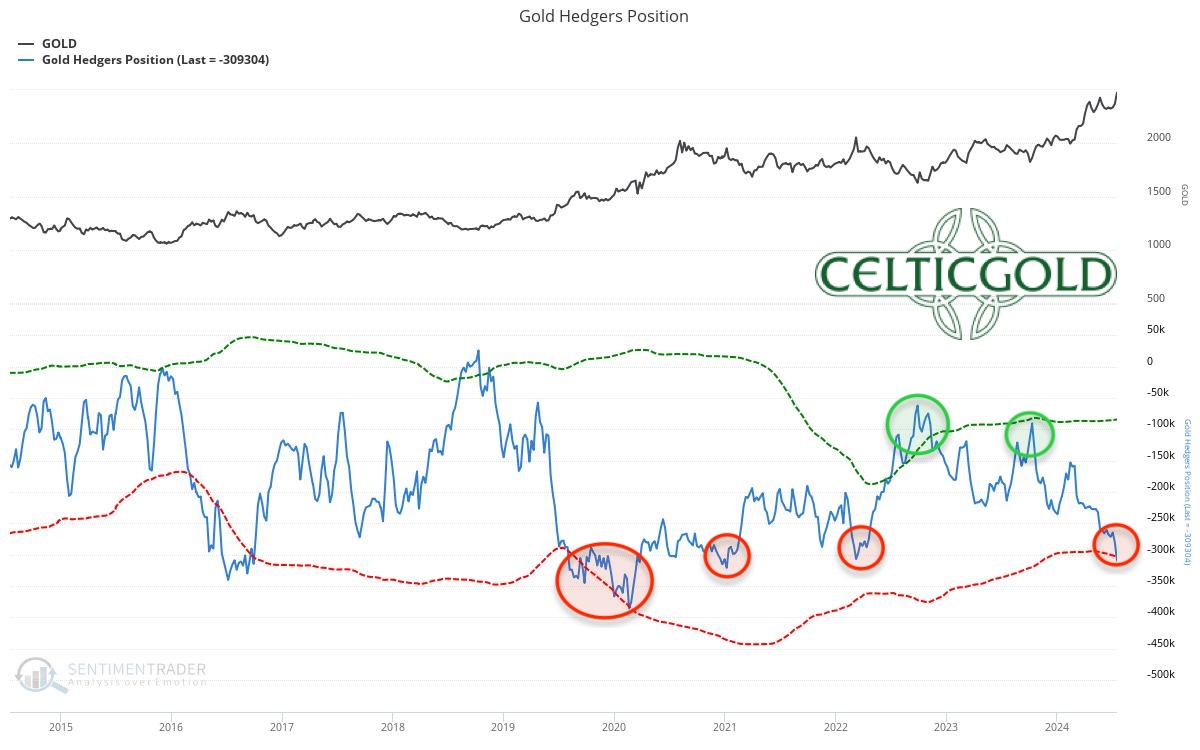
Commitments of Traders (COT) for gold as of July 16th, 2024. Source: Sentimentrader
At the closing price of USD 2,469 on Tuesday 16th July, commercial traders held a cumulative short position of 309,304 gold futures contracts. The new record highs in the gold price have thus also led to the largest short position in the futures market since May 2021.
Although we have given less weight to the CoT Report in our analysis in recent years, it should by no means be ignored. The current positioning of professional players in the gold market is extremely unhealthy and dangerous. With over 300,000 short-sold contracts, one should not bet on further rising prices. The sharp pullback from the new all-time high at USD 2,483 down to USD 2,353 clearly and impressively confirms this assessment.
Overall, the current CoT Report is extremely negative and clearly bearish. It will require significantly lower prices and, above all, much time before this analysis component can be interpreted as neutral or even counter-cyclically bullish again.
4. Sentiment for Gold – Too optimistic
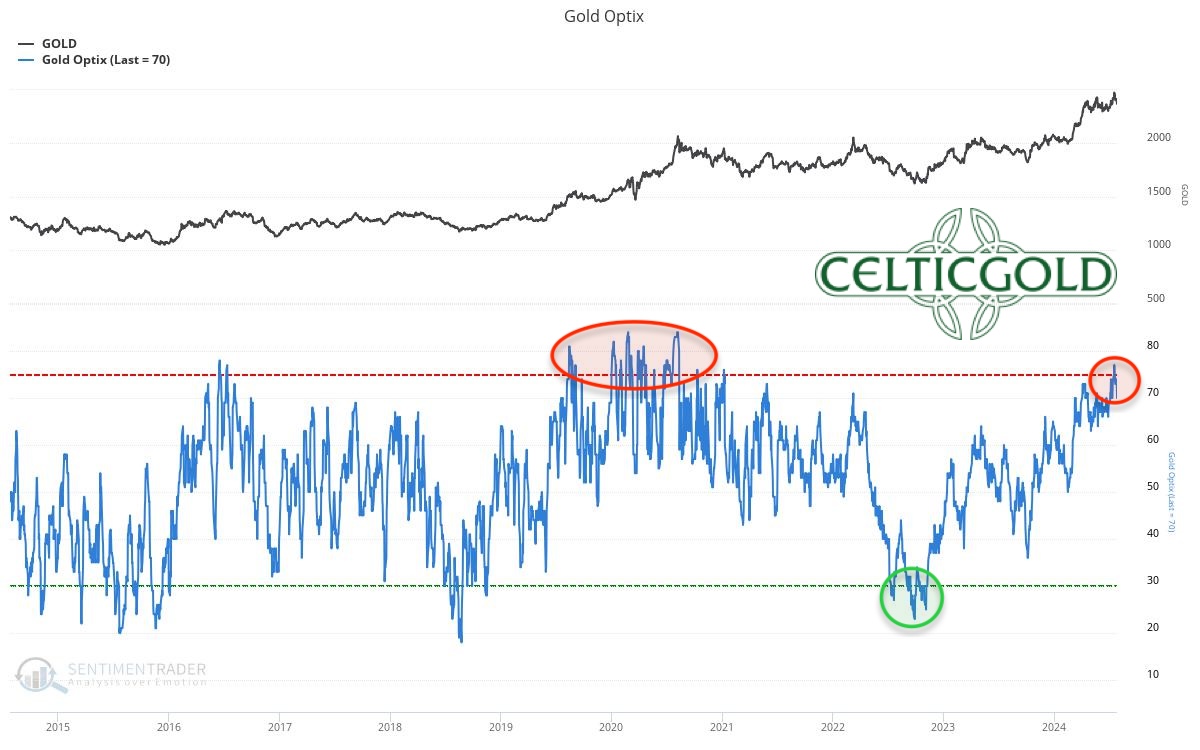
Sentiment Optix for gold as of July 26th, 2024. Source: Sentimentrader
Sentiment has also risen to unhealthily high levels of optimism, reaching 77 out of 100 points thanks to the recent rally, indicating the greatest euphoria since the summer of 2020! In the short-term, there might still be some more room to extend the sentiment further into euphoria stage.
In summary, sentiment in the gold market has reached very unhealthy heights. In the big picture, the situation is now a mirror image of the panic and price lows from October/November 2022. Caution and restraint are warranted.
5. Seasonality for Gold – Positive until end of August
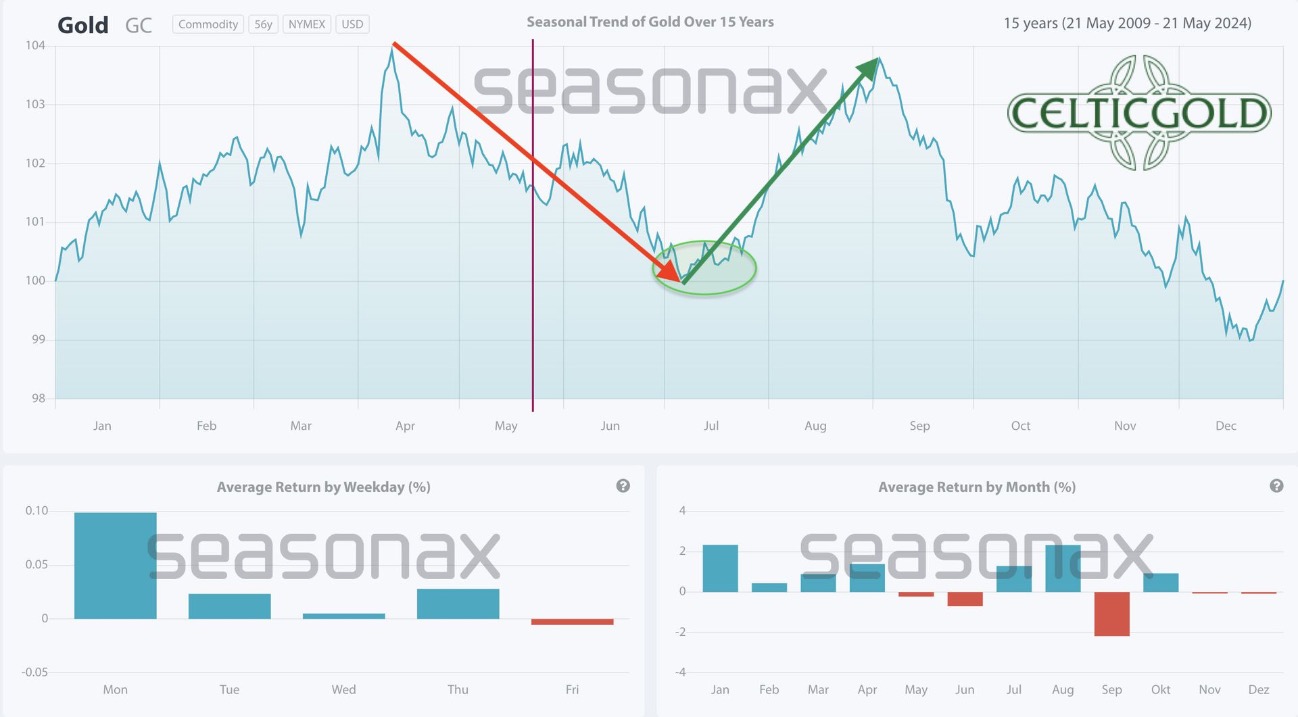
Seasonality for gold over the last 15-years as of May 22nd, 2024. Source: Sentimentrader
Statistically, the seasonally favourable phase for the gold price already ended in mid-April. Nevertheless, slightly higher peaks were achieved in mid-May at USD 2,450 and now in mid-July at USD 2,483.
However, in the last 15 years, once the summer rally’s peak was found, the price usually trended downwards until mid-December. Even if the gold price this year only experiences a modest pullback or a minor correction, precious metal prices could see a pullback until the Chinese National Day (“Golden Week”) at the beginning of October.
Based on the last 15 years, the seasonal component remains favourable for a few more weeks. At the latest, from the beginning of September, this analysis component turns dark red.
6. Macro update – Gold & silver premiums in China are collapsing
Between 17th July and 25th July, gold prices experienced a dramatic decline, falling to their lowest level in about three weeks against the US dollar at USD 2,353. In addition to the sudden increase in risk premium in the stock markets due to the newly ignited US election campaign, unexpectedly good US GDP data and the collapse of premiums in Shanghai were primarily responsible for the significant price decline.
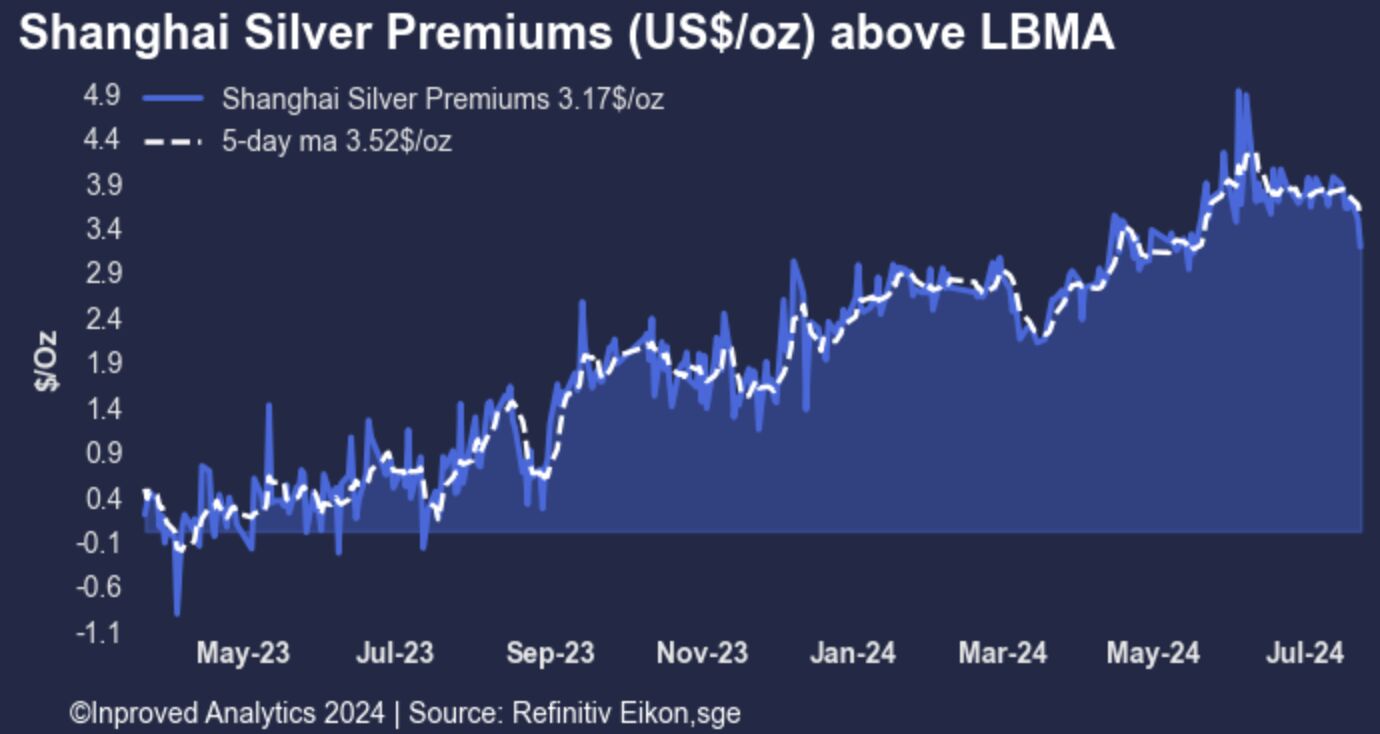
Shanghai Silver Premiums (US$/oz) above LBMA as of July 26th, 2024. Source: InProved Analytics
Since August of last year, premiums for physically backed gold and silver trading in Shanghai had initially risen steadily. While premiums in the Chinese silver market continued to rise to over 12-13% by early June, the Chinese gold market already saw an initial peak in October, followed by a months-long decline in premiums.
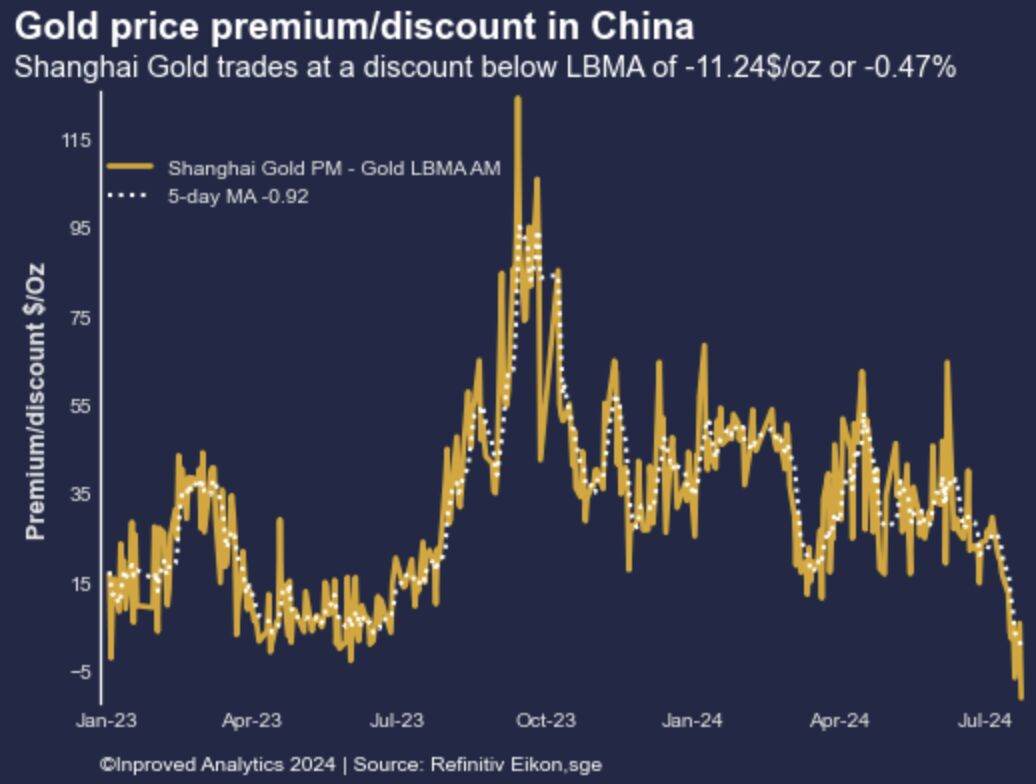
Gold price premium/discount in China as of July 24th, 2024. Source: InProved Analytics
After the Chinese central bank officially stopped buying gold in May and June, the premiums finally collapsed completely in recent weeks. At some point, the gold price in Shanghai was even trading at a discount of -USD 11.25 per ounce or -0.47% below the LBMA gold price. The China premium thus fell to its lowest level in 2 years.
This has eliminated the incentive for new gold imports into China, as arbitrage trading no longer makes sense. Additionally, the absence of government stimulus programs in China, the world’s largest gold consumer market, continues to put downward pressure on gold demand. This combination of factors, along with the clearly overbought situation since spring, likely led to the sell-off.
6.1 Market turbulence on the horizon
Despite short-term price fluctuations, the long-term upward trend remains intact, however. As soon as the US Federal Reserve is forced to make initial interest rate cuts, the gold price should rise to new heights again. However, it is quite conceivable and realistic that there will be substantial market turbulence to endure until then. Since 11th July, the NASDAQ 100 is already down nearly 11.5%.
6.2 America is going bankrupt
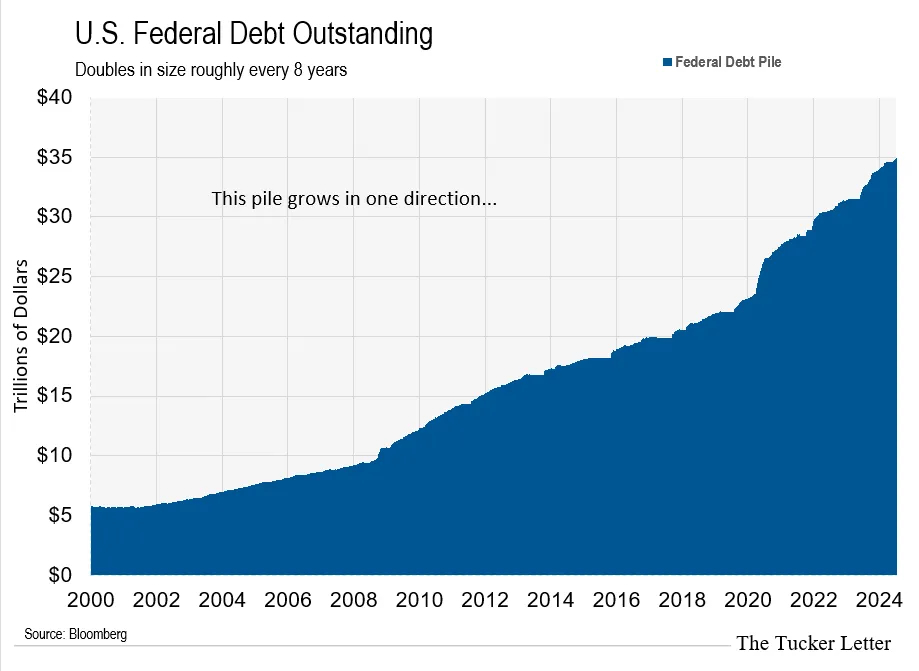
U.S. Federal Debt Outstanding as of July 18th, 2024. Source: Bloomberg, The Tucker Letter
The total outstanding US national debt has doubled in the last eight years and now amounts to over USD 34 trillion, corresponding to about 122% of US Gross Domestic Product (GDP). At the same time, the interest burden has exploded due to sharply rising interest rates and growing debt. While the US government had to pay about USD 600 billion in interest on the entire national debt in 2023, it is projected to reach USD 1.14 trillion this year, eating 76% of all income taxes collected in 2024. These interest expenses now account for over 3.6% of GDP and are likely to continue rising sharply in the coming years. This limits the US government’s financial leeway and will lead to major economic challenges in the medium to long term. Only with lower interest rates and a weaker US dollar will the US budget be able to continue this game.
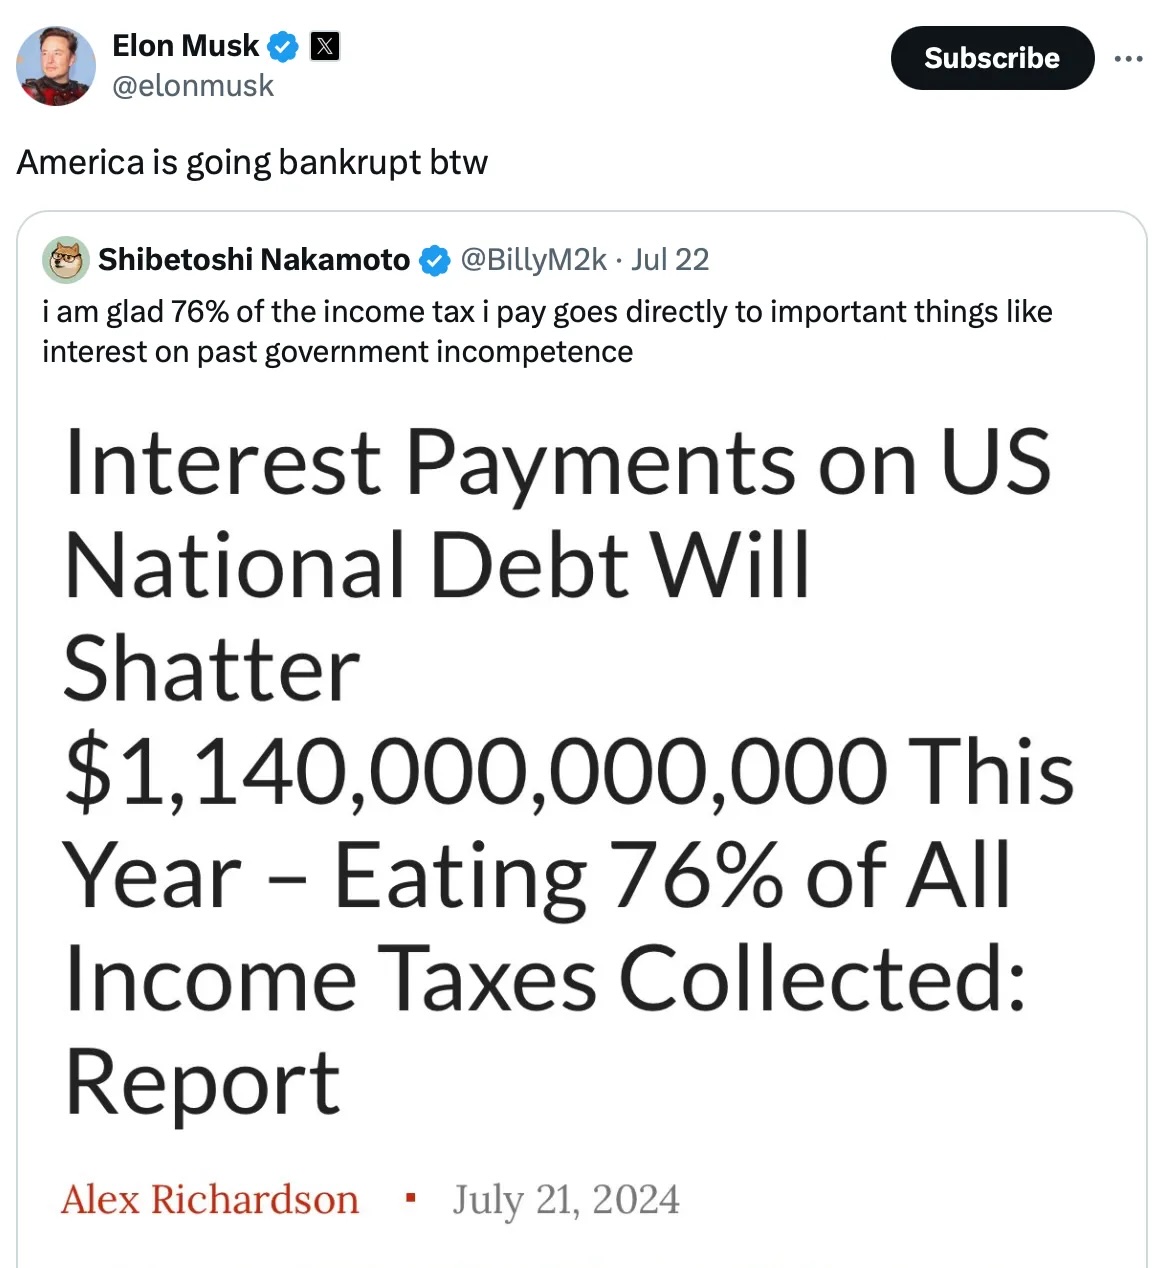
America is going bankrupt as of July 22nd, 2024. Source: Elon Musk
However, before the US government loudly calls for interest rate cuts, turbulence in financial markets is likely to force the interest rate turnaround. Current labour market data is still robust, and according to CME FedWatch, an interest rate cut in the US due to economic weakness could become more likely from September at the earliest. In the past, however, central bankers have always reacted far too late and only when stock markets were collapsing.
While there has been decline in recent days, one cannot (yet) speak of a dramatic collapse. Surprisingly weak economic data and corporate figures from the technology sector at least caused some sobering among investors. Over the weak summer months, the increased uncertainty could grow into a larger storm into the autumn. In this environment, all asset classes are likely to be temporarily affected. We therefore remain with our wait-and-see and patient approach and have further increased cash quotas.
7. Conclusion: Gold – Only a short-lived pullback after speculative spike
Since 6th October 2023, gold prices have significantly increased from USD 1,810 to USD 2,483. Although the rally was not a one-way street and was repeatedly interrupted by pullbacks and consolidations, the overall result is an impressive price increase of +37.2%. With the new all-time high at USD 2,483 and the subsequent sell-off down to USD 2,353 as well as the quick recovery towards USD 2,477, the bulls are still in control of the gold-market.
However, we have repeatedly pointed out since last year that after the successful breakout above USD 2,075 and a rally towards approx. USD 2,535, there should be a “textbook-like” pullback to the former resistance zone sooner or later. So far, gold prices have only consolidated very strongly at a high level since mid-April. The vertical final exaggeration, which typically brought the “end of the line” in the past, was missing. We believe that this behaviour is now taking place with the sharp spike to USD 2,483 and the continued rally.
If this assumption is correct, the gold price might reach a few higher highs around and slightly above USD 2,500. Ultimately the rally is about to end though and gold prices may finally start to correct as the liquidity is shrinking due to the stock-market correction.
Feel free to join us in our free Telegram channel for daily real time data and a great community. If you like to get regular updates on our gold model, precious metals and cryptocurrencies you can subscribe to our free newsletter .
Disclosure:
This article and the content are for informational purposes only and do not contain investment advice or recommendations. Every investment and trading move involves risk, and readers should conduct their own research when making a decision. The views, thoughts and opinions expressed here are the author’s alone. They do not necessarily reflect or represent the views and opinions of Midas Touch Consulting.
Florian Grummes is an independent financial analyst, advisor, consultant, trader & investor as well as an international speaker with more than 20 years of experience in financial markets. He is specialized in precious metals, cryptocurrencies, and technical analysis. He is publishing weekly gold, silver & cryptocurrency analysis for his numerous international readers. He is also running a large telegram channel with smart investors from all over the world. Florian is well known for combining technical, fundamental and sentiment analysis into one accurate conclusion about the markets.