1. Review
With the early failure of the summer rally at 1,807 USD, the outlook for the gold market quickly deteriorated again since mid-August. As a result, the bears were able to push gold prices without much resistance below the important support at 1,680 USD. This mark had withstood all attacks for the past two and a half years. In a miserable overall market environment, gold bulls were no longer able to defend this zone, hence gold prices sold off to 1,615 USD at the end of September, reaching their lowest level since April 2020. From the March high at 2,070 USD, gold has lost around 455 USD or almost 22% in just under seven months!
In Euro, however, the picture looks much better. The weak Euro ensured that the price of gold in Euros can still show a small plus of 3.75% year-to-date. In a desolate 2022 for European equity and bond investors, gold brought at least some stabilization into a diversified portfolio.
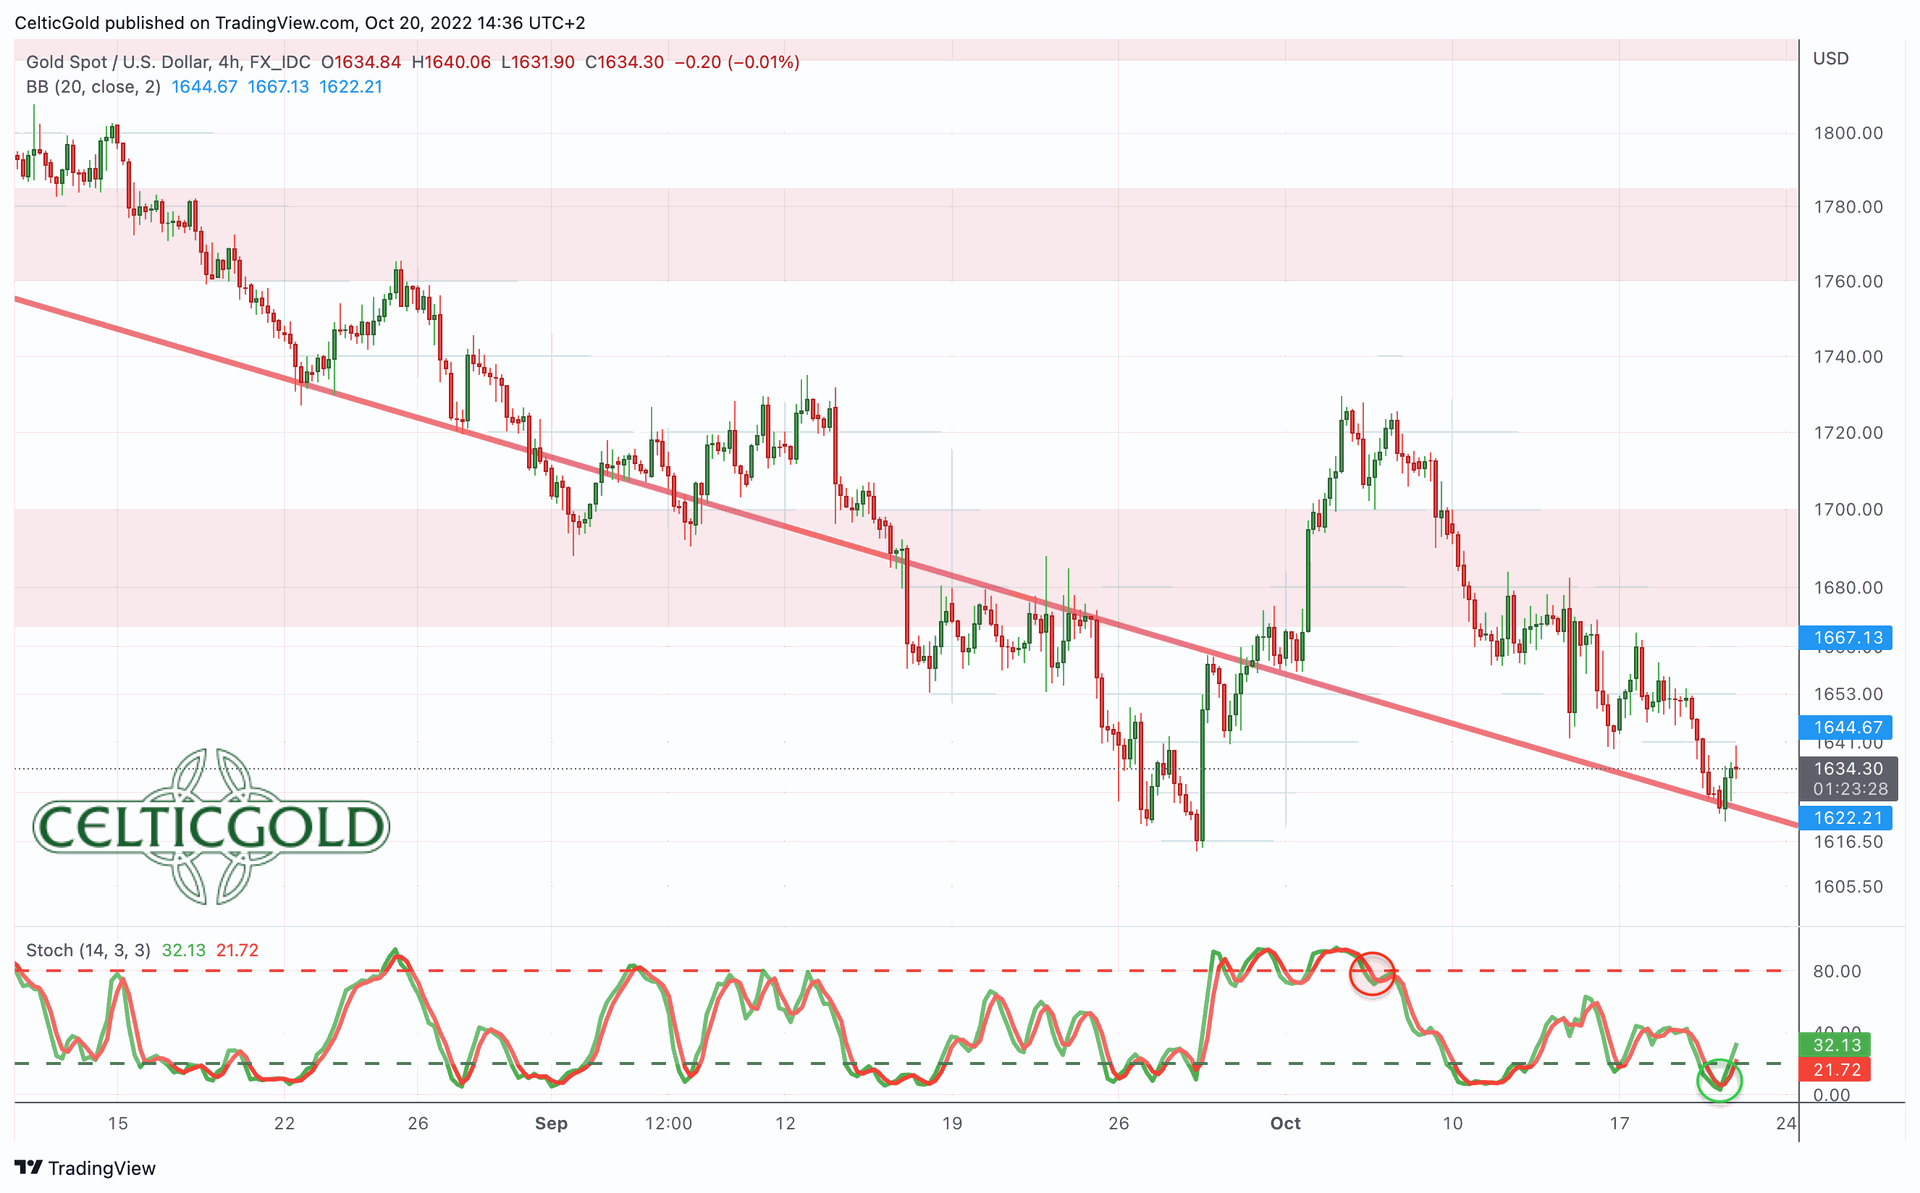 Gold in US-Dollar, 4-hour chart as of October 20th, 2022. Source: Tradingview
With the emergency intervention by the British central bank to support the imploding bond market, gold violently turned around on September 28th, and was able to recover significantly to 1,729 USD within just five trading days. However, this recovery didn't last long, as bears have pushed gold prices lower again over the past three weeks. Trading very close to the September low, a renewed recovery attempt could start any time. Given the heavily oversold situation and the beaten down sentiment, the chances of a larger recovery are not that bad.
Nevertheless, nothing has changed in the bigger picture as all sectors remain in a severe bear market. The continued strength of the US-Dollar, combined with rising US interest rates, is putting all asset classes under enormous pressure and further withdraws liquidity from the markets. It's a vicious circle that is likely to continue until credit markets freeze, at which point the Federal Reserve will be forced to make a radical change in their money policy.
2. Chart Analysis Gold in US Dollars
2.1 Weekly chart: The support at 1,680 USD has been clearly broken
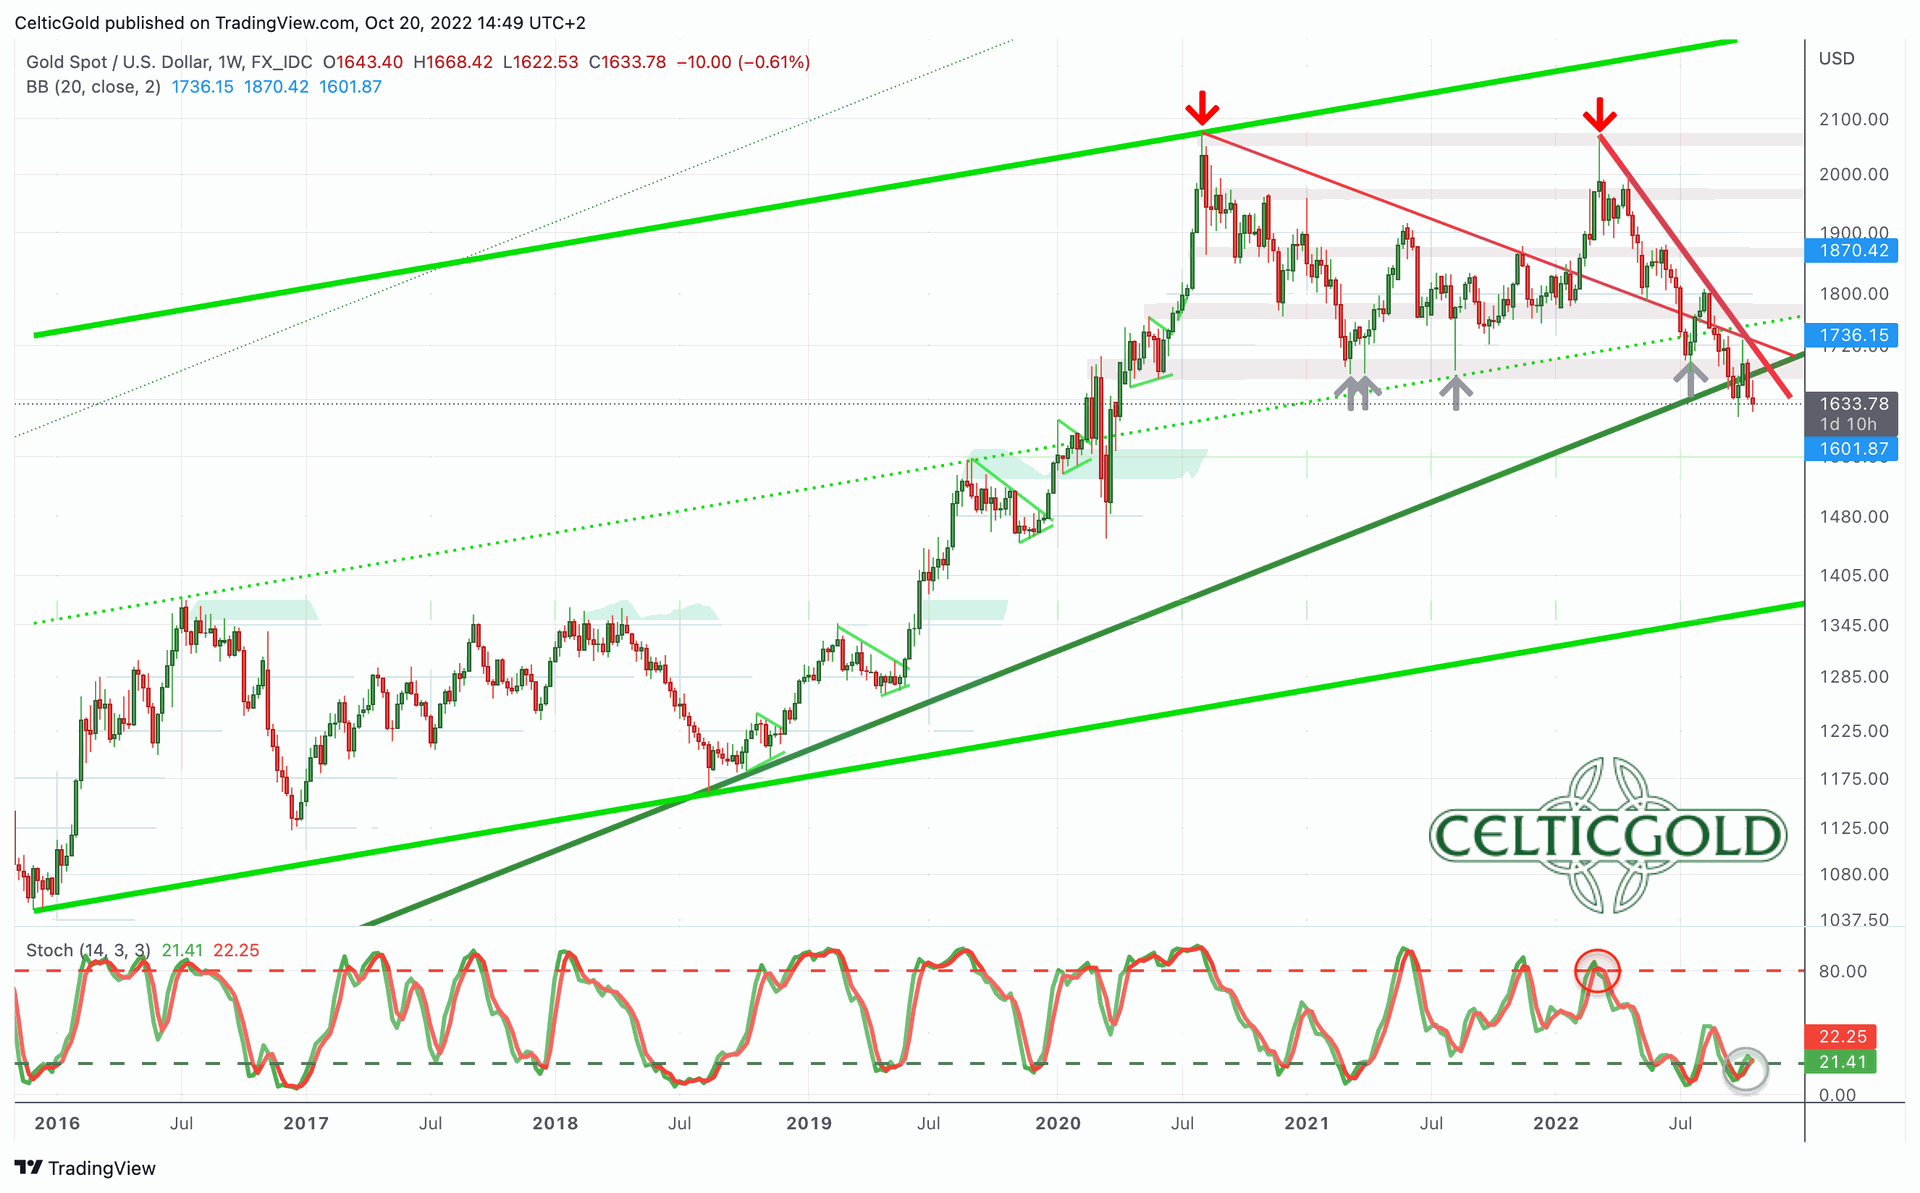 Gold in US-Dollar, weekly chart as of October 20th, 2022. Source: Tradingview
As feared, the support at 1,680 USD no longer withstood the pressure from the bears on their fifth attempt. Although the breakthrough was not very quick, the situation is clear. Gold prices are trading at their lowest levels since March 2020 and bullish signals are in nowhere in sight.
At least, the stochastic oscillator on the weekly chart is heavily oversold. But apart from the already broken lower edge of the long-term uptrend, there are no significant supports down to the area around 1,530 to USD 1,570. The absolute "worst case" scenario remains a pullback towards around 1,350 USD.
On the way up, the bulls must first clear the former support around 1,680 USD to provide an initial signal of a trend reversal. So far, this has not been successful and the resistance zone around 1,680 USD is now being additionally strengthened with two crossing trend lines.
Overall, the weekly chart is bearish. From a trend follower perspective, lower prices below the round number of 1,600 USD would therefore be the next logical step. At the same time, however, the technical situation is extremely oversold and a bet on lower prices no longer has a good risk/reward-ratio.
2.2 Daily chart: Clearly oversold again
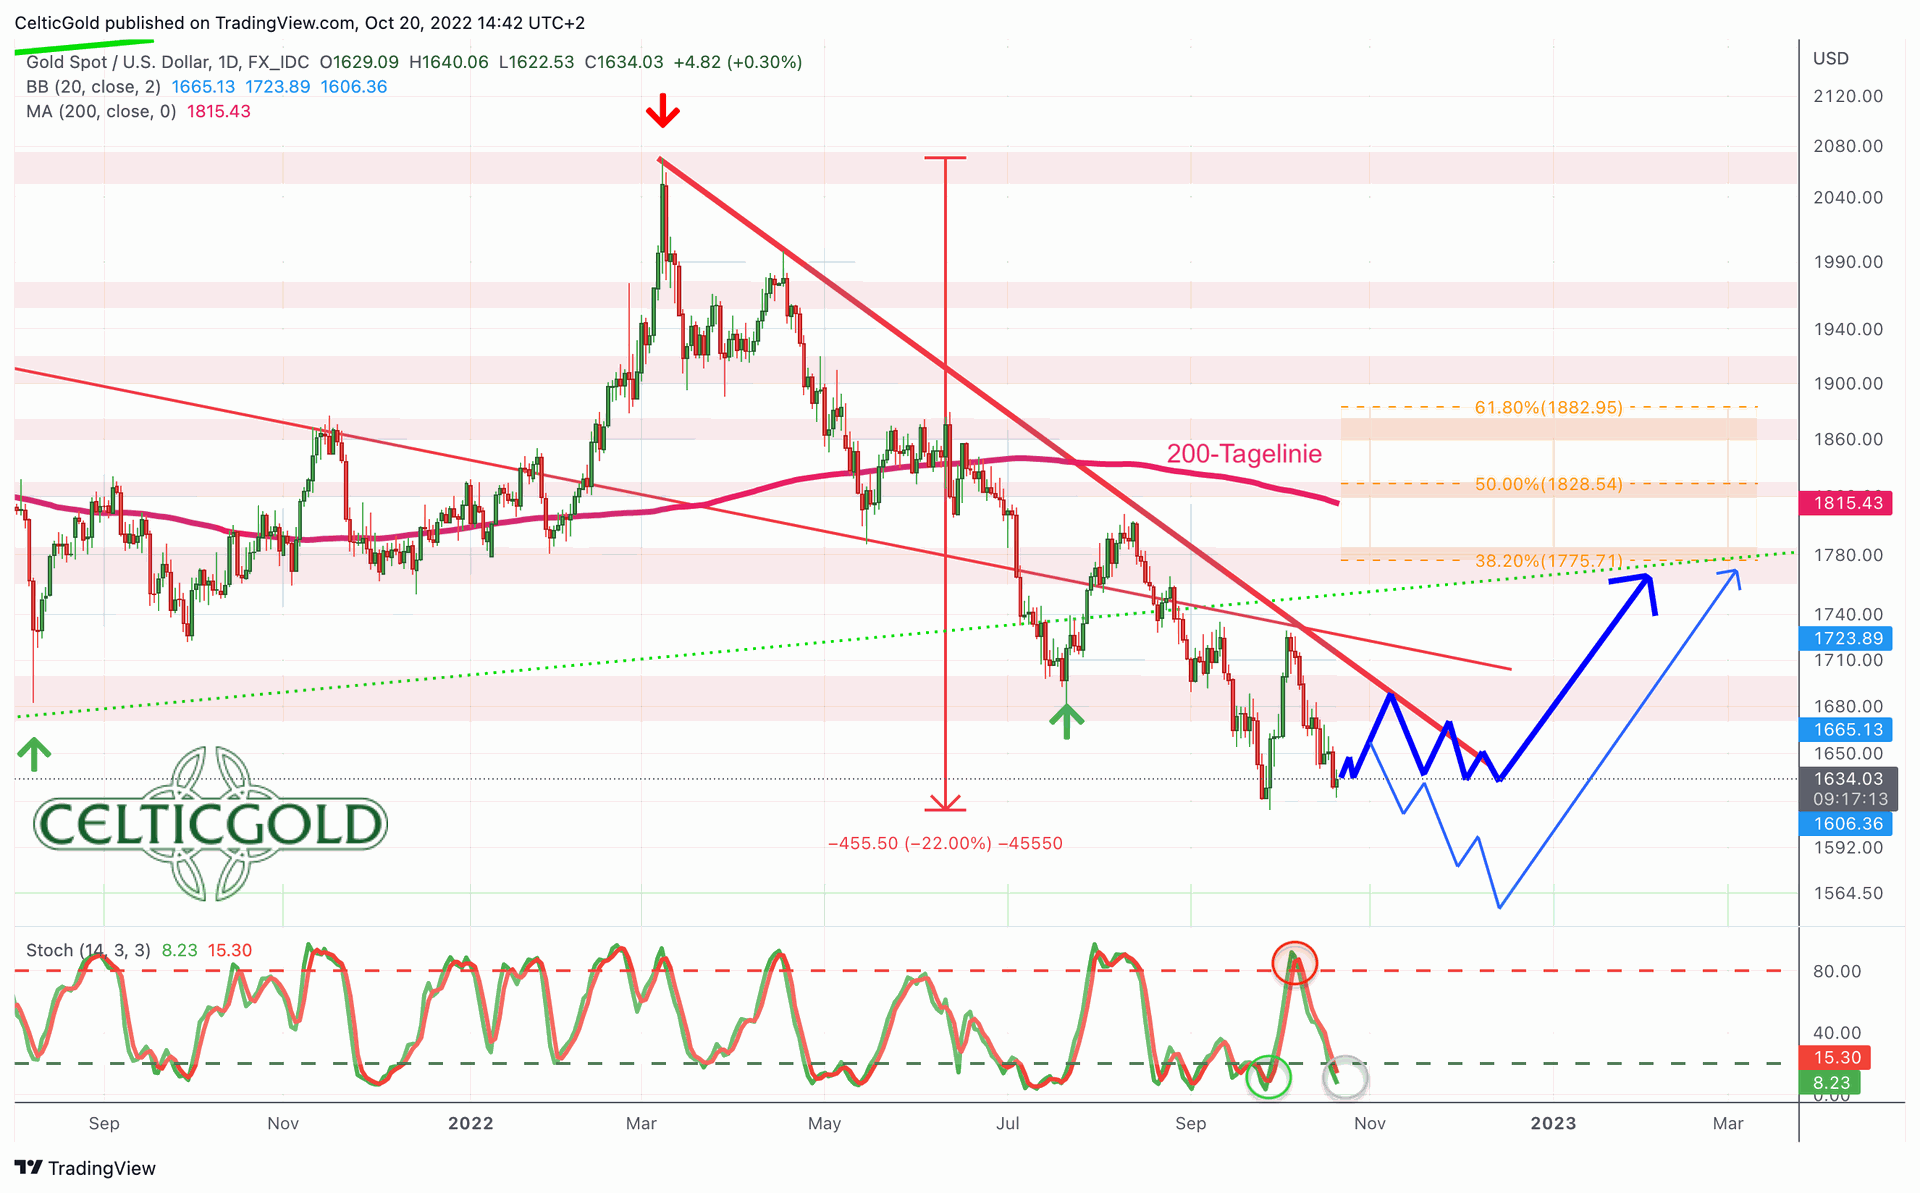 Gold in US-Dollar, daily chart as of October 20th, 2022. Source: Tradingview
On the daily chart, gold has been relentlessly sliding downwards since the high in March at 2,070 USD. Any countertrend-movement quickly fizzled out and gold faces a total loss of around 22%.
At the same time, gold is trading around 180 USD below its falling 200-day line (1,815 USD). Hence, a short squeeze is possible at any time. However, this would also require a pullback in the heavily overbought US-Dollar. In view of the extremely one-sided "long dollar" positioning of most market participants, this is certainly only a matter of time.
In any case, if gold can defend the September low at 1,615 USD, chances for a larger recovery would increase significantly. So far, however, this is wishful thinking but a decision will be made in the next few days.
All in all, the daily chart is bearish, but oversold and therefore actually ripe for a renewed recovery. Nevertheless, gold would have to break out clearly above 1,680 USD and ideally also clear the last high at 1,730 USD to send a first bullish signal. More likely would be a tenacious and tricky bottom building process above 1,600 USD or even new lows somewhere between 1,530 and 1,570 USD. Be prepared that this bear spook could possibly even drag on until mid-December!
3. Commitments of Traders for Gold – In search of a bottom
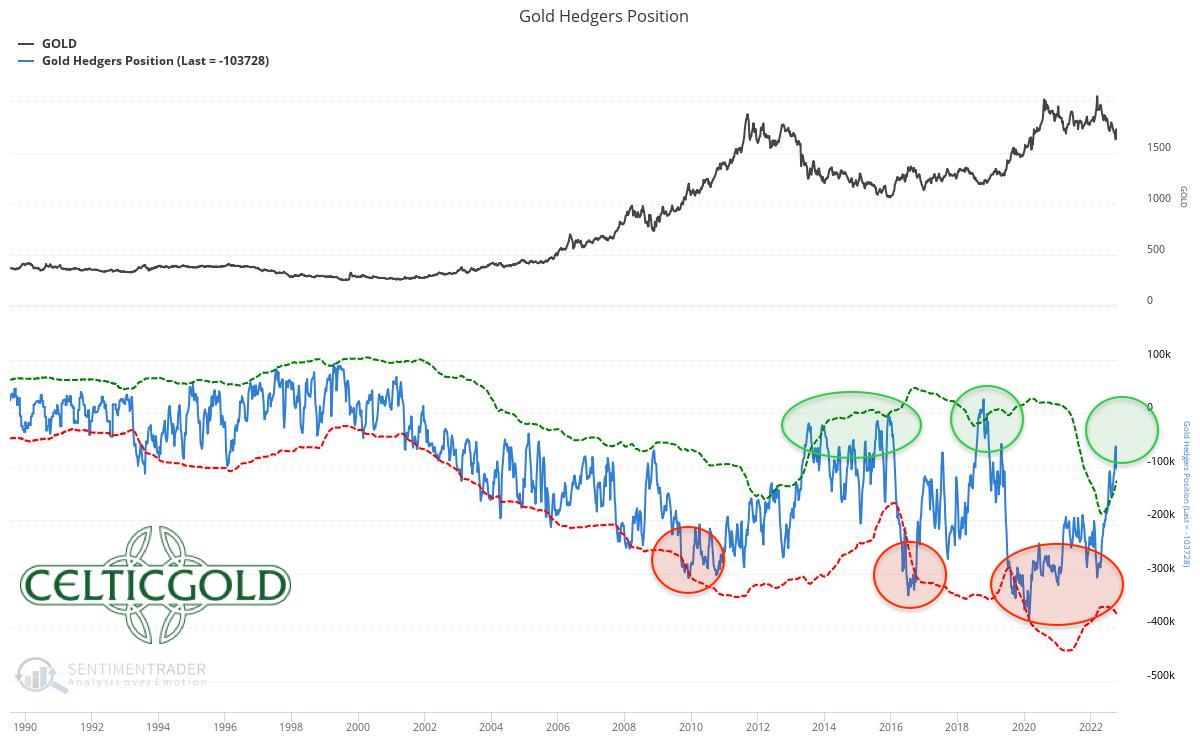 Commitments of Traders (COT) for Gold as of October 19th, 2022. Source: Sentimenttrader
At the end of September, the cumulated net short position of the commercial participants (62,138 contracts) had fallen to its lowest level since April 2019. The result was a sharp bounce of around 115 USD. According to the latest COT report, this short position amounts to 103,728 short-sold contracts and is therefore just above the threshold of 100,000 short contracts, at which one can speak of a sustainably bullish COT report. As gold is trading again around its September lows, the situation surely has improved further from contrarian point of view.
In summary, the COT report can be classified as increasingly bullish.
4. Sentiment for Gold
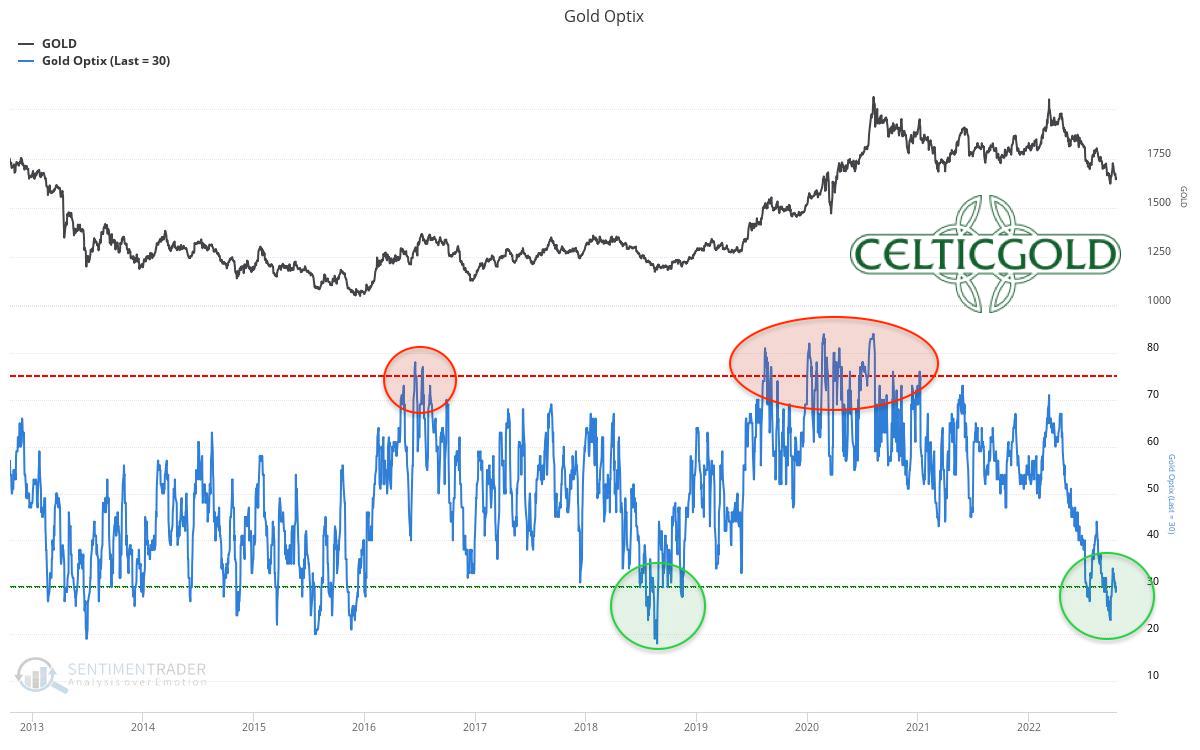 Sentiment Optix for Gold as of October 19, 2022. Source: Sentimenttrader
After seven months of almost non-stop falling prices, the sentiment in gold market has once again entered “excessively bearish” territory. However, when the vast majority of market participants is extremely pessimistic, the opposite often tends to happen. Although a bottoming process might drag on for months, the remaining downside risk seems rather limited given the current sentiment. In the medium and above all in the long term, this bombed out sentiment is currently laying the foundation for the next fulminant rise in the price of gold.
Overall, the sentiment traffic light is green and provides a strong contrarian buy signal!
5. Seasonality for Gold – In search of a bottom
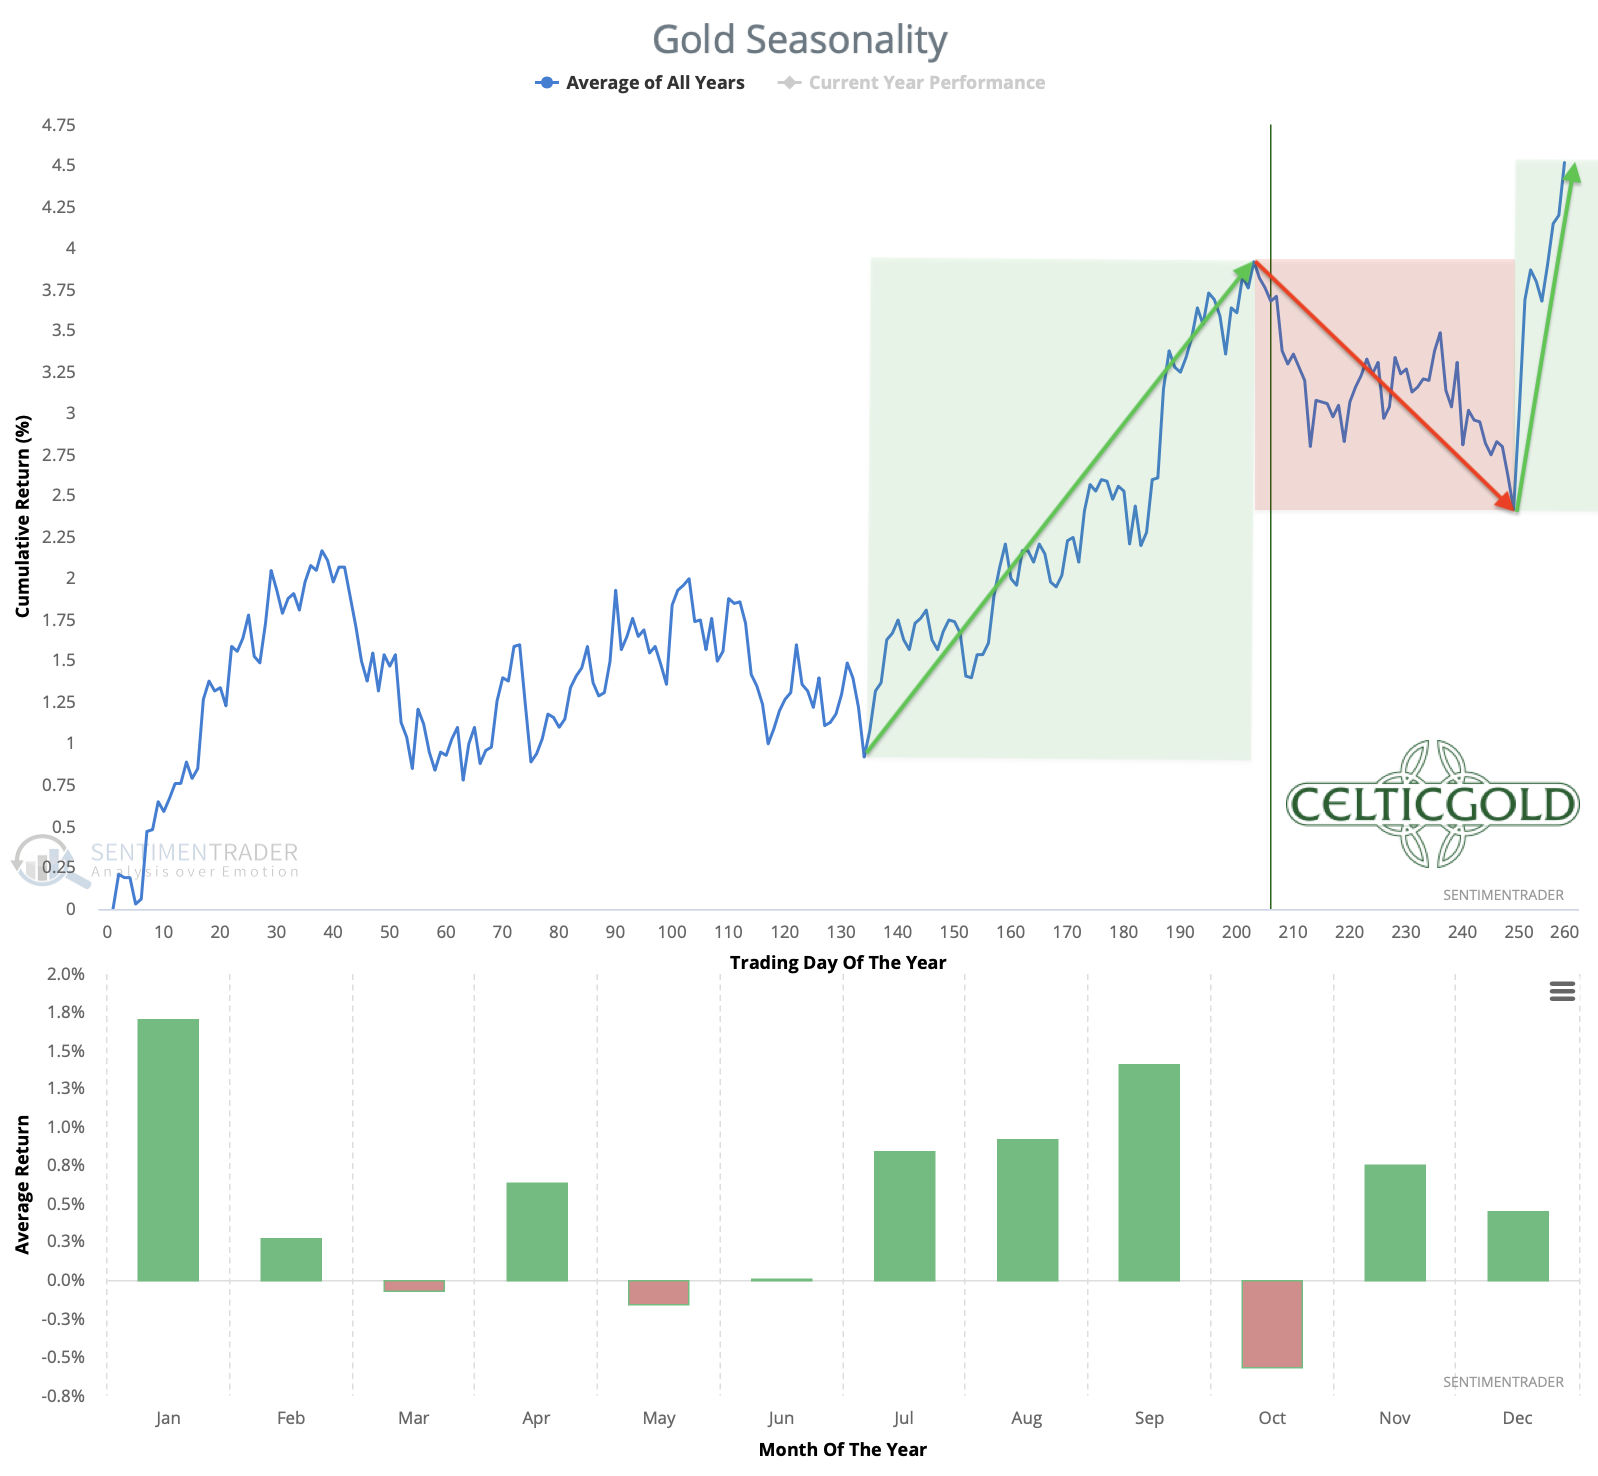 Seasonality for Gold over the last 54-years as of October 19th, 2022. Source: Sentimenttrader
From a seasonal perspective, the gold market still faces two difficult months ahead. Only with the US interest rate decision on December 14th will the worst of the season be over. Until then, the gold price should, statistically speaking, trade sideways to lower.
In summary, seasonality for the gold and silver is clearly bearish until mid-December.
6. Macro update – Miserable stock market year causes exaggerated pessimism
Historically, September and October are the two worst months of the year for financial markets. The current year has so far confirmed these statistics quite well. Since September 1st, stock markets (Nasdaq -10.9%, DAX -1.2%), gold (-4.27%) and Bitcoin (-4.28%) show a negative result. Overall, the important asset classes have continued their sell-off and stock indices in particular fell to new lows.
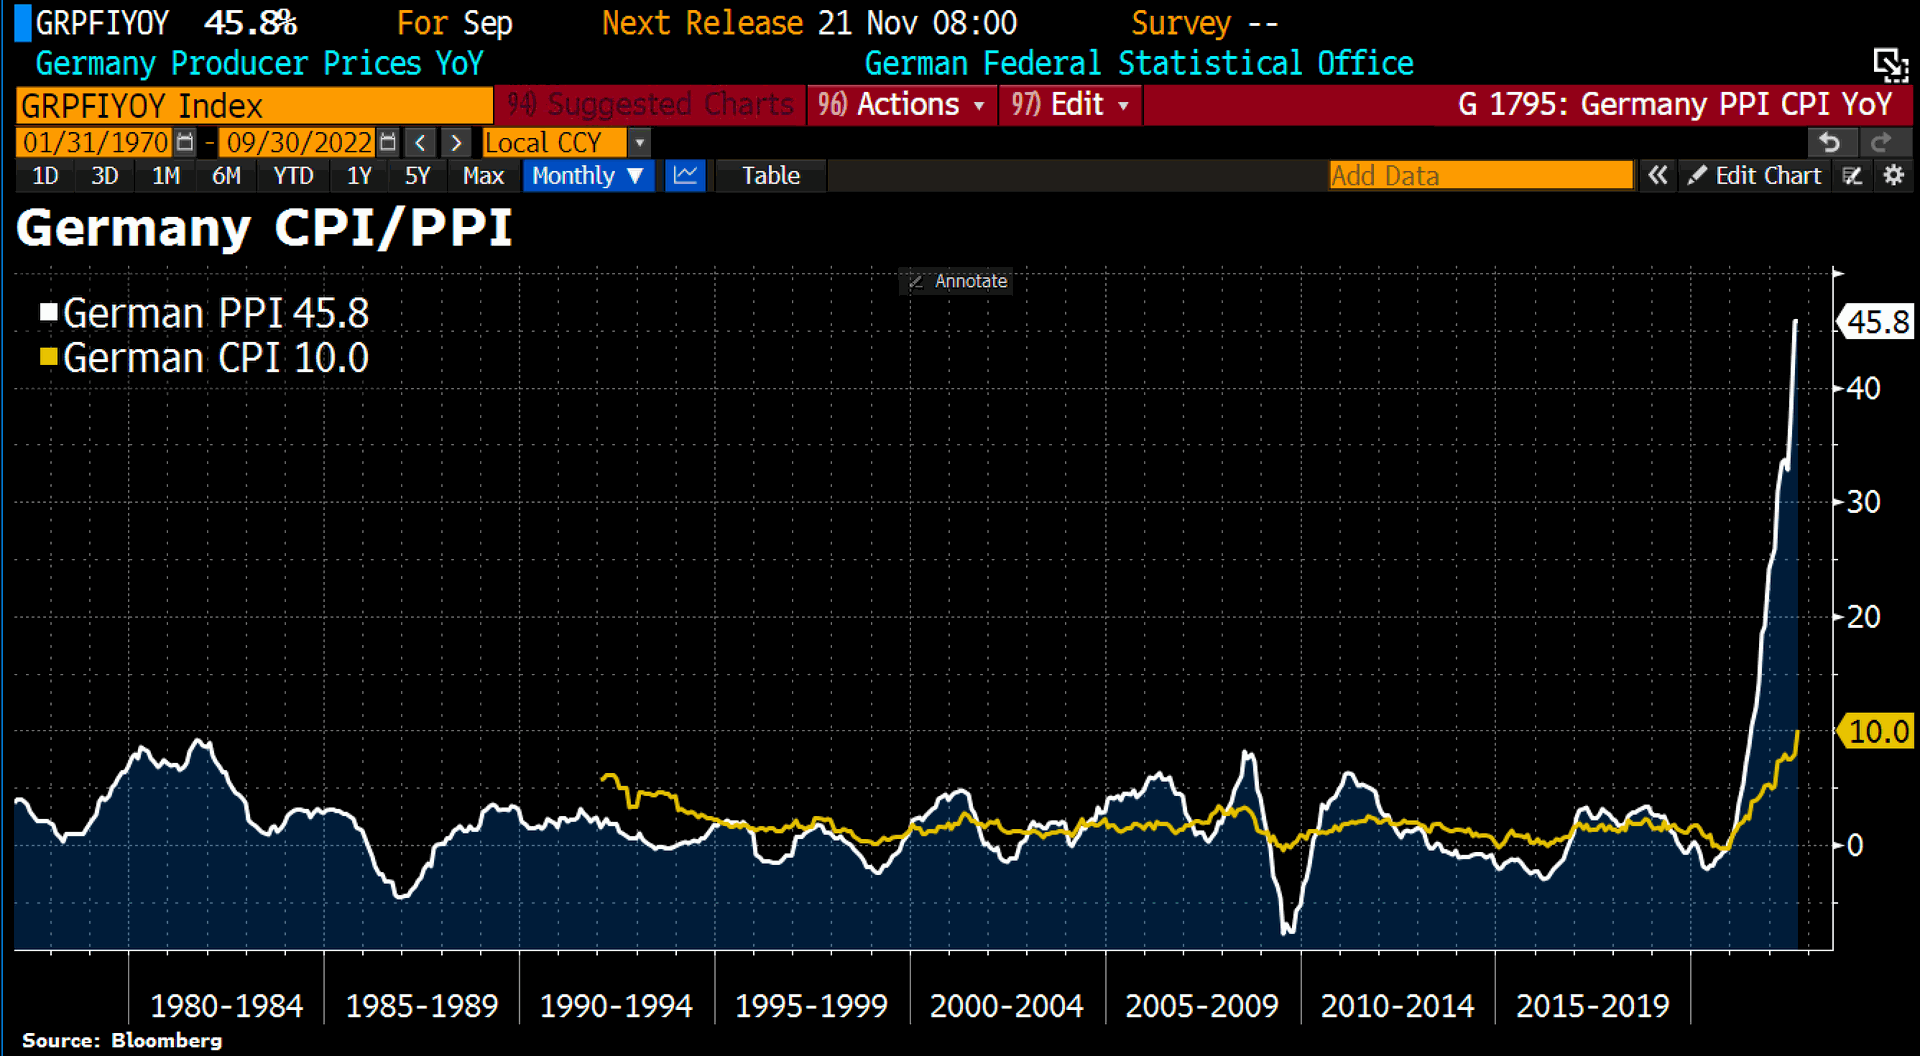 Consumer prices vs. producer prices in Germany as of September 30th, 2022. © Holger Zschaepitz
The high inflation numbers have not given the markets any breather and are forcing central bankers in the major economies to raise interest rates further. While the US central bankers are trying to get inflation under control with "quantitative tightening" and interest rate hikes on an unprecedented scale, consumer prices in Germany are still rising. Most recently, German producer prices rose by 45.8% in September, the highest year-over-year rate since 1949.
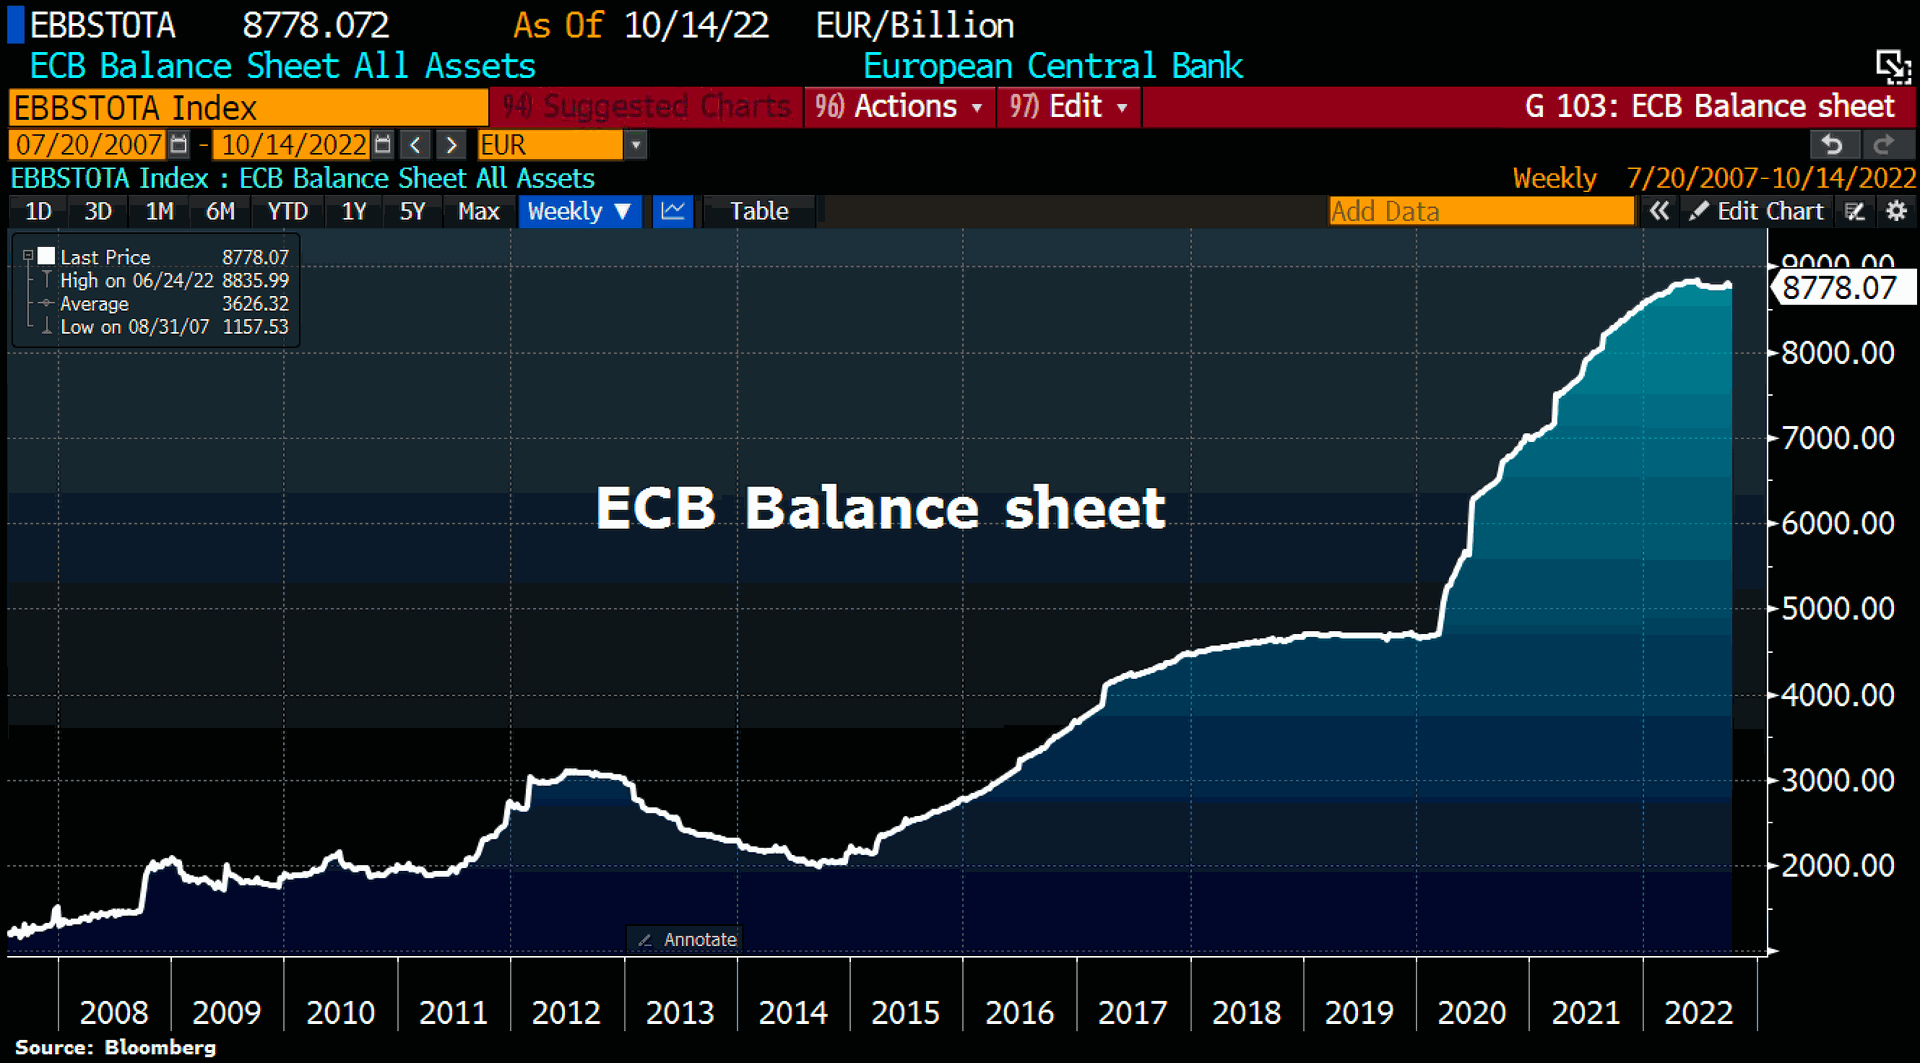 ECB balance sheet as of October 14th, 2022. © Holger Zschaepitz
Hence, the fight against inflation is not showing any success (yet), especially in the euro zone. On the contrary, the European Central Bank (ECB) continues to pour fuel into the fire while the balance sheet total has recently increased by 6.1 billion EUR to 8,778.1 billion EUR as a result of "quantitative easing". Since the record high in June, the ECB's total assets have decreased by only 57 billion EUR and currently still represent around 81% of eurozone´s GDP. Hence, the EUR remains under heavy pressure against the US dollar and continues to fuel inflation due to rising import prices. No one knows how long this monetary experiment in the eurozone and Japan as well as the restrictive monetary policy in the USA can continue.
An end to the geopolitical tensions between the USA/NATO/Eurozone on the one hand and Russia/China on the other is also not in sight. As a result, there is neither an end to the energy crisis in Europe in sight.
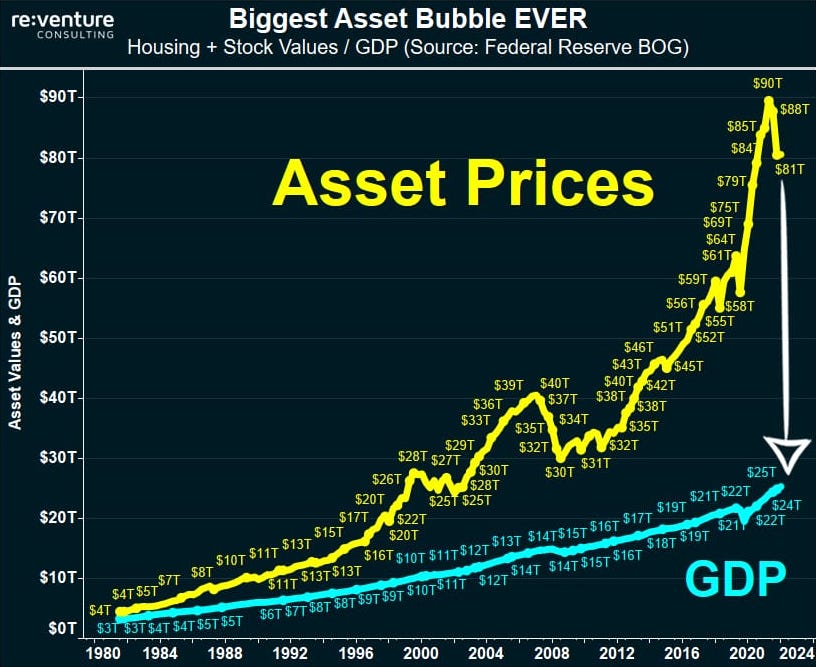
Biggest Bubble Ever, October 8, 2022. ©Reventure Consulting
Therefore, nothing has changed in the negative big picture assessment for international financial markets. The hot air is slowly and painfully escaping from the biggest bubble of all time. In this process, the strong U.S. dollar combined with rising U.S. interest rates is ensuring that liquidity in the global financial system continues to dwindle, causing additional stress and further margin calls. Unfortunately, this vicious circle will continue until the U.S. Federal Reserve will be forced to radically change direction due to imploding credit markets and a dramatic increase in U.S. unemployment rates by then. We suspect that there will be jolting interest rate cuts and massive liquidity measurements before the end of the first half of 2023.
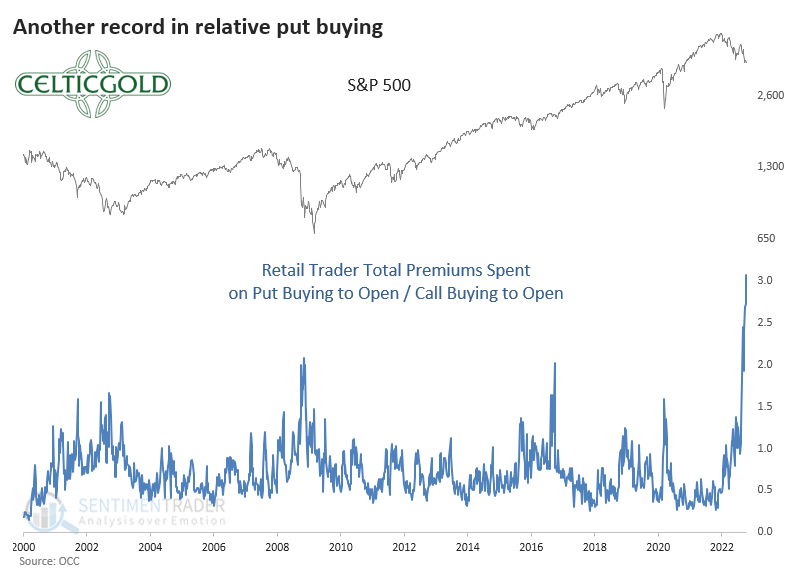
Put/Call-Ratio as of October 17th, 2022. ©Sentimentrader
At the same time, however, options traders have now amassed over 20 billion USD worth of put options to hedge against an equity market crash. Never in the history of U.S. financial markets has the put/call-ratio been at 3:1. Fear and panic are therefore extremely high and market participants are probably too bearishly positioned at present. Hence, a temporary yet sharp recovery (bear market rally) is quite possible by the end of the year.
7. Conclusion: Gold - In search of a bottom
Even if many gold investors are currently dissatisfied with the weak gold price development in USD, there is no way around gold in these crazy times given the turbulence in financial markets, historically high inflation rates, numerous hot spots, and an unbelievable number of (geo)political risks as well as the impending equalization of burdens / load balancing. Logically, the physical demand for precious metals remains very robust and has led to sometimes enormously high premiums, especially for silver.
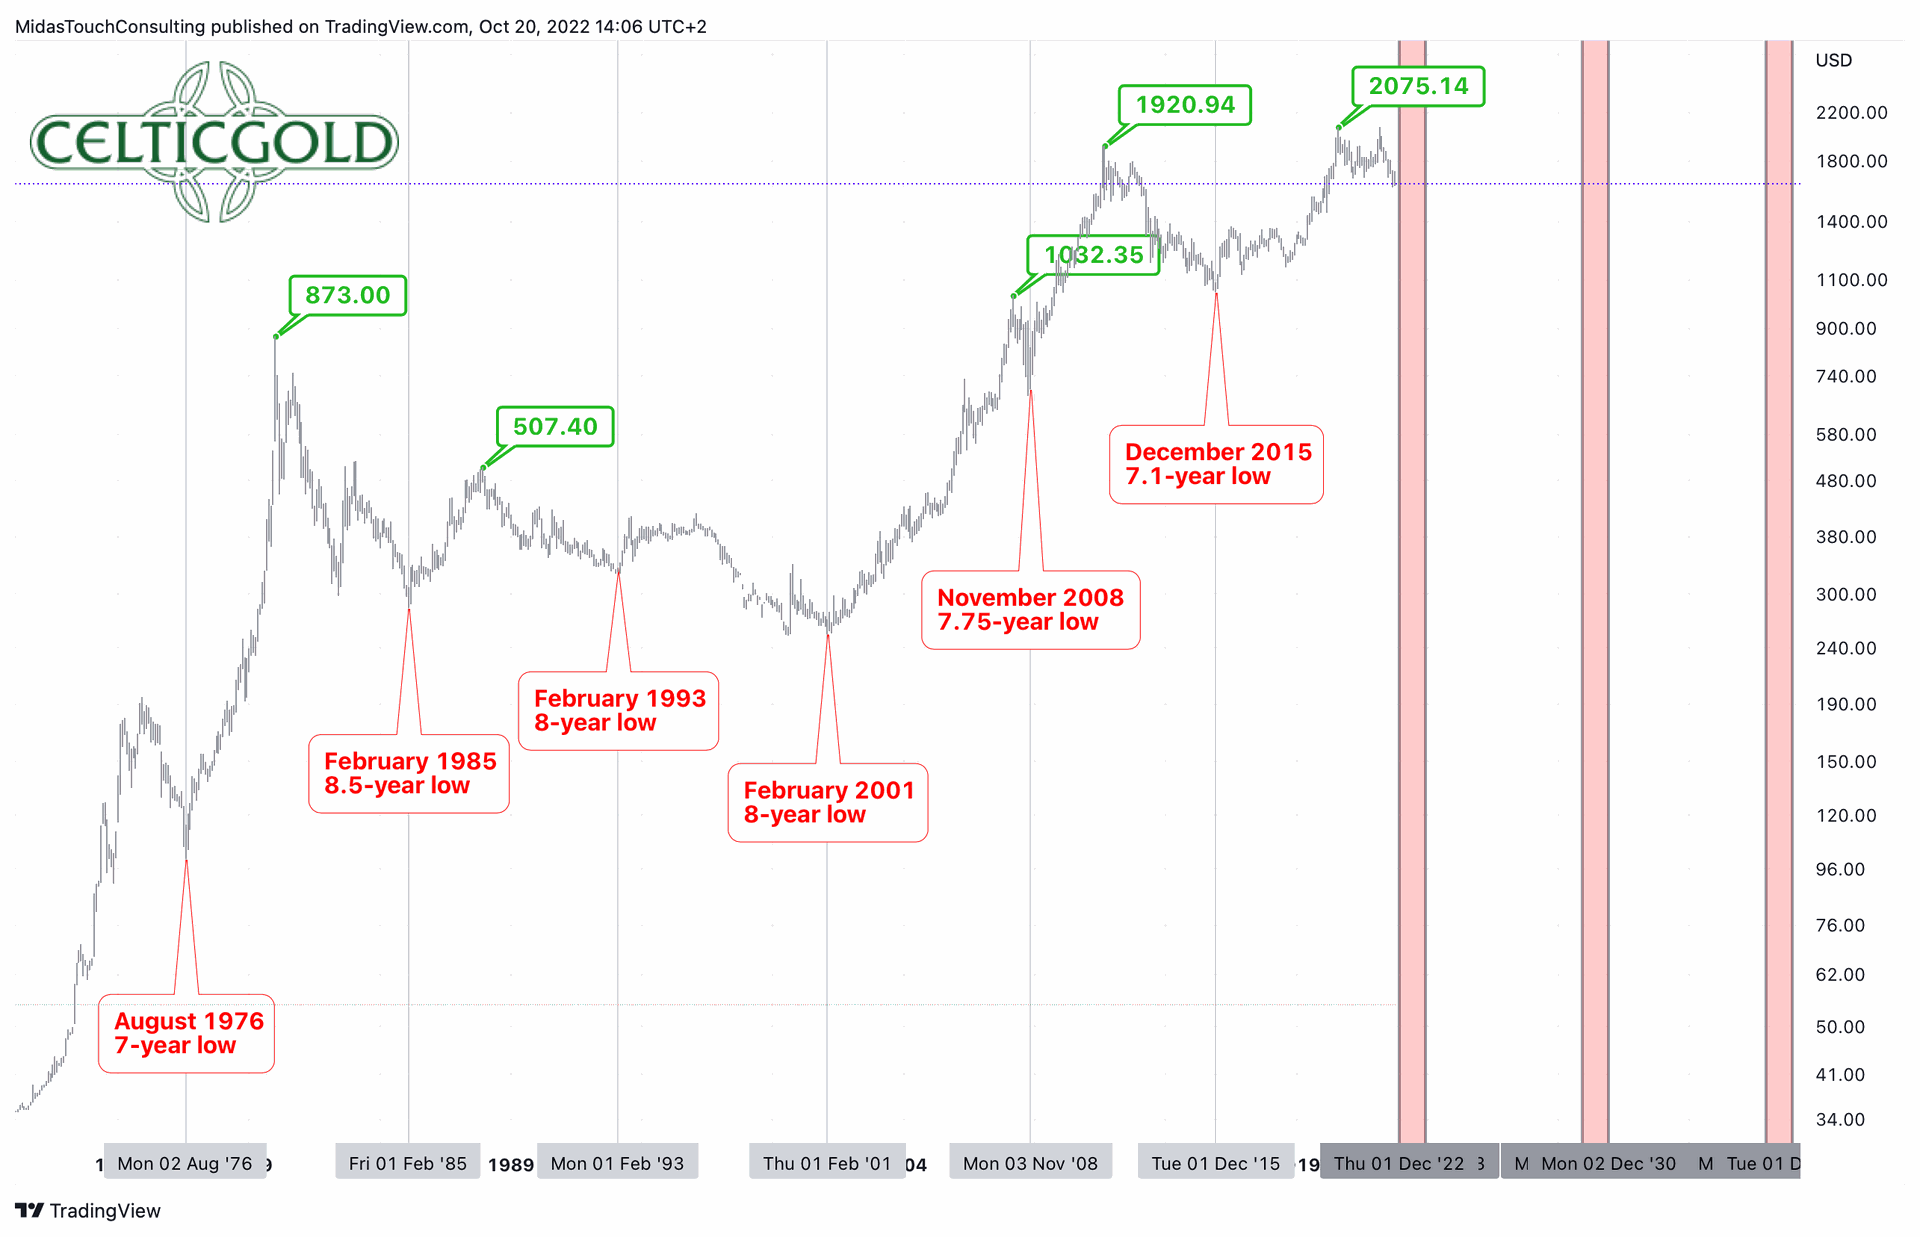 Gold in US-Dollar, monthly chart as of October 20th, 2022. Source: Tradingview
In the bigger picture, gold is on its way to its typical 8-year low, due sometime between December 2022 and December 2023. With any luck, the U.S. interest rate decision on December 14th could already bring the reversal of the downtrend and the beginning of the next big upward wave in the gold market. But even if the final low does not materialize until later next year, the long-term outlook for gold remains very promising. We suspect that in the next bull market wave, price increases of between 100% and 600% are very possible.
However, all this is still pie in the sky, because in the short term, all markets remain under enormous selling pressure. Gold is currently looking for a bottom just above 1,600 USD. Should the zone between 1,600 and 1,625 USD be able to fend off the ongoing bearish attacks, a double low should initiate a larger recovery towards 1,680 USD and possibly even 1,800 USD. Both sentiment and COT data, as well as the oversold market conditions, argue in favor of this. Alternatively, there will be a slide below 1,600 until mid-December, although gold prices are then unlikely to fall significantly below 1,550 USD.
In the long term, a remaining downside risk of maybe USD 100 is currently standing against a potential reward of at least 1,000 USD and more.
Analysis initially published on October 20th, 2022, by www.celticgold.de. Translated into English and partially updated on October 21st, 2022.
Feel free to join us in our free Telegram channel for daily real time data and a great community. If you like to get regular updates on our gold model, precious metals and cryptocurrencies you can also subscribe to our free newsletter.
Disclosure: This article and the content are for informational purposes only and do not contain investment advice or recommendations. Every investment and trading move involves risk, and readers should conduct their own research when making a decision. The views, thoughts and opinions expressed here are the author’s alone. They do not necessarily reflect or represent the views and opinions of Midas Touch Consulting.
About the Author: Florian Grummes
Florian Grummes is an independent financial analyst, advisor, consultant, trader & investor as well as an international speaker with more than 20 years of experience in financial markets. He is specialized in precious metals, cryptocurrencies, and technical analysis. He is publishing weekly gold, silver & cryptocurrency analysis for his numerous international readers. He is also running a large telegram Channel and a Crypto Signal Service. Florian is well known for combining technical, fundamental and sentiment analysis into one accurate conclusion about the markets.