1. Review
Over the past two weeks, the gold market has seen two attacks on the September 28th low at 1,614 USD. However, both times (October 21st and November 3rd), gold turned upwards again at 1,617 USD. Hence, the bears have not managed to make a new low nor any progress on the downside despite the strength of the US dollar and US real interest rates now being positive while US monetary policy remains very restrictive. Instead, for the third time, gold is staging a temporary recovery at least.
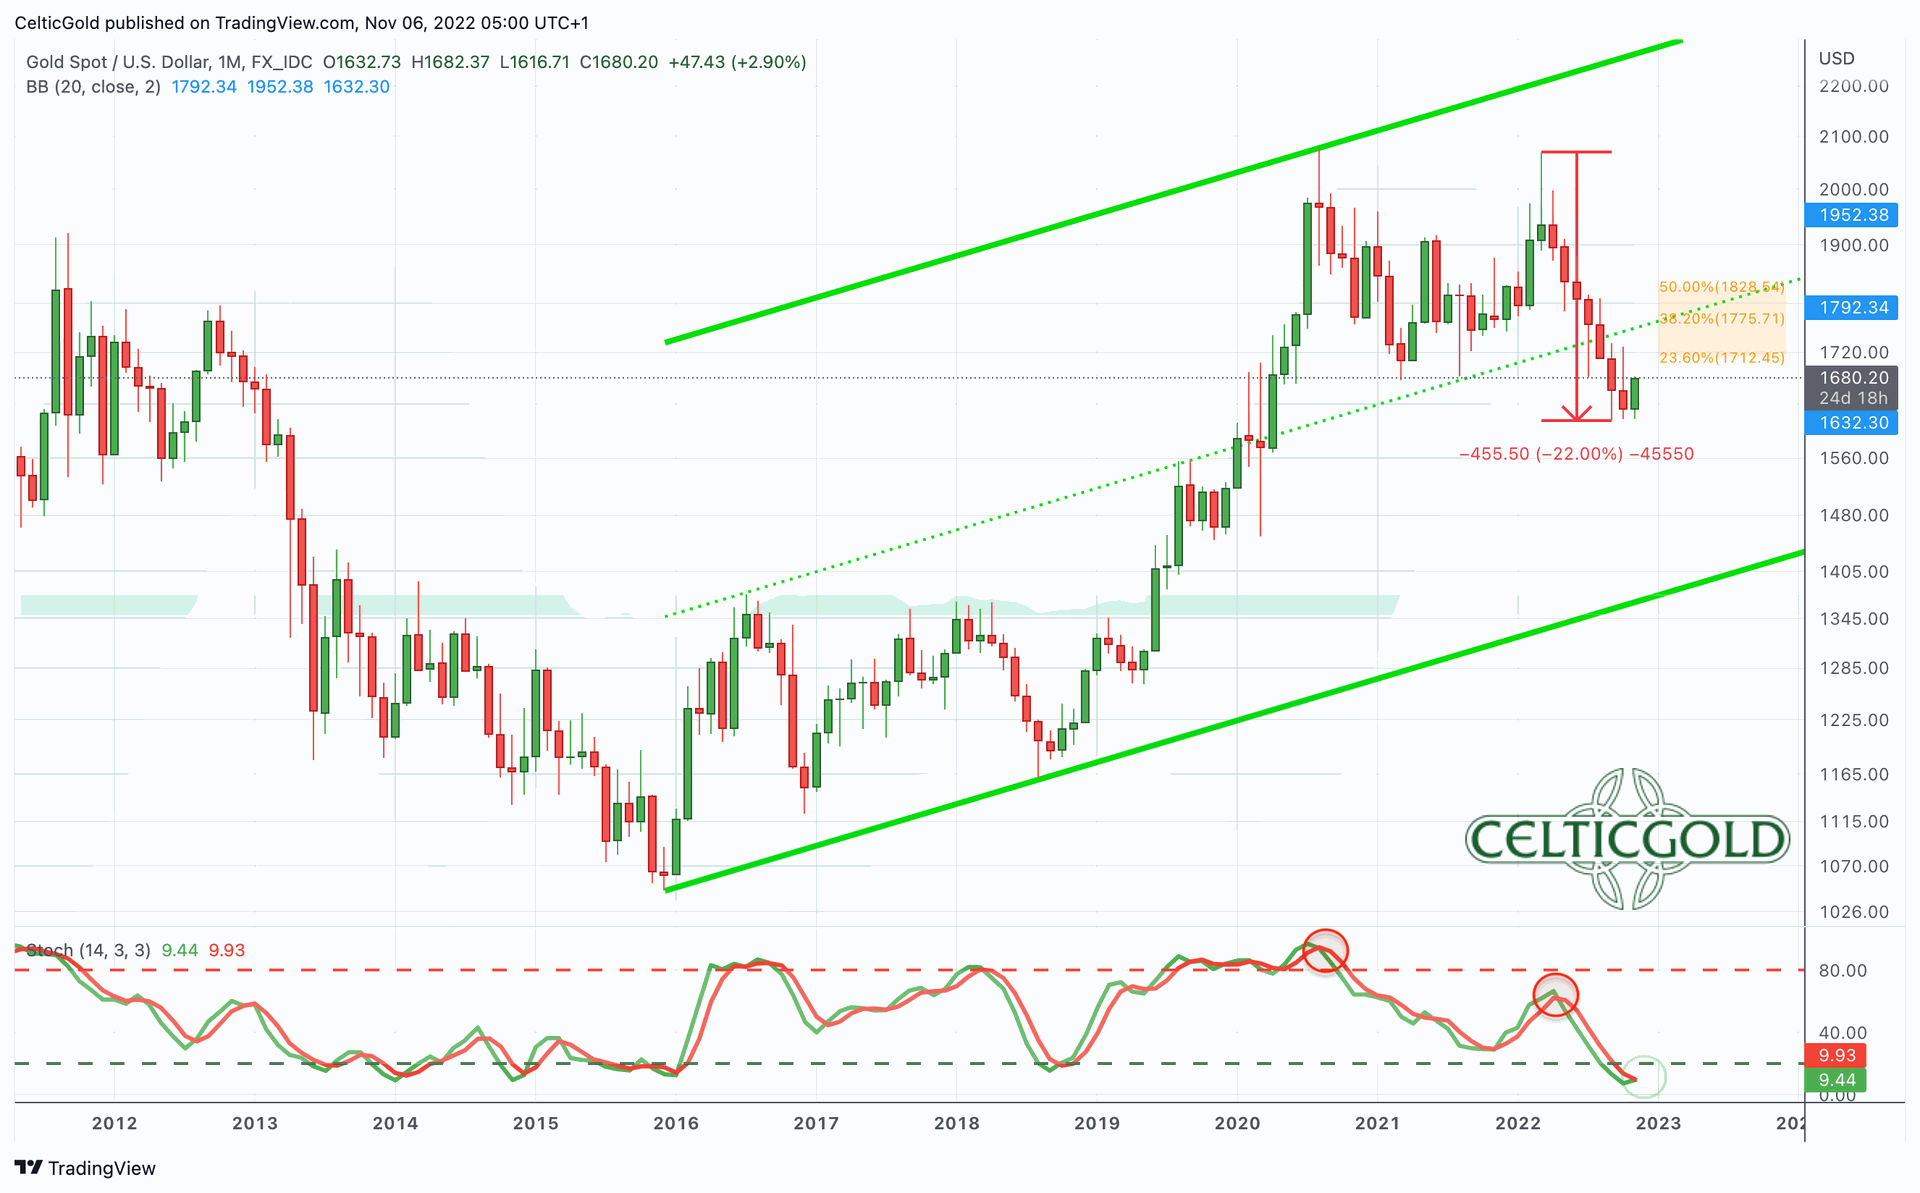 Gold in US-Dollar, monthly chart as of November 4th, 2022. Source: Tradingview
Of course, with each attack the support around 1,615 USD becomes more permeable and fragile. At the same time, gold has been correcting since its high on March 8th at USD 2,070 for eight months in a row, which means that there are seven red candles in a row on the monthly chart. This is a unique losing streak in the history of modern gold trading.

Overall, nothing has changed in the bearish setup for financial markets. The continued strength of the US dollar, combined with rising US interest rates, are putting all asset classes under severe pressure and dwindling liquidity. It is a vicious cycle that is likely to continue until credit markets freeze completely and the Federal Reserve is then forced to make a radical change in their monetary policy.
Nevertheless, financial markets have been able to stabilise since the end of September and mid-October and are currently trying to continue their recovery into the midterm elections.
2. Technical Analysis for Gold in US Dollars
2.1 Weekly chart: Clearly oversold
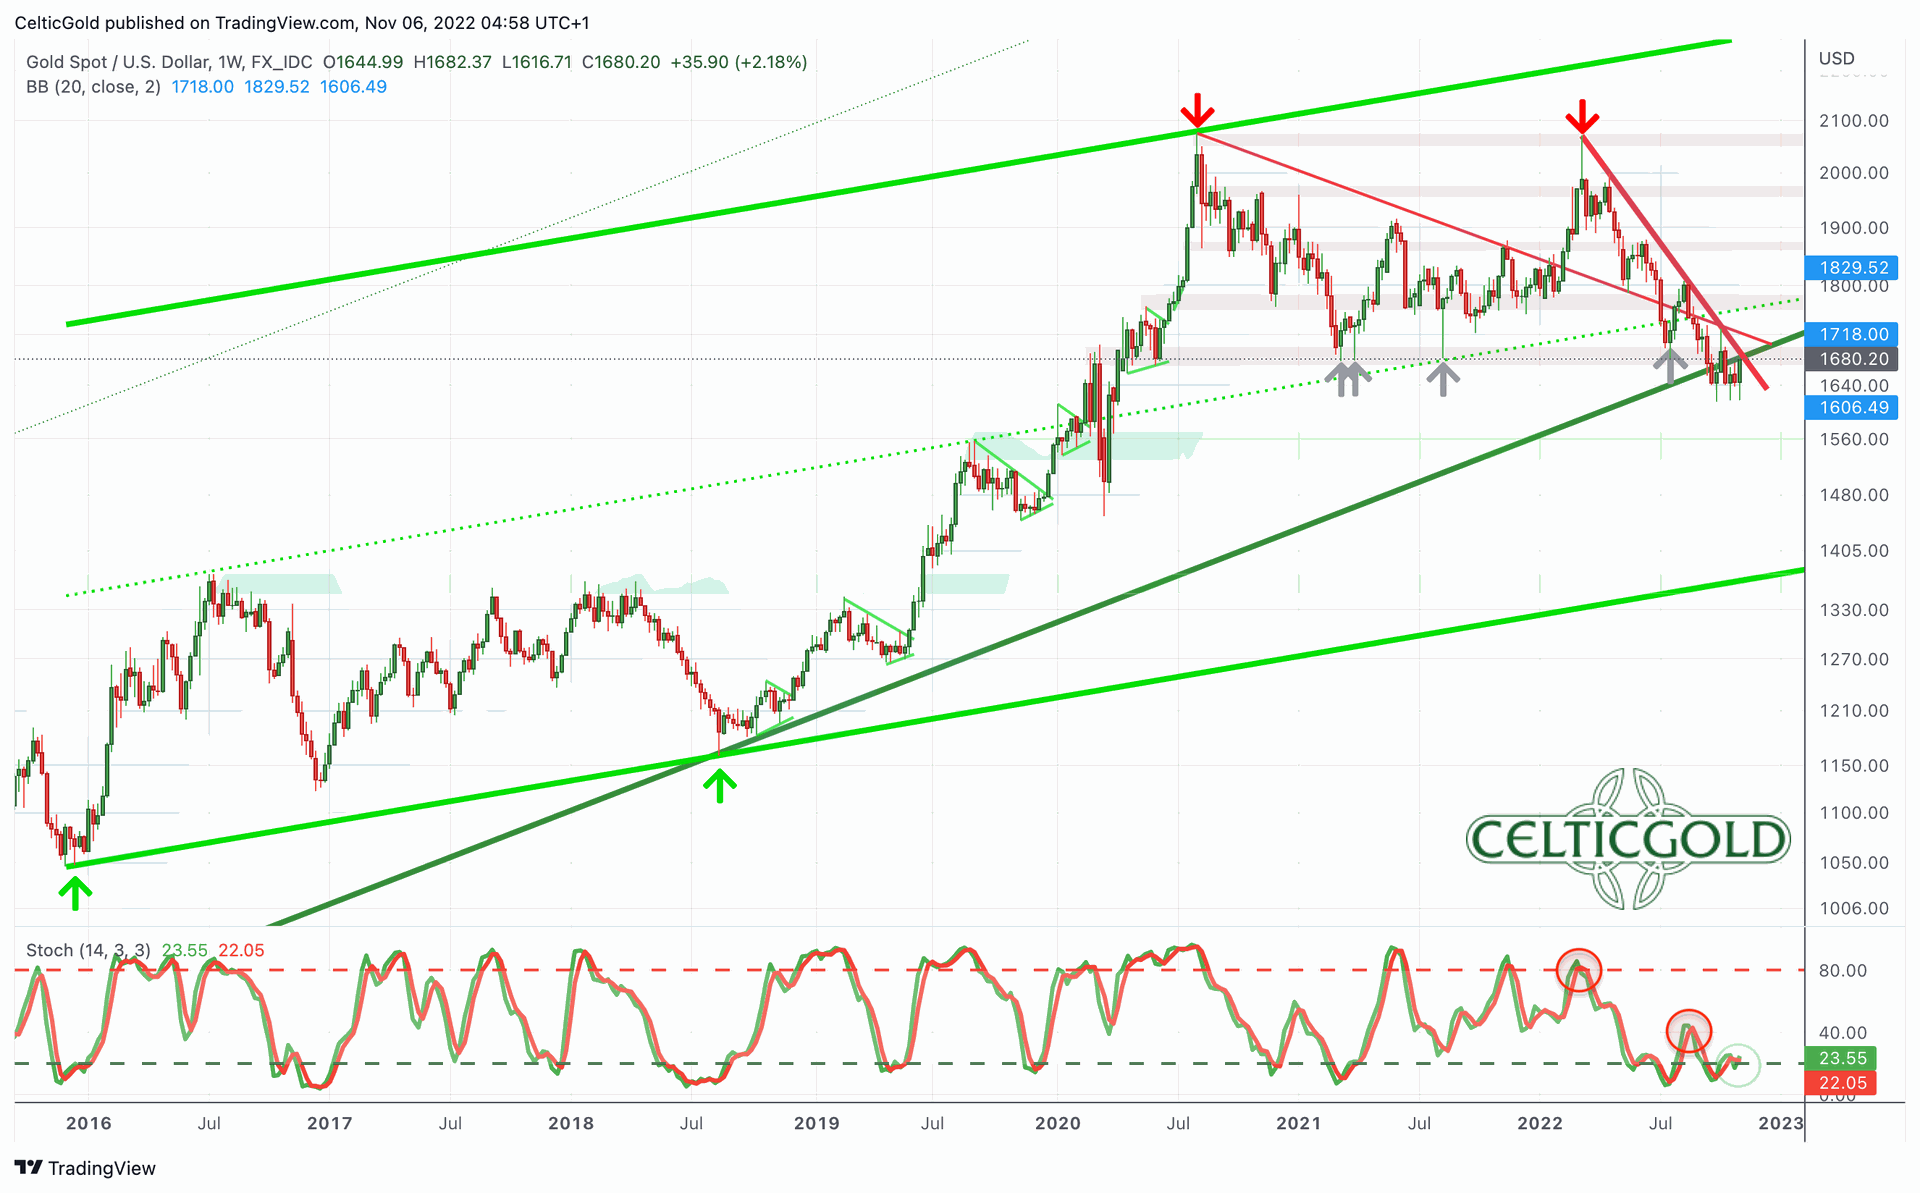 Gold in US-Dollar, weekly chart as of November 4th, 2022. Source: Tradingview
Since mid-September, gold has been trading primarily between 1,680 USD and 1,615 USD. On the weekly chart, the long-term upward trend was undercut with this sideways consolidation. However, this did not trigger another price slide. At the same time, the stochastic oscillator is clearly oversold and is showing the first positive divergences. This is slowly but surely indicating a bottoming process.
Nevertheless, should the support around 1,615 USD be clearly broken, these considerations will no longer apply, and gold is likely to be pushed lower towards the next support zone between 1,550 USD and 1,575 USD.
Overall, the weekly chart is increasingly neutral, allowing the formation of a bottom in the coming weeks. However, gold only becomes bullish above 1,680 USD and especially above 1,730 USD. In that case, chances for a recovery rally towards the upper weekly Bollinger Band (1,830 USD) would increase dramatically.
2.2 Daily chart: Support around 1,615 USD holds for the 3rd time
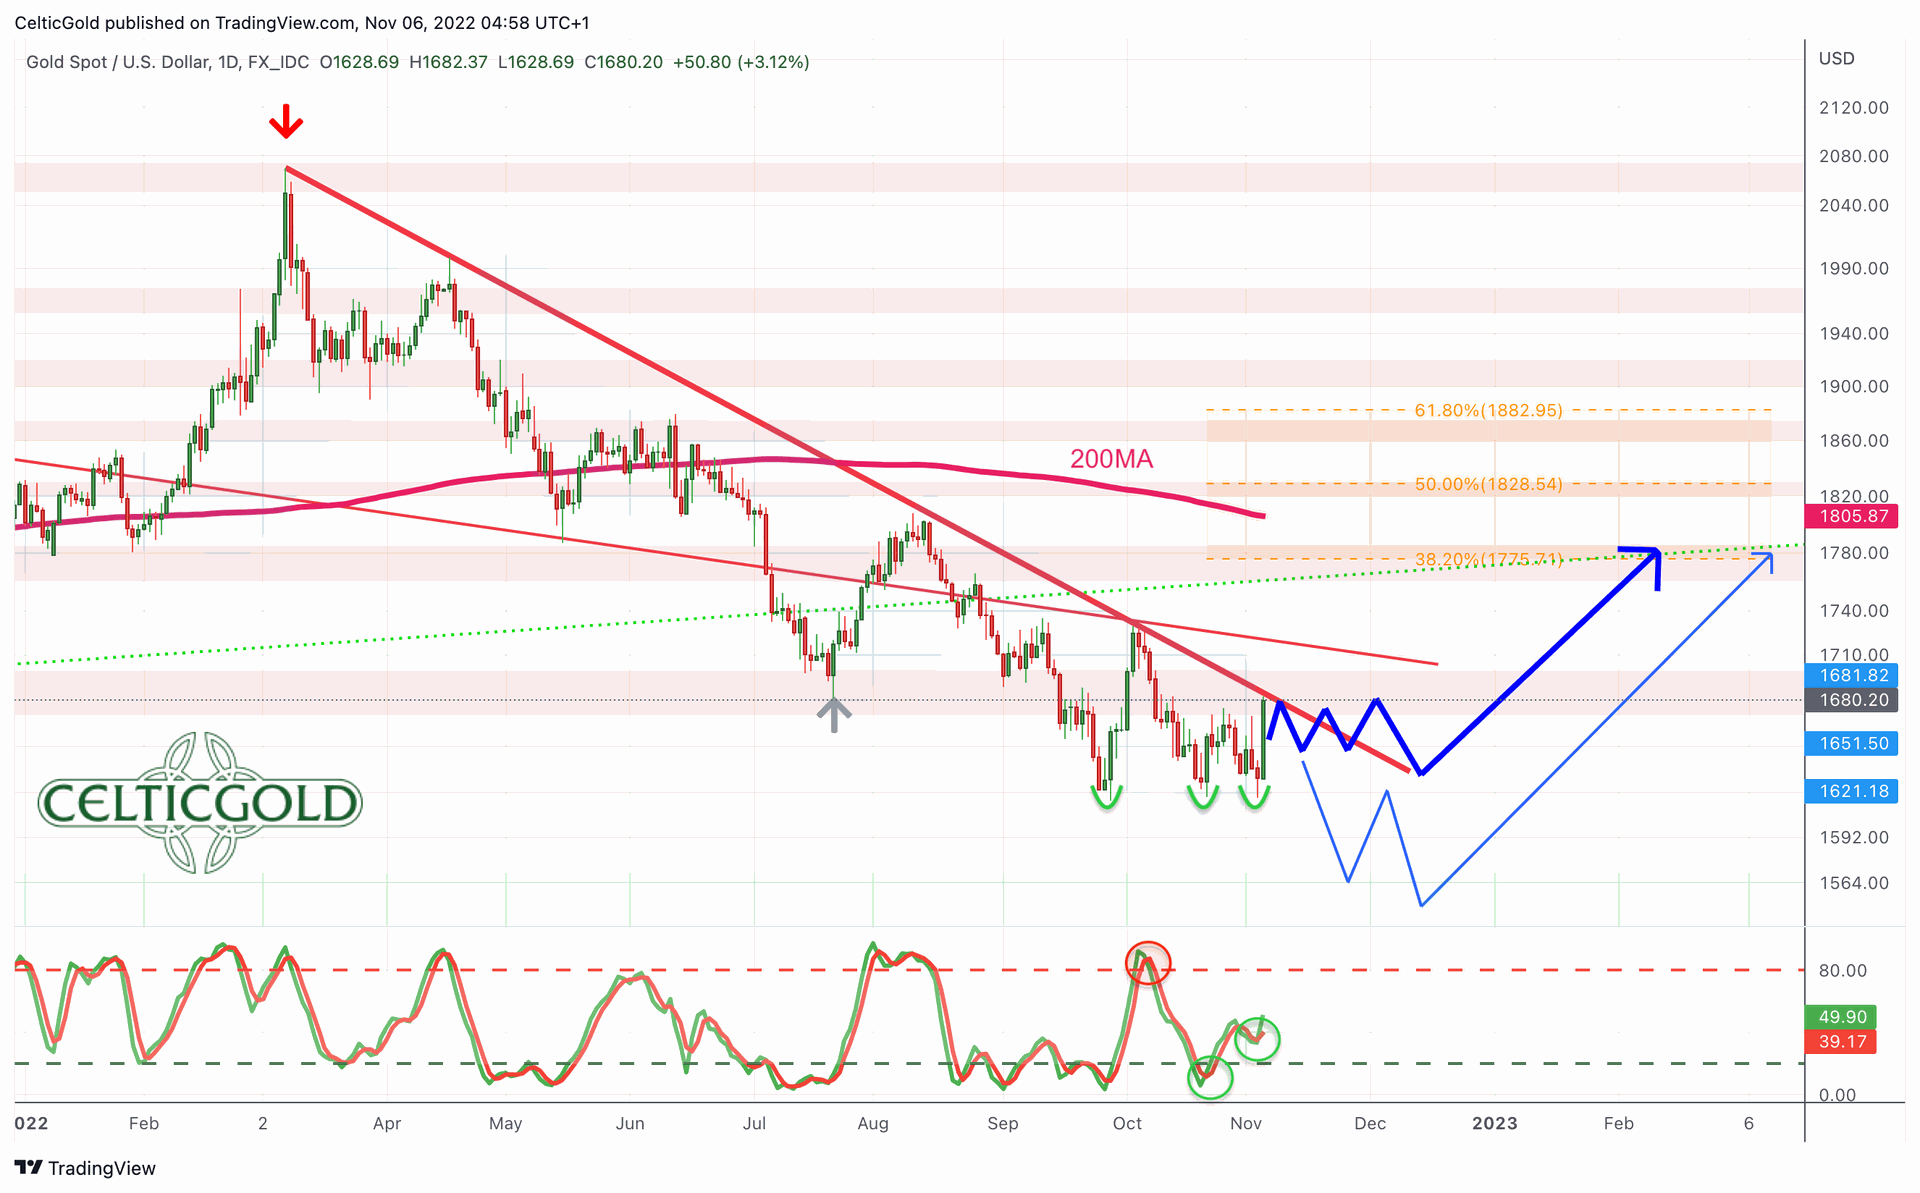 Gold in US-Dollar, daily chart as of November 4th, 2022. Source: Tradingview
On the daily chart, gold bulls were able to defend the 1,615 USD mark for the third time and prices have bounced sharply upwards again. The stochastic oscillator also has an active buy-signal. However, the upper Bollinger Band (1,679 USD) along with the resistance zone around 1,680 USD are a tough nut to crack. Therefore, it could well take a few attempts until mid-December before the gold price could break out of its suspected bottoming zone to the upside. Once 1,680 USD is cleared, a rally towards the falling 200-day moving average (1,805 USD) should then be expected.
Below 1,615 USD, on the other hand, the bearish alternative scenario takes effect, which currently has a lower probability. The bears would bend down the lower Bollinger Band (USD 1,622) and once again ignite significant selling pressure. While this is not impossible in the current environment, time is playing against the gold bears now.
All in all, the positive indications are increasing, and gold should at least be able to stabilize further over the coming weeks. However, a clear breakout is not (yet) the preferred scenario. Rather, a tricky and opaque bottom formation would be typical until mid-December. In view of the eight-month correction, however, a direct and sharp recovery to around 1,800 USD would also not be impossible. Anyway, it feels good to be bullish.
3. Commitments of Traders for Gold – Bottoming in progress
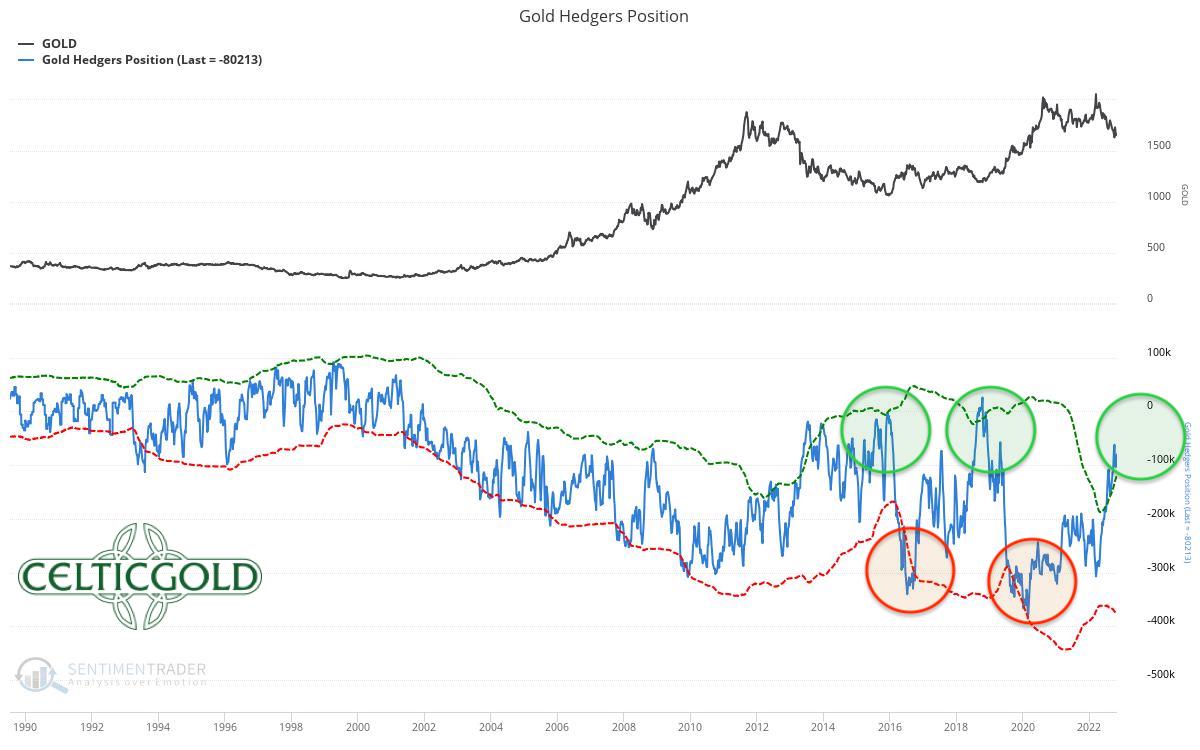 Commitments of Traders (COT) for Gold as of November 4th, 2022. Source: Sentimenttrader
According to the latest CoT report, the cumulative net short position of the commercial market participants came in at 80,213 short contracts as of October 25th. Below 100,000 short contracts one can speak of a sustainably bullish CoT report.
In summary, the CoT report can be classified as bullish.
4. Sentiment for Gold – Bottoming in progress
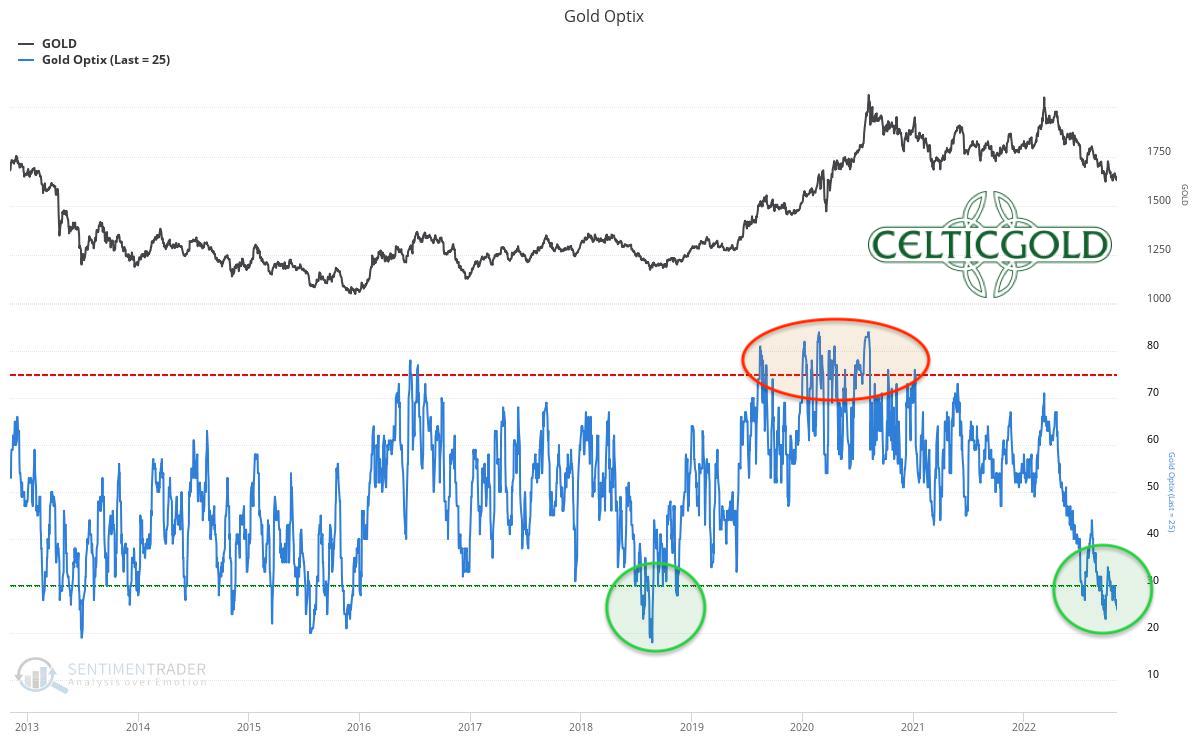 Sentiment Optix for Gold as of November 4th, 2022. Source: Sentimenttrader
Sentiment analysis continues to show that the vast majority of market participants is extremely pessimistic about gold. In fact, the mood is as bad as it was at the last big turning point in August 2018. Back then, the price of gold rose by almost 79% from the low at 1,160 USD to 2,075 in just two years USD. Therefore, in the medium and especially in the long term, this bombed-out sentiment lays the foundation for the next fulminant rise in the price of gold.
Overall, the sentiment traffic light is green and provides a strong contrarian buy signal!
5. Seasonality for Gold – Bearish until mid of December
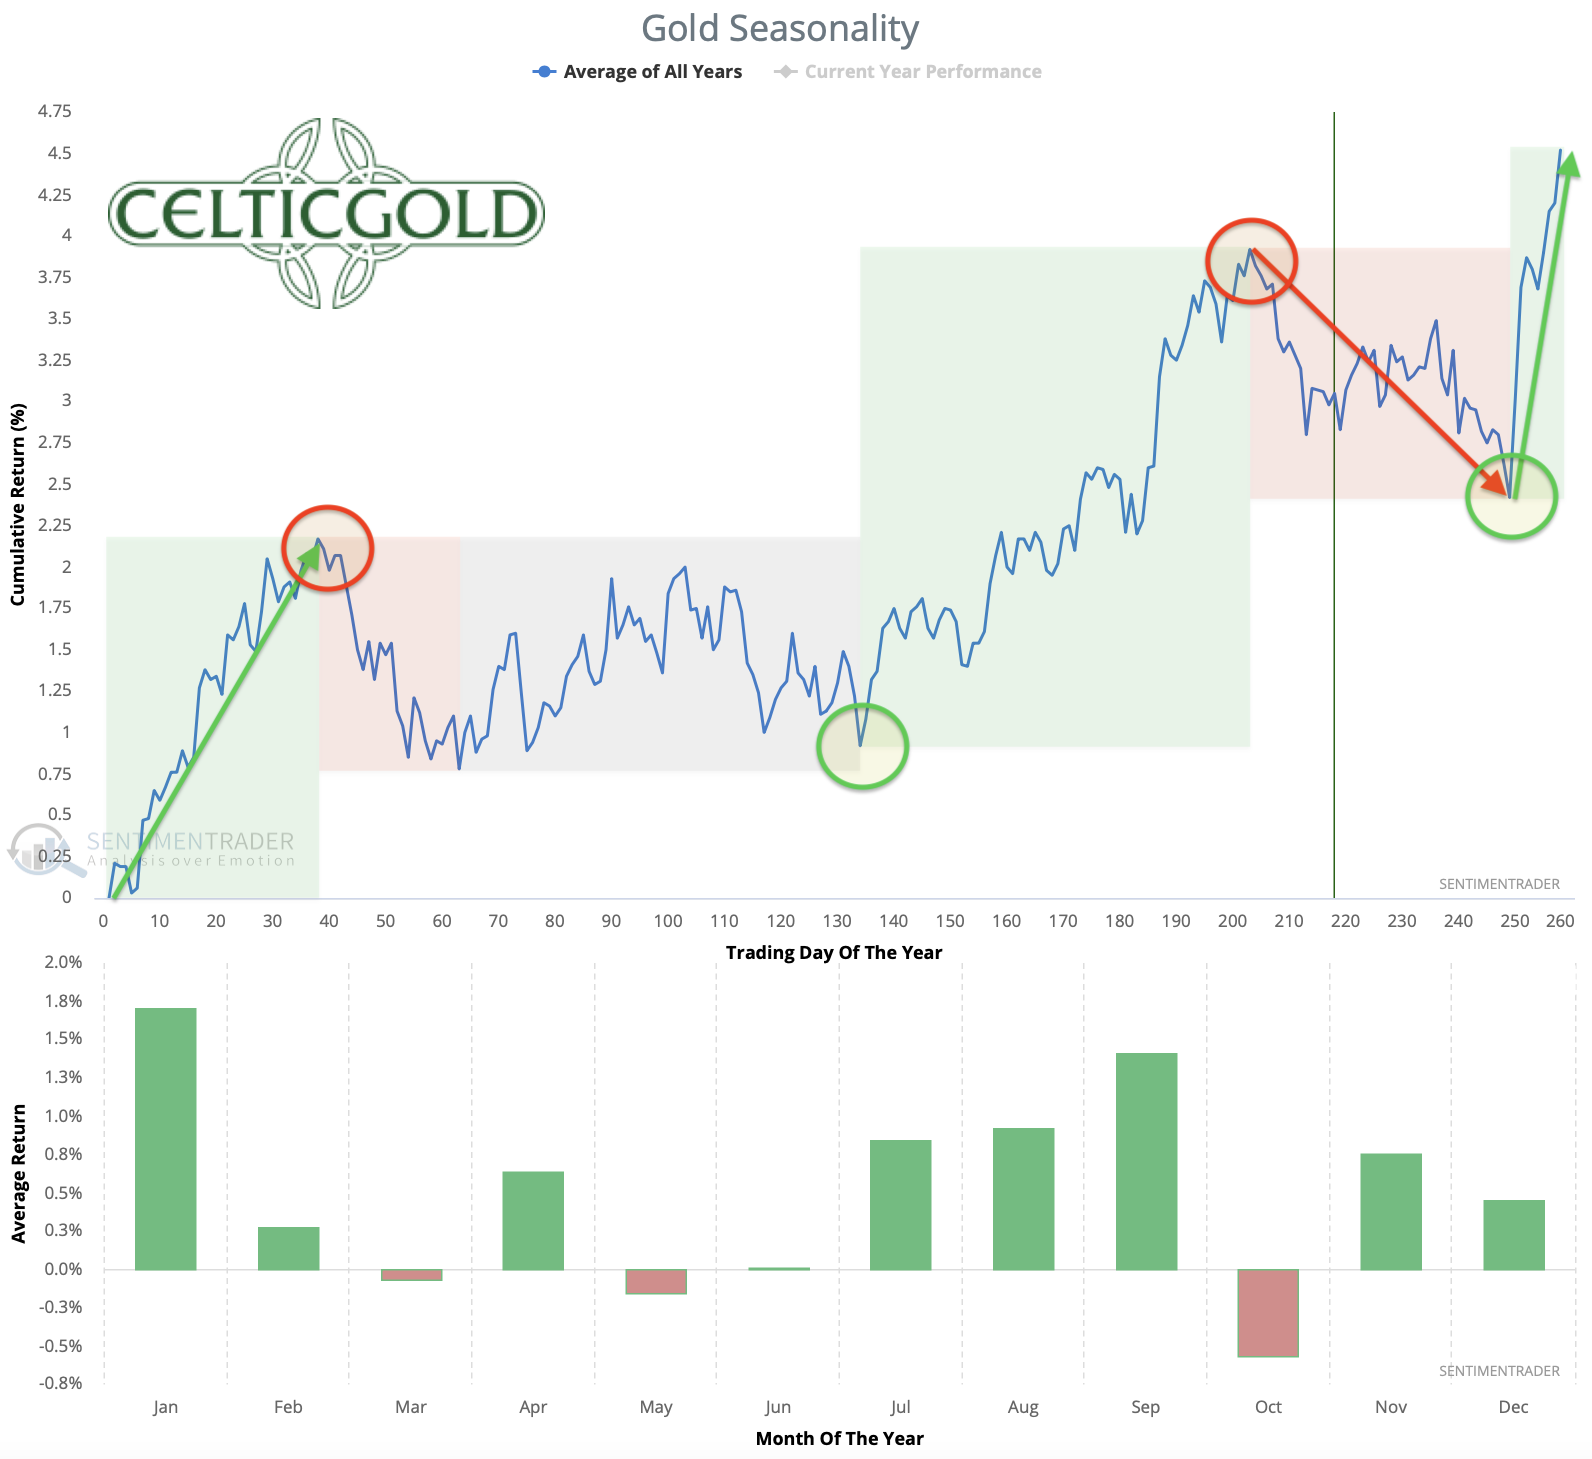 Seasonality for Gold over the last 54-years as of November 4th, 2022. Source: Sentimenttrader
From a seasonal perspective, gold is still around five weeks away from the typical trend reversal point just before the turn of the year. In 90% of the cases, a clear uptrend began from mid-December, around the last FOMC meeting of the year. Those rallies usually catapulted gold prices a good bit higher into most of February and March. The current negative phase would not be over until the US interest rate decision on December 14th though, and gold should statistically trade sideways or lower until then.
In summary, seasonality for gold and silver is currently still negative. From mid-December, however, this analysis component will move to a strong buy signal.
6. Macro update – Central Bank Gold Demand at 55-Year High
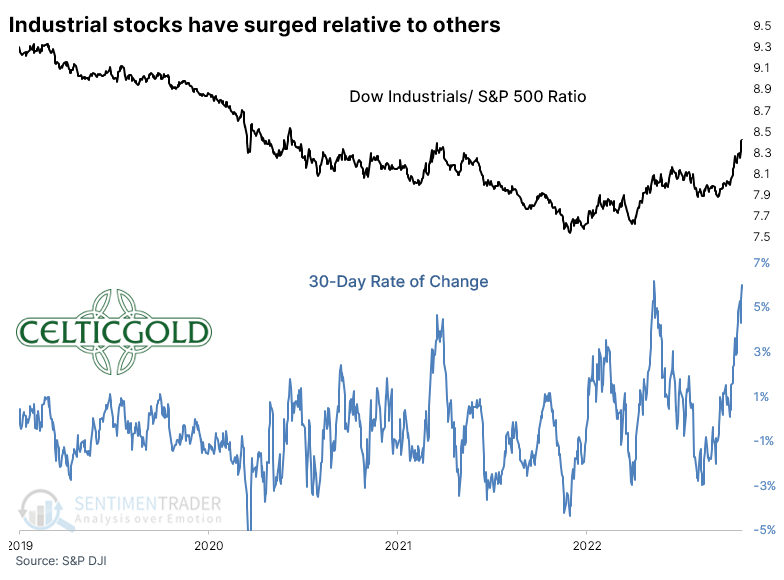
Dow Industrials/S&P 500-ratio as of November 1st, 2022. Source: Sentimenttrader
Although the latest FED interest rate decision came in as expected with an increase of 0.75%, Jerome Powell's subsequent comments caused another sell-off in the markets. Before that, stock markets, and the Dow Jones in particular, had been able to recover significantly over several weeks. However, Powell made it clear during his press conference that a change in the restrictive monetary policy is not planned any time soon. They rather want to continue with full force.
Gold responded to these statements with a sharp pullback from 1,668 to 1,617 USD within less than 17 hours. At the beginning of the new week, however, gold is trying to break out above 1,680 USD. And stock markets are also recovering strongly. The volatility remains high and wild swings in both directions are the order of the day. However, the markets now appear to be interpreting President Powell's statements quite differently.
However, the recovery that has started in the stock markets is likely to be driven primarily by the heavily oversold situation in October together with the bombed-out sentiment and in particular the extremely high short bets. This process (short squeeze) does not seem to be over yet and could bring further surprises to the upside.
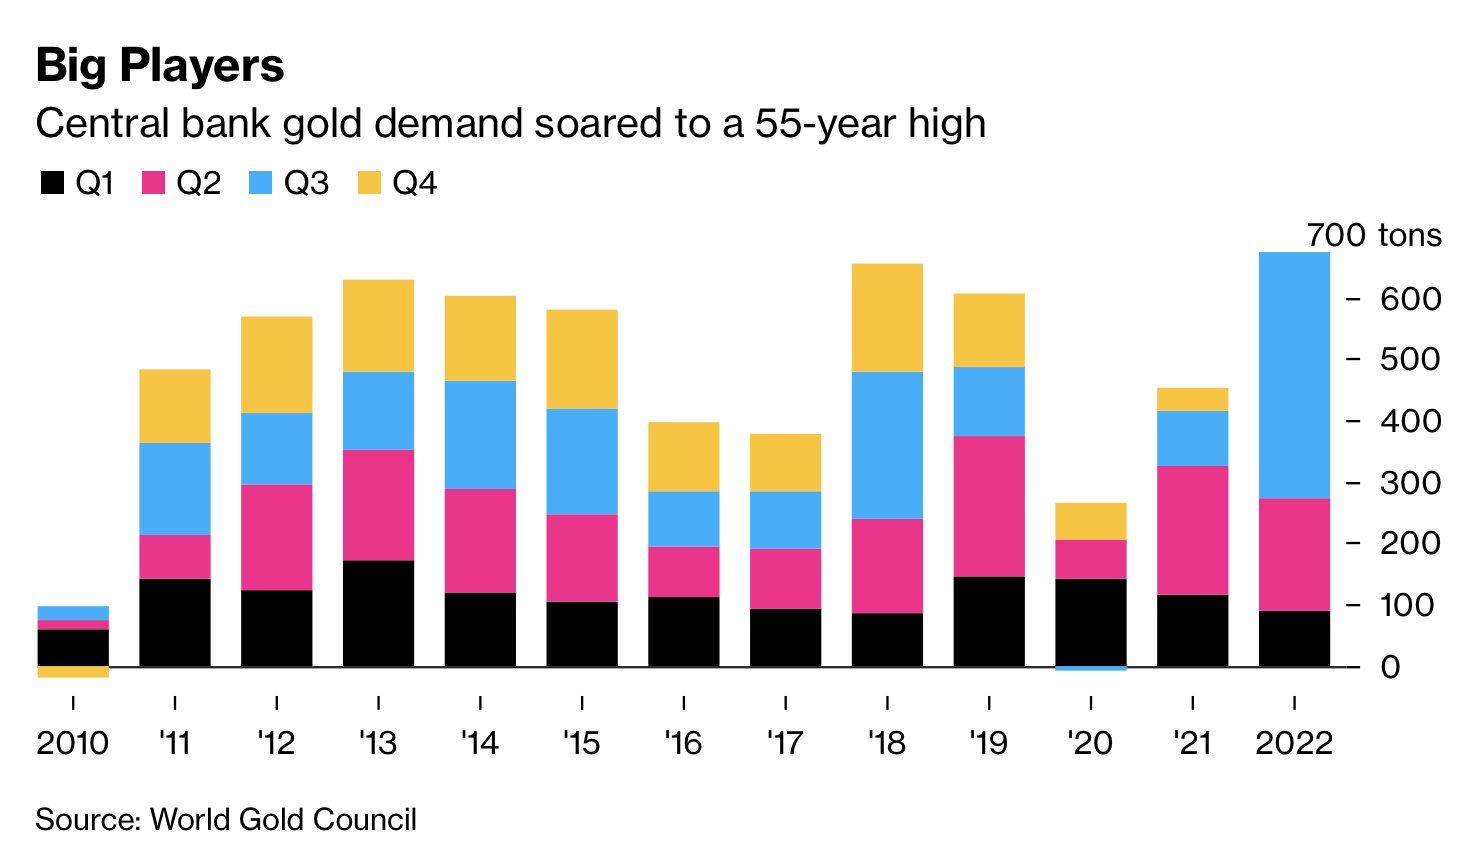 Central Bank Gold Demand, November 1st, 20222. Source: Bloomberg
In the gold market, on the other hand, there is an interesting and pretty important observation. Central banks bought almost 400 tons of gold in the third quarter 2022. This corresponds to more than four times the previous year's volume and means that the total amount of gold demanded by central banks this year is the highest it has ever been since 1967.
Apparently, the arsonists in the international central banks smelt the approaching fire before anyone else and are stocking up on gold. The last time the US markets were in such a precarious situation as today (1933 and 1971) a dramatic revaluation of gold followed within 24 months. This could explain why the price of gold did not fall much more sharply in this difficult environment and was able to hold around 1,620 USD again and again.
Overall, however, nothing has changed in the rather bearish setup for all financial markets. The hot air is slowly and painfully escaping from the biggest bubble of all time. It is anyone's guess how long the US Federal Reserve will be able to carry through its aggressive monetary policy. However, we continue to suspect that there will be a reversal and abrupt interest rate cuts as well as massive liquidity measures in the first half of 2023. Only a strong recovery by the end of the year could postpone the whole process until the second half of 2023.
7. Conclusion: Gold - Bottoming in progress
Shortly before the end of last week, gold got back on its feet. Now, the start of the new week looks promising and nourishes the chance for a breakout above the critical first resistance at 1,680 USD. The resilience around 1,615 USD to 1,620 USD in the last few weeks is impressive and is due to large institutional investors (central banks). This means that gold is likely in a bottoming phase and has been since the end of September. In the worst case scenario this process could last until mid-December. Alternatively, a weaker US dollar continues to trigger a short squeeze in the gold market, which could quickly push towards the 1,800 USD mark.
In the medium and especially long term, gold is searching for its typical 8-year low, which would be due sometime between December 2022 and December 2023. With a bit of luck, this major trend reversal will be successful by mid-December. Then, 2023 would be the beginning of the next big wave up in the gold market.
Analysis initially published on November 4th, 2022, by www.celticgold.de. Translated into English and partially updated on November 7th, 2022.
Feel free to join us in our free Telegram channel for daily real time data and a great community. If you like to get regular updates on our gold model, precious metals and cryptocurrencies you can also subscribe to our free newsletter.
Disclosure: This article and the content are for informational purposes only and do not contain investment advice or recommendations. Every investment and trading move involves risk, and readers should conduct their own research when making a decision. The views, thoughts and opinions expressed here are the authors alone. They do not necessarily reflect or represent the views and opinions of Midas Touch Consulting.
About the Author: Florian Grummes
Florian Grummes is an independent financial analyst, advisor, consultant, trader & investor as well as an international speaker with more than 20 years of experience in financial markets. He is specialized in precious metals, cryptocurrencies, and technical analysis. He is publishing weekly gold, silver & cryptocurrency analysis for his numerous international readers. He is also running a large telegram Channel and a Crypto Signal Service. Florian is well known for combining technical, fundamental and sentiment analysis into one accurate conclusion about the markets.