1. Review
Despite the crypto community eagerly anticipating the Bitcoin halving, the event itself did not lead to the hoped-for massive price surge. Instead, starting from the new all-time high of USD 73,793, a gradual downturn of about -23.3% from 14th March onwards evolved. While Bitcoin prices managed to hold more or less steadily above the USD 60,000 mark throughout most of April, the low was ultimately found at USD 56,500.
1.1 Dumb money too optimistic
Since then, Bitcoin, along with the stock markets, has experienced a rapid and significant recovery, reaching as high as USD 65,513. Whether the correction has indeed come to an end remains uncertain at present, though. While current prices around USD 62,000 have not managed to sustain the peak of the recovery, the short-term uptrend is slightly weakened but still intact.
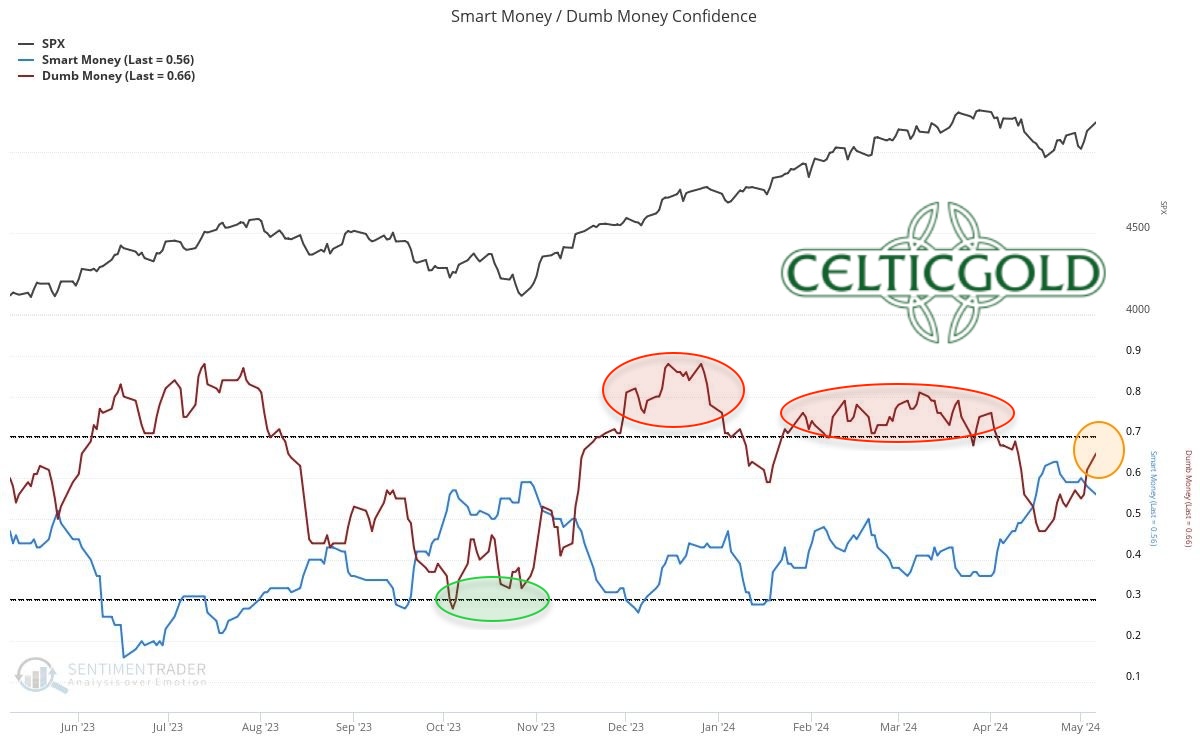
S&P500, Smart Money vs. Dumb Money, as of May 7th, 2024. Source: Sentimentrader
It remains noteworthy that the “smart money” in the US stock markets tends to utilise the high prices for selling, suggesting that the recovery there is likely purely technical. While “smart money” remains neutral overall, the “dumb money” has once again become very optimistic. Consequently, the upside potential seems to be quite limited in the coming months.
1.2 Bitcoin and Nasdaq are strongly correlated
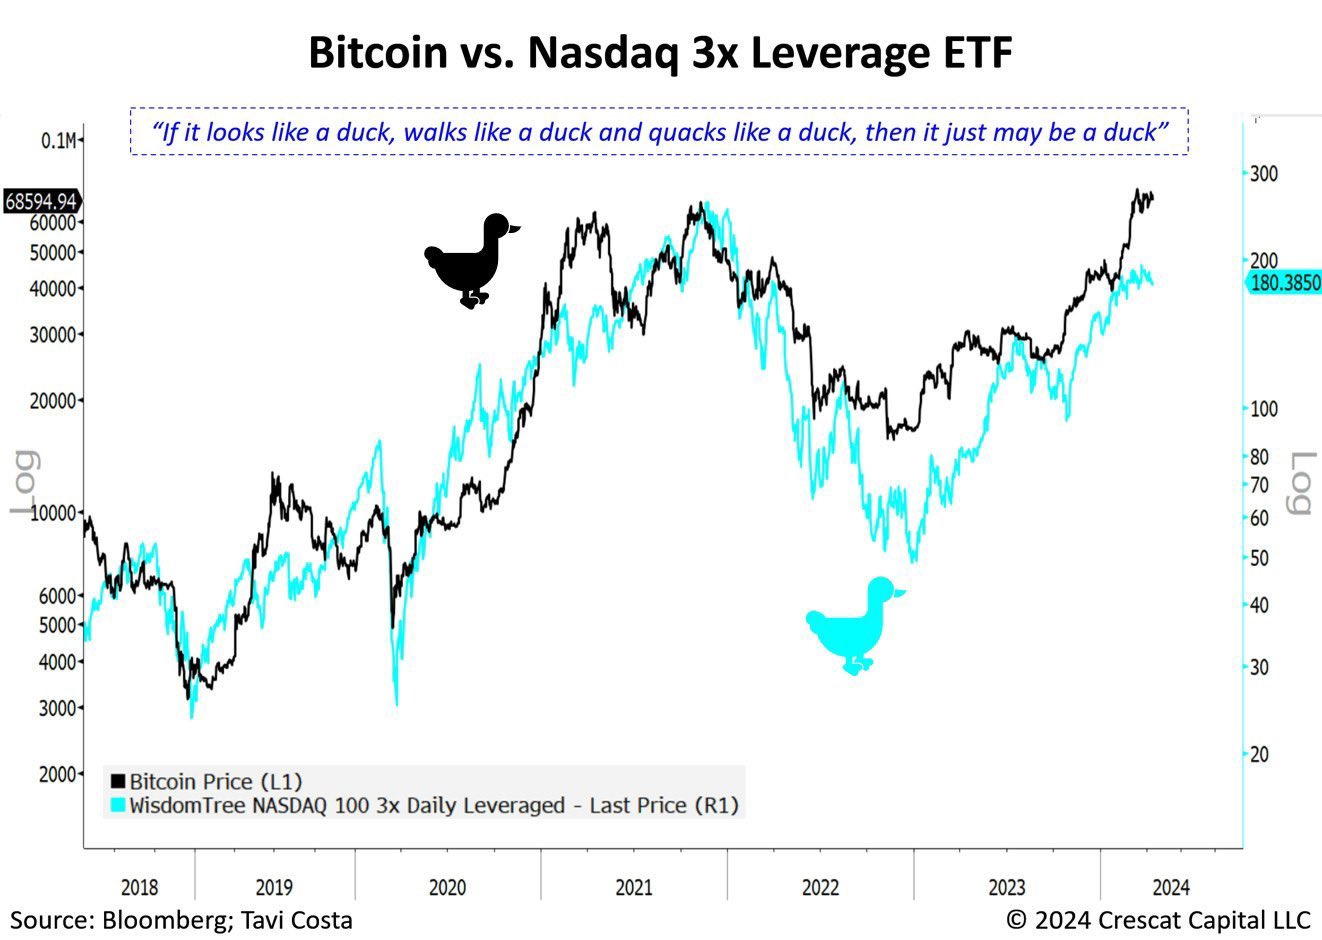
Bitcoin vs. Nasdaq, correlation as of April 18th, 2024. Source: Bloomberg, Tavi Costa
Given Bitcoin’s close correlation with the Nasdaq and the tech sector, similar conclusions can be drawn for the entire crypto sector!
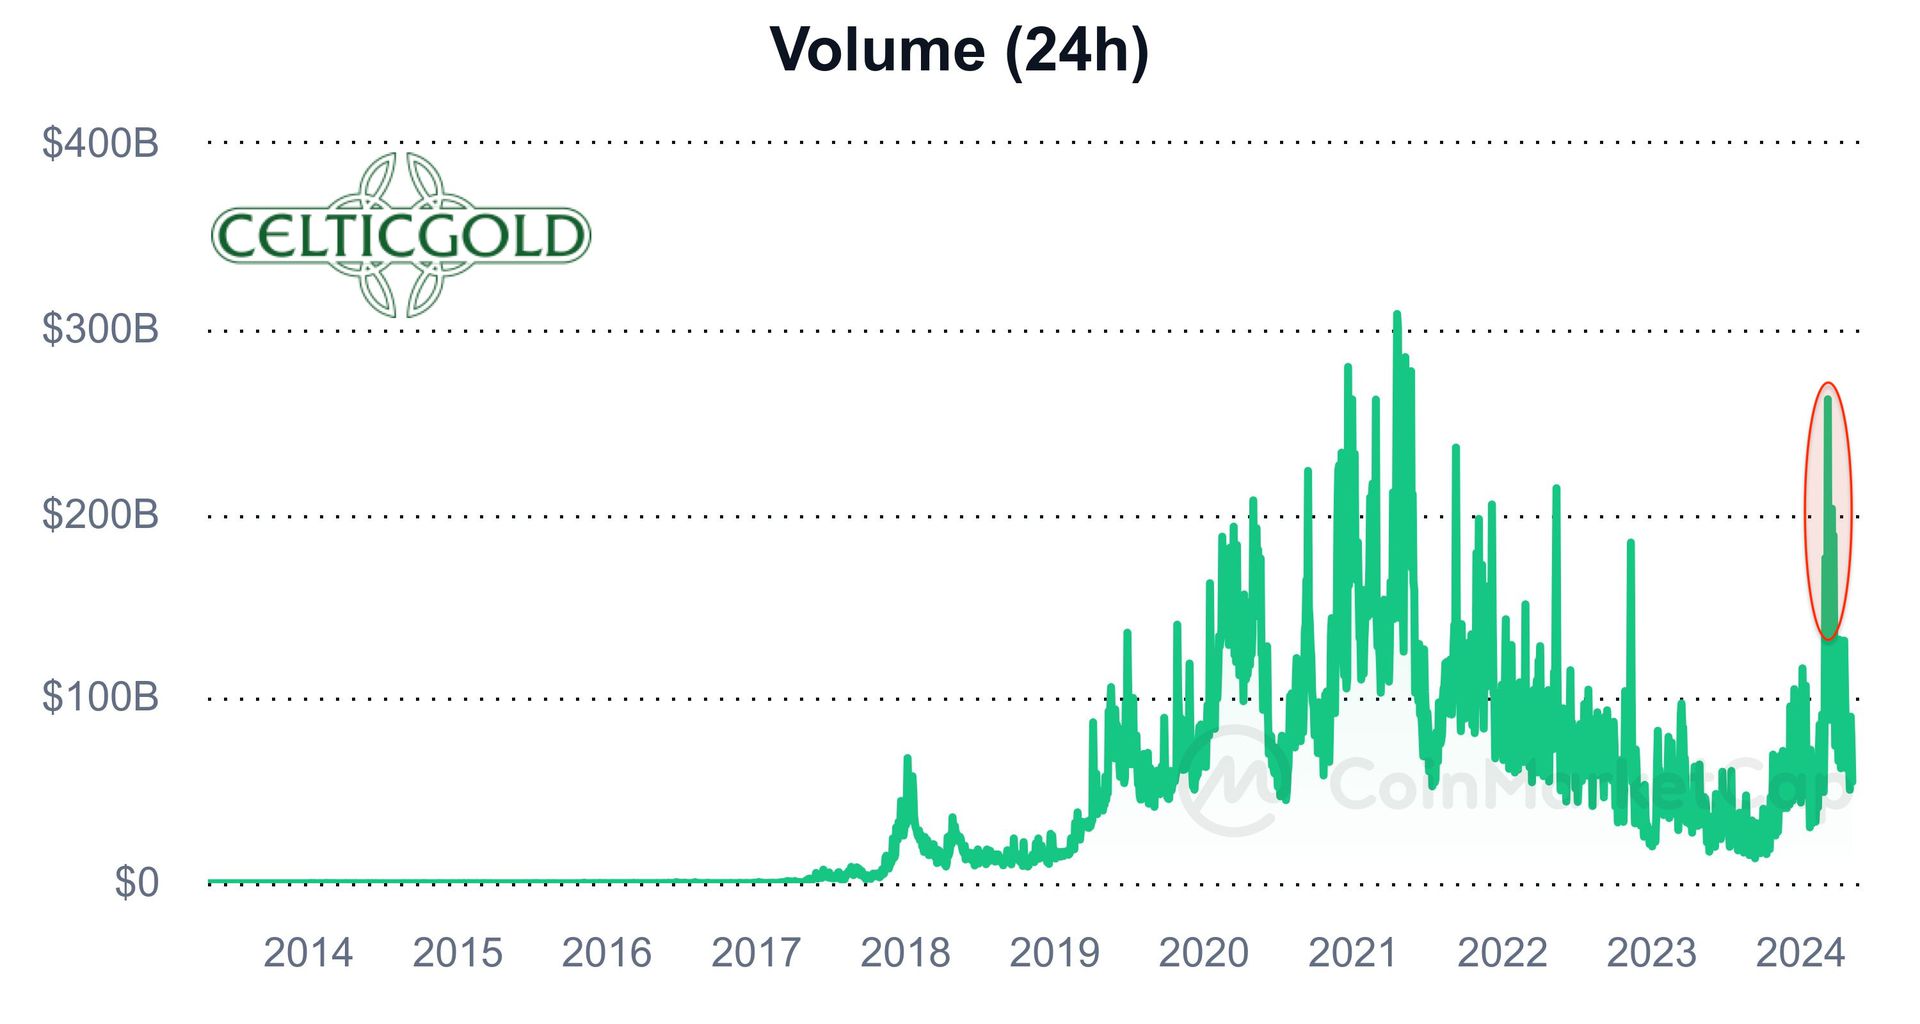
Bitcoin 24-hour trading volume, as of May 6th, 2024. Source: coinmarketcap
For instance, Bitcoin trading volume has significantly decreased following the ETF spike.
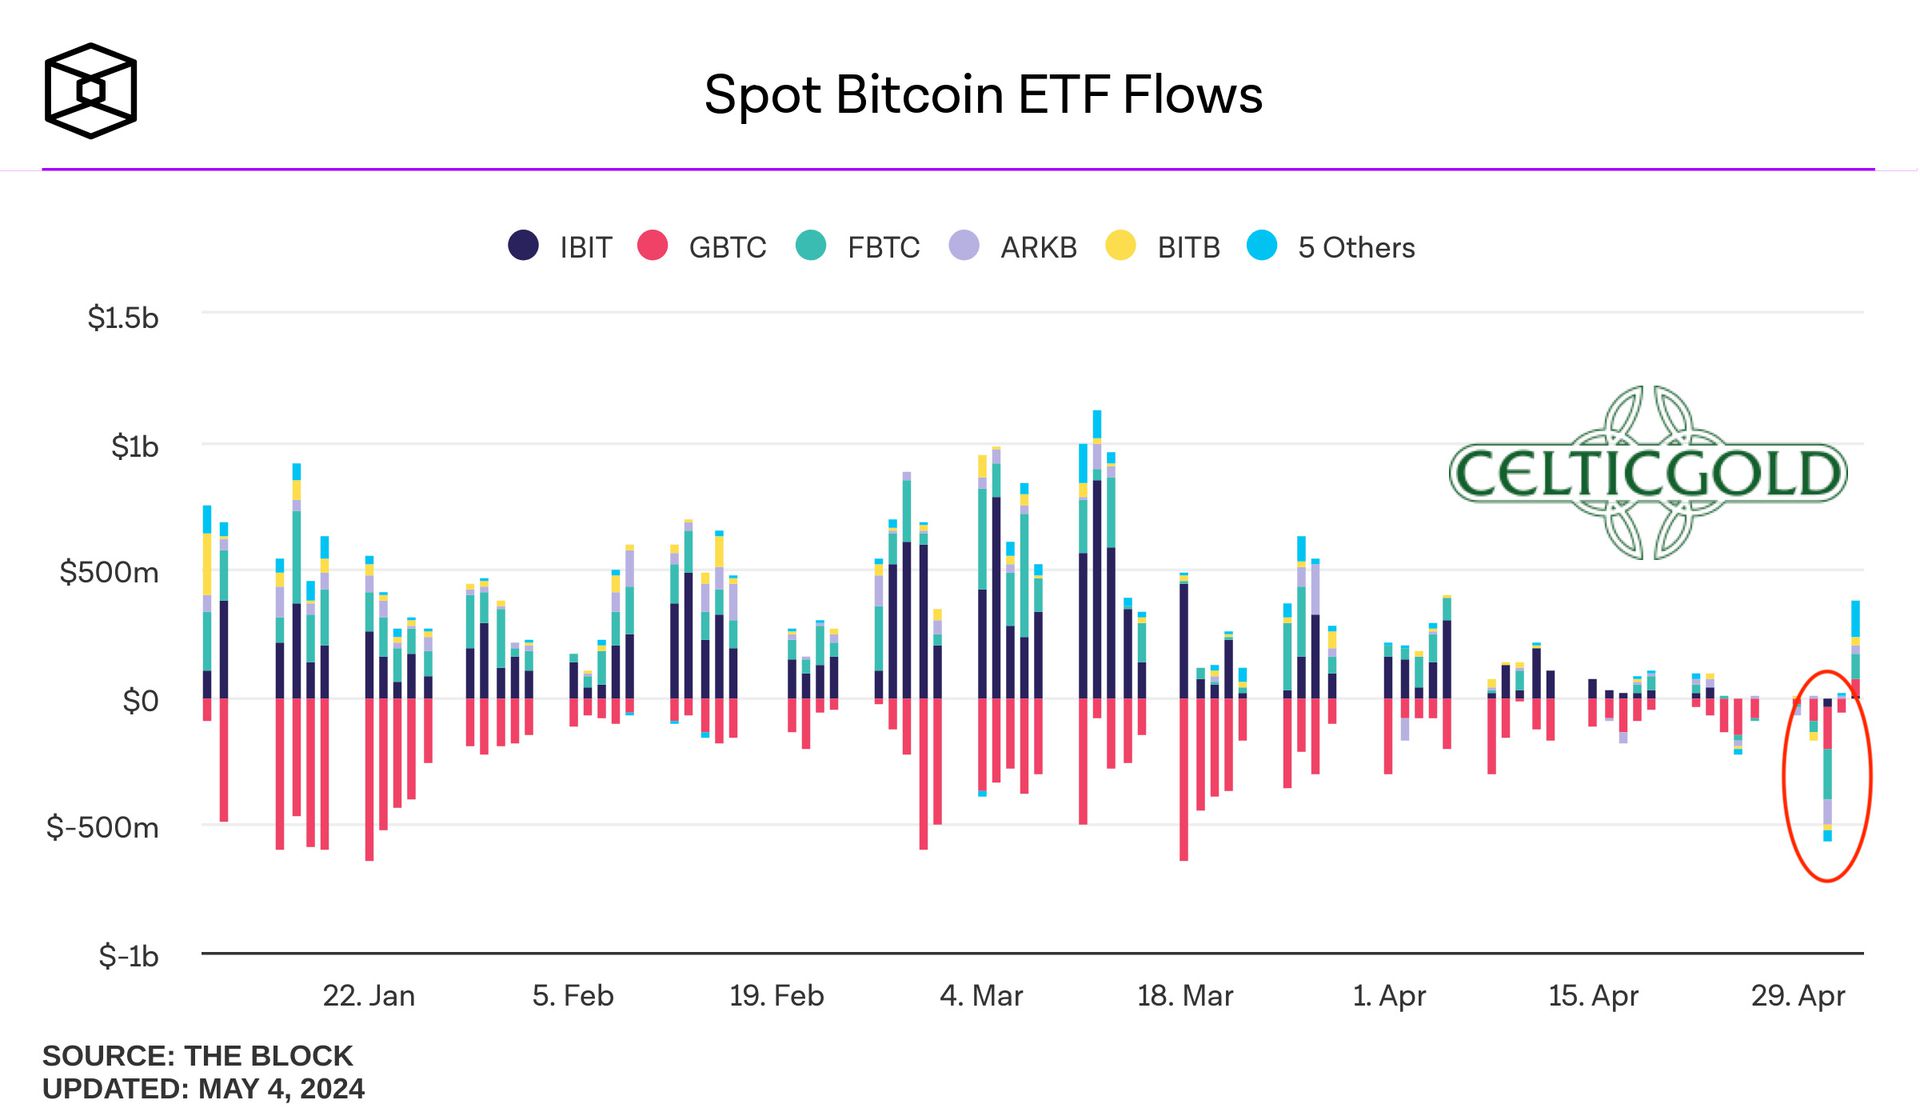
Spot Bitcoin ETF Flows, as of May 7, 2024. Source: The Block
Some Bitcoin ETFs even experienced strong outflows in the last week.
Without a liquidity event by central banks or a new narrative, both the stock markets and Bitcoin, and thus the entire crypto sector, are expected to face challenges in the seasonally weak summer phase.
Overall, our recent skeptical stance has been confirmed by the downturn, and we continue to speculate that the end of the correction for Bitcoin will likely not occur before September or October.
2. Technical Analysis for Bitcoin in US-Dollar
2.1 Bitcoin Weekly Chart – Sell signals are slowly increasing
Bitcoin in USD, weekly chart as of May 8th, 2024. Source: Tradingview
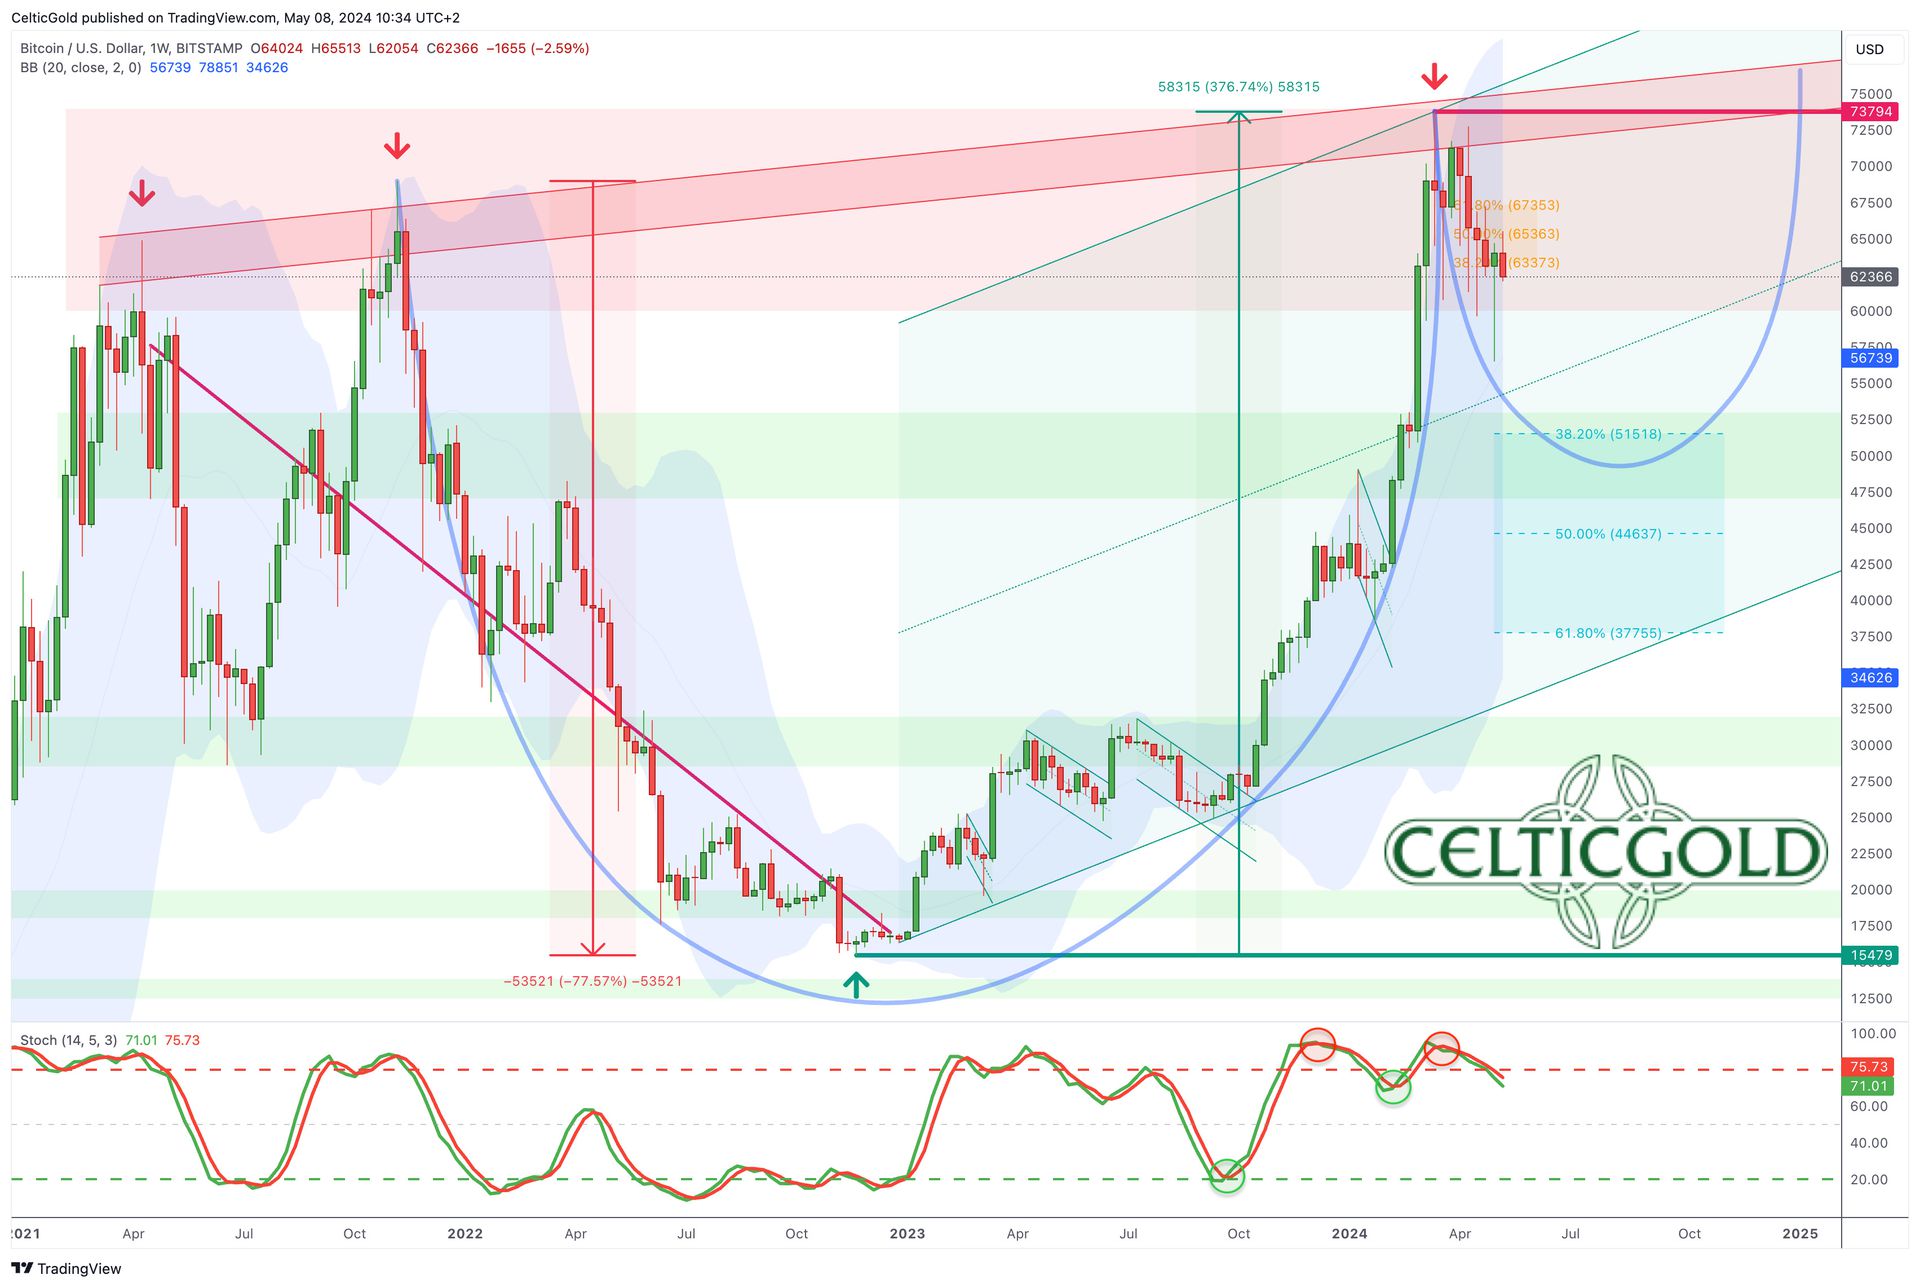
After a spectacular rise from USD 15,479 to USD 73,794 (+376.75%) within 15 months, Bitcoin has been undergoing a correction since 14th March. The classic 38.2% retracement at USD 51,518 has not been reached yet. However, the original support zone around USD 60,000 has already been weakened and is unlikely to withstand another bearish attack.
Similarly, the weekly stochastic has activated a selling signal, while the monthly stochastic is strongly overbought and in need of cooling off. The two Bollinger Bands are currently widely diverged, indicating further consolidation and correction needs.
If indeed a cup-and-handle formation is developing in the larger picture for Bitcoin, the completion of the handle is likely to require much more time and possibly deeper prices in the meantime.
Overall, the weekly chart is slightly bearish, although there are no strong sell signals yet. However, the situation has somewhat dimmed, and at least a pullback within the upper half of the uptrend channel to around USD 55,000 should be expected during the weaker summer months. If a typical retracement occurs within the handle to the 38.2% retracement, prices around USD 51,500 can be anticipated. On the upside, a weekly closing price above USD 74,000 is needed to clearly and definitively end the correction.
2.2 Daily Chart – Below the 50-day moving average
Bitcoin in USD, daily chart as of May 8th, 2024. Source: Tradingview
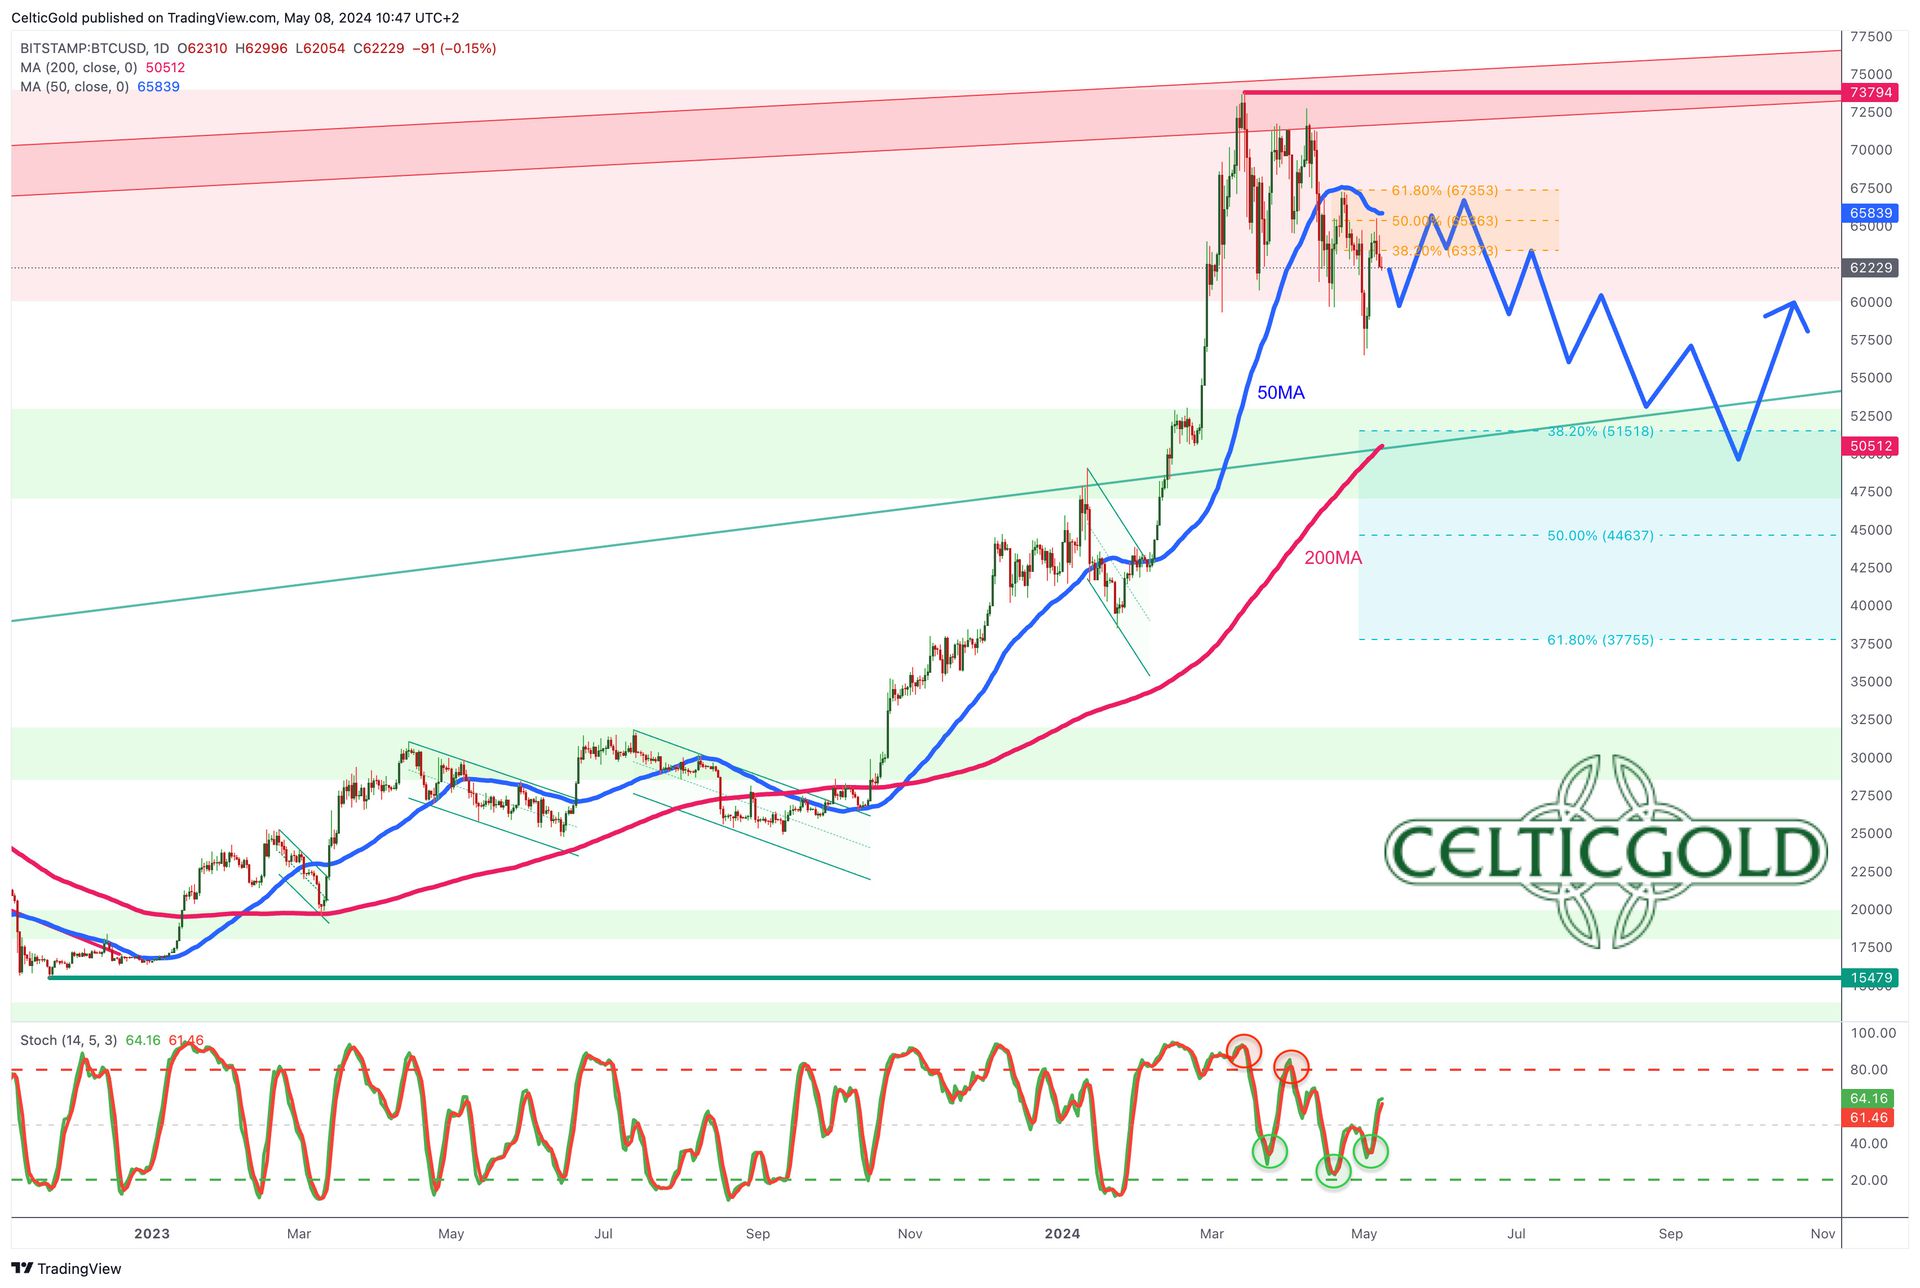
On the daily chart, Bitcoin prices slipped below the 50-day moving average (USD 65,839) in mid-April and have since been unable to reclaim it. By now, this moving average has also turned downwards, hence a strong resistance awaits the recovery in the range of USD 65,500 to 66,000.
If the recapture fails to be sustained, the market is likely to eventually seek the significantly lower running 200-day moving average (USD 50,512 USD). At the same time, the daily stochastic has triggered a buy signal, which should support Bitcoin in the coming days and perhaps one to three weeks.
To conclude, the daily chart is currently slightly bullish. The ongoing recovery could potentially continue for a good while longer. However, the bulls will encounter strong resistance in the range between USD 65,500 and 67,300. Therefore, we anticipate the end of the recovery to occur no later than in this region. On the other hand, if the peak of the recovery has already been seen at 65,513 USD, the important support zone around USD 60,000 is likely to quickly become the focus of market participants.
3. Sentiment Bitcoin – Optimism still too high
Crypto Fear & Greed Index long term, as of May 6th, 2024. Source: Lookintobitcoin
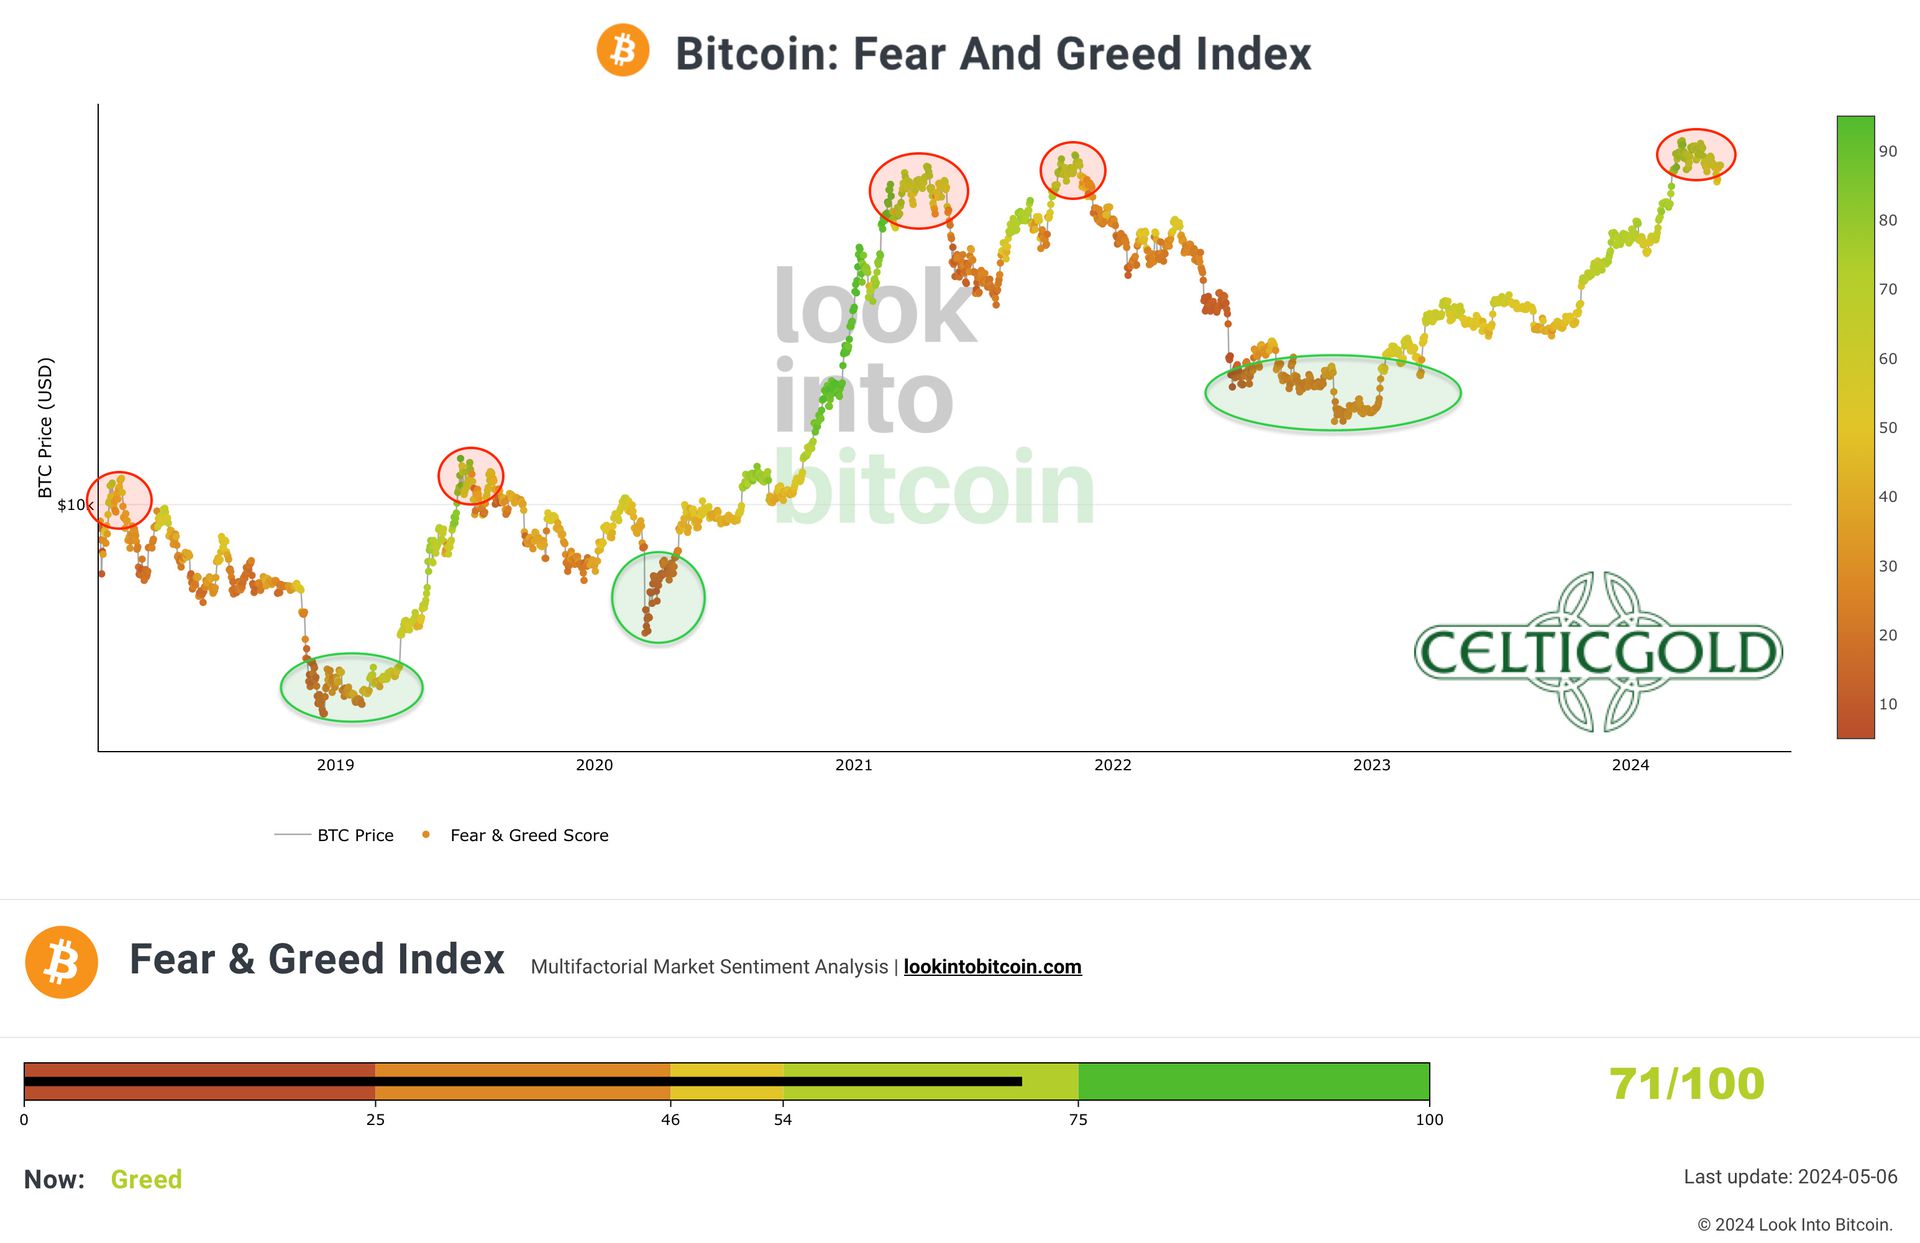
The “Crypto Fear & Greed Index” is currently at 71 out of 100 points, slightly below its high of 88 on 14th March. Despite the downturn, sentiment has not been completely reset.
CMC Crypto Fear & Greed Index as of May 6th, 2024. Source: Coinmarketcap
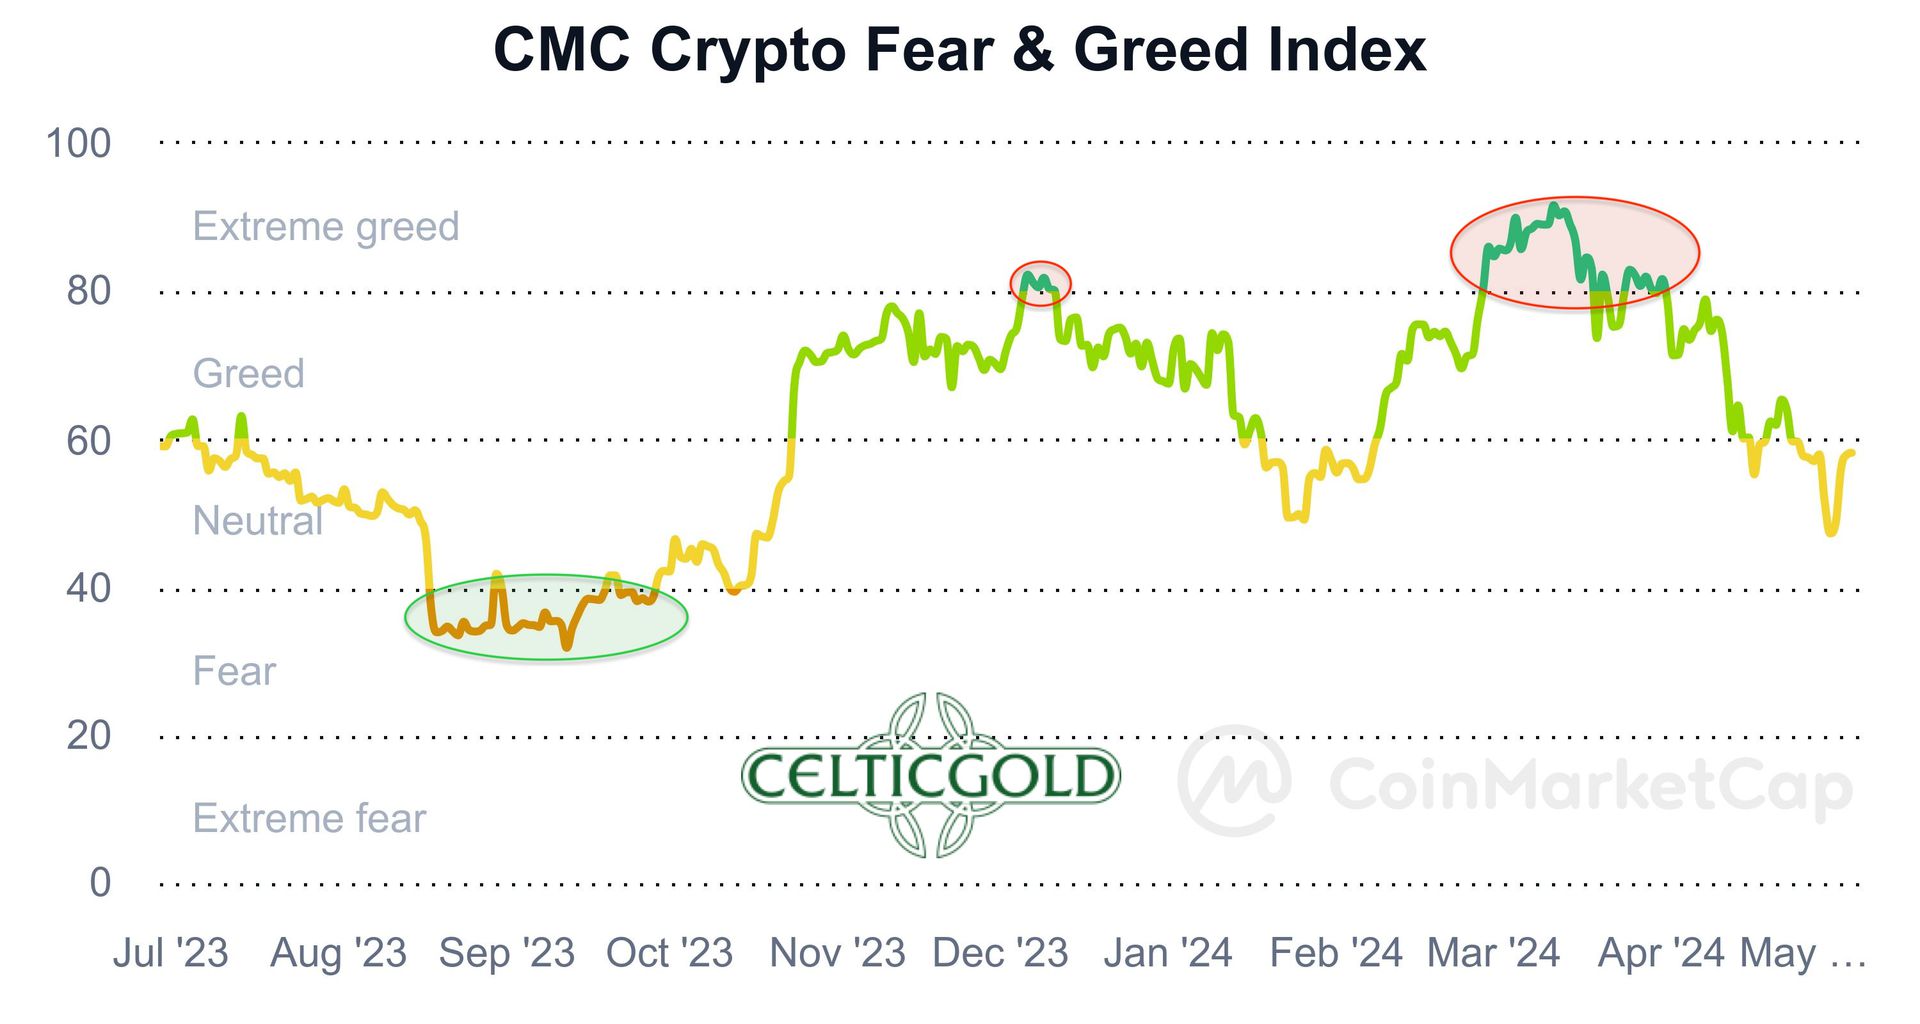
The “CMC Crypto Fear & Greed Index” from CoinMarketCap has significantly retreated in recent weeks and currently indicates a more neutral sentiment. However, we still have quite a way to go before reaching a contrarian buying opportunity, which typically arises only during a selling panic.
Overall, sentiment remains overly optimistic. It will likely require either another significant wave of selling or an extended period of sideways movement, or a combination of both, before the upside potential becomes compelling again.
4. Seasonality Bitcoin – Favourable seasonality until early June
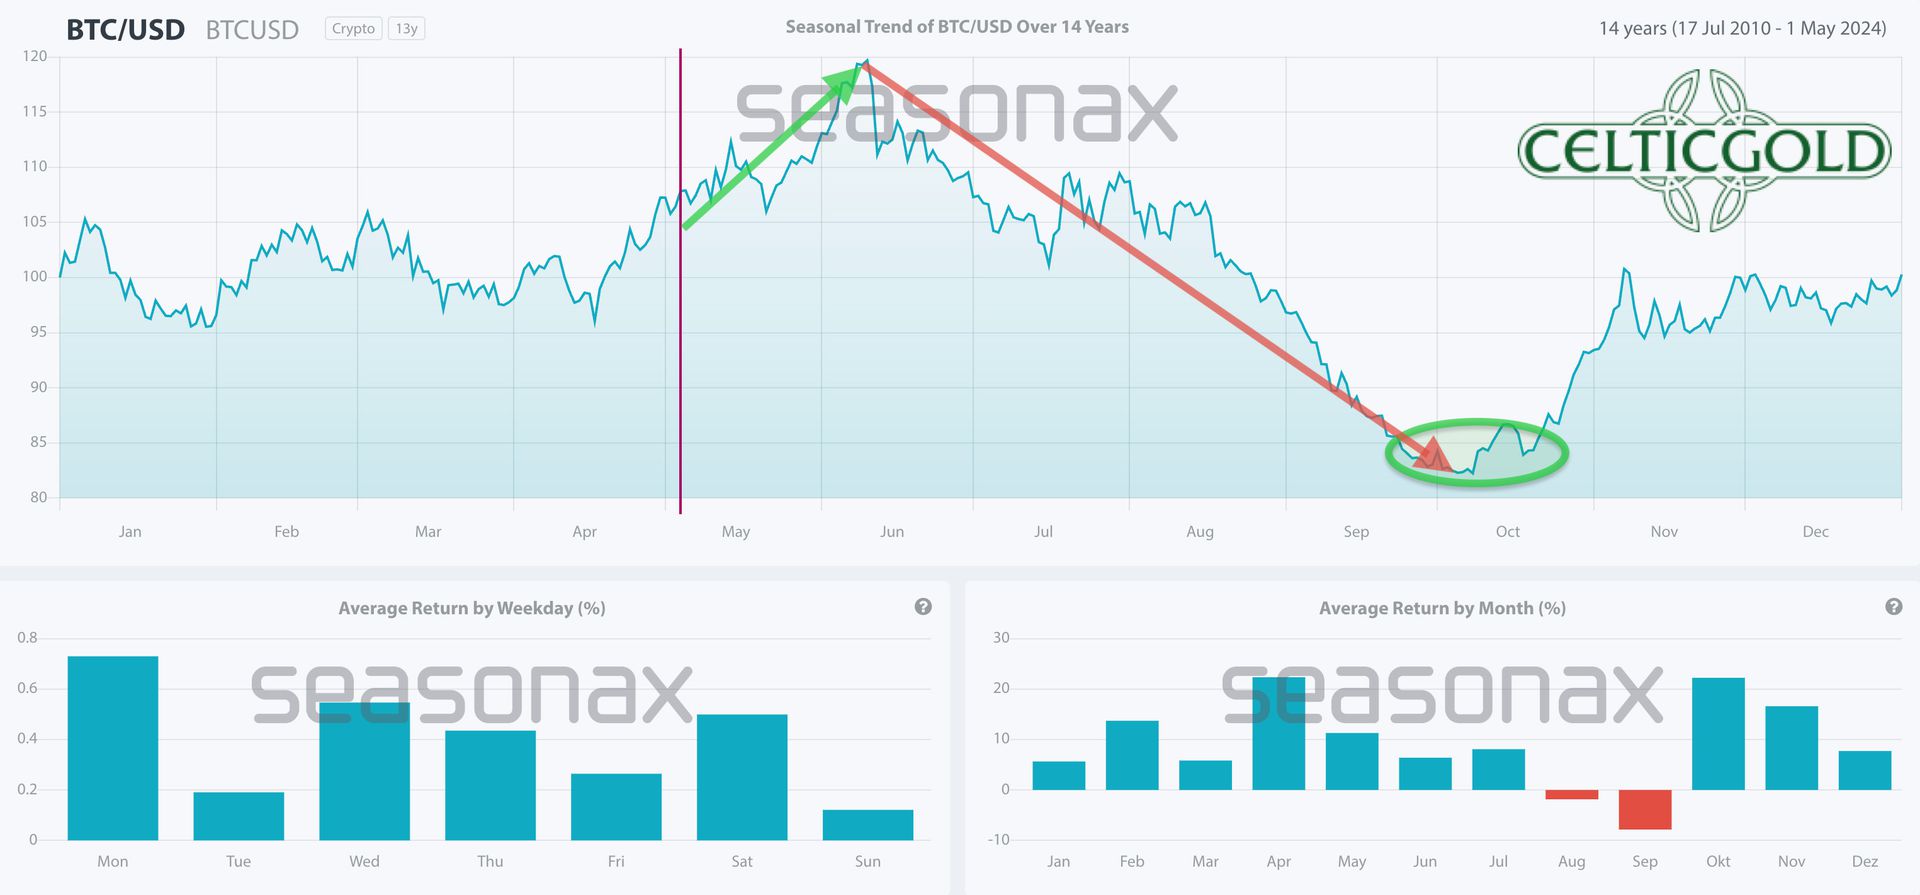
Seasonality for Bitcoin, as of May 3rd, 2024. Source: Seasonax
With the strong rise from late January to mid-March, Bitcoin somewhat stretched its seasonal pattern in the first quarter. Nevertheless, statistics still favour the bulls until early June. Subsequently, however, there is typically a clear downtrend, which concludes with a bottoming process between late September and mid-October.
In summary, seasonality remains positive until early June. After that, the seasonal indicator shifts to dark red.
5. Sound Money: Bitcoin vs. Gold, Bitcoin – Recovery attempt fails, summer doldrums loom
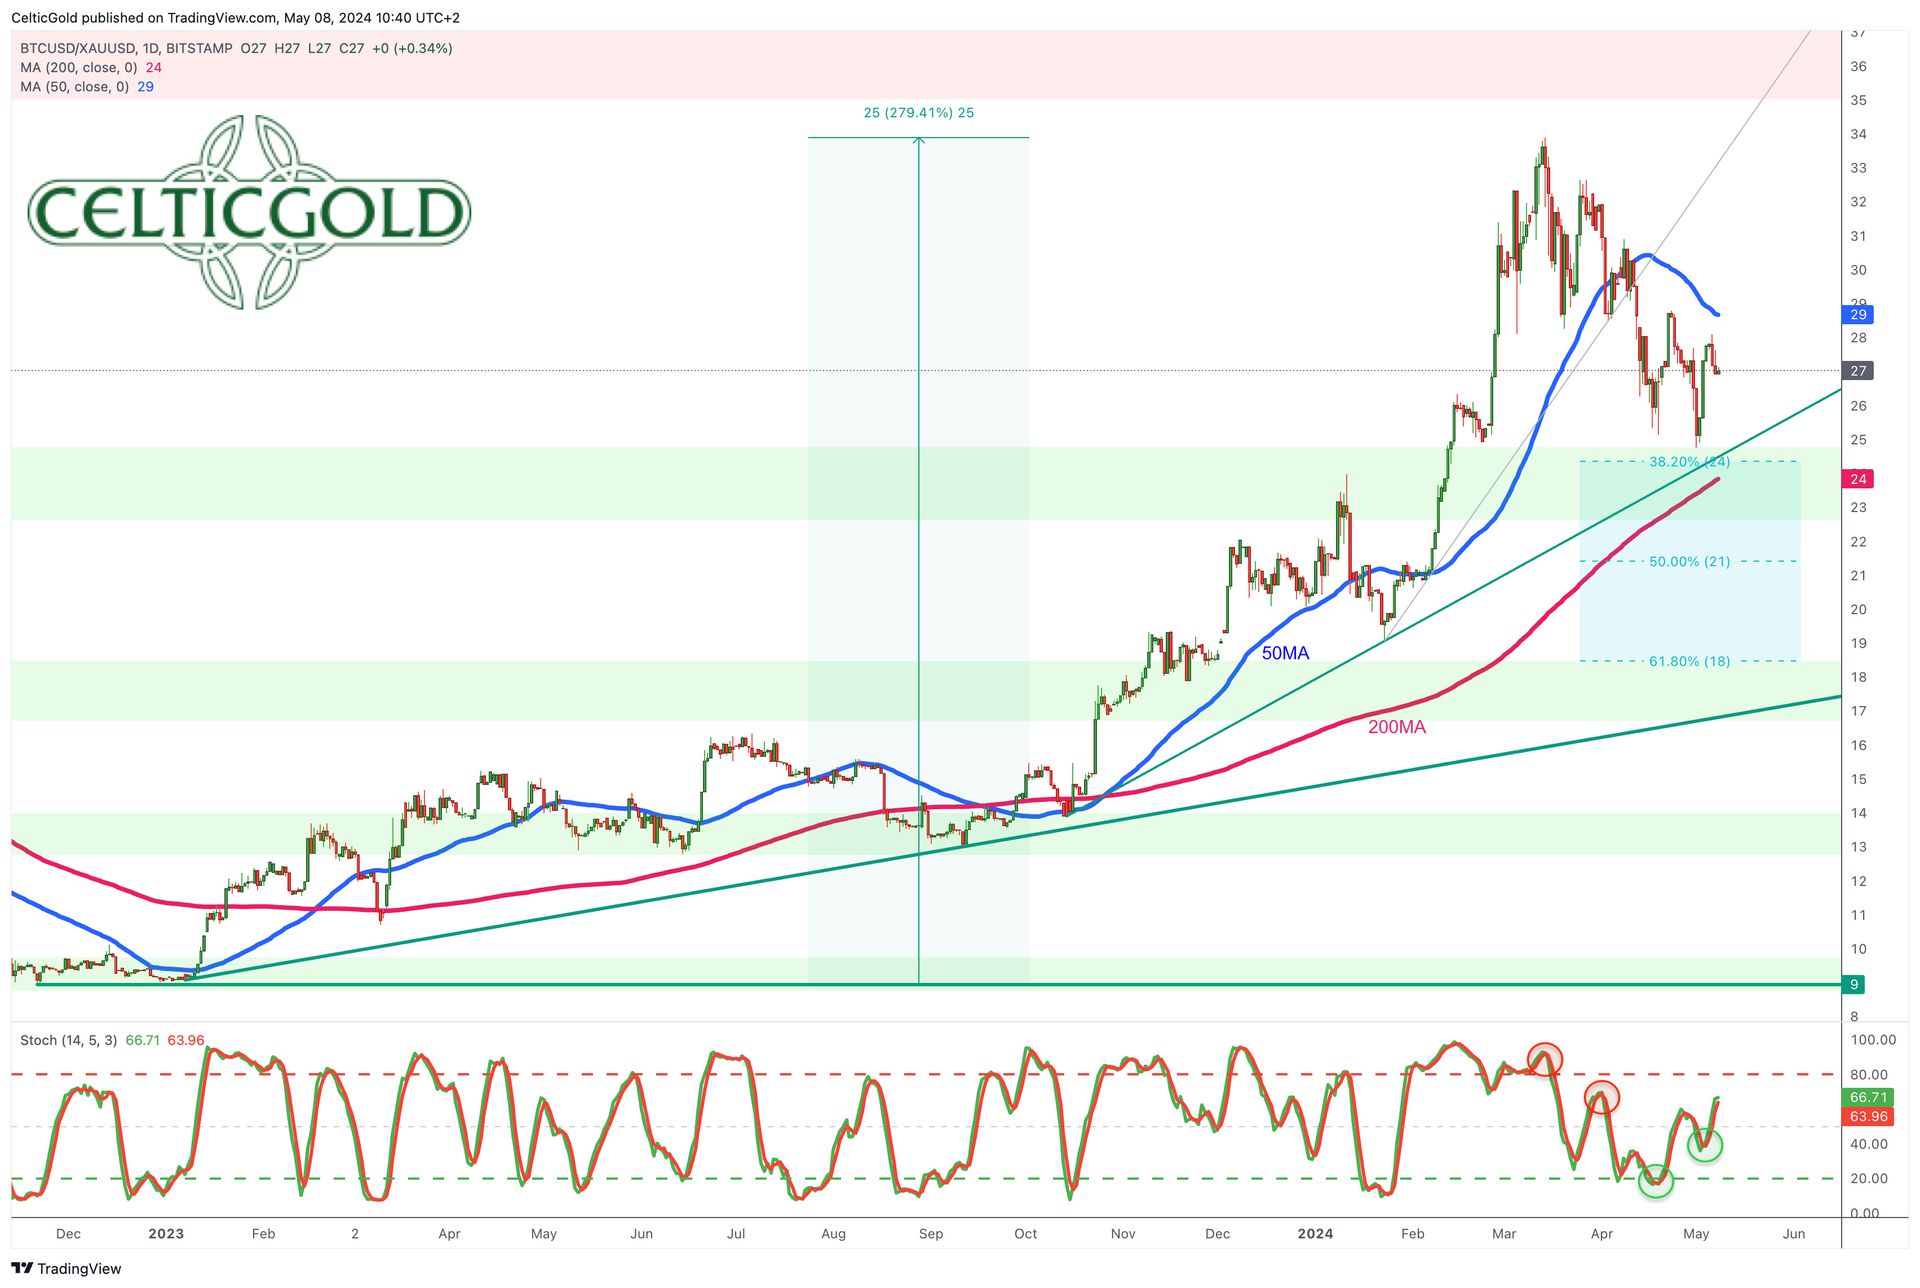
Bitcoin/Gold-Ratio, weekly chart as of May 8th, 2024, 2024. Source: Tradingview
With Bitcoin trading at around USD 62,000 and gold at approximately USD 2,315, one currently needs about 27 ounces of gold to purchase a single Bitcoin. Conversely, this translates to roughly 0.037 Bitcoin per ounce of gold.
Since mid-March, the Bitcoin/Gold-ratio has declined significantly from levels around 34 to 25. While Bitcoin experienced a clear correction, gold, on the other hand, saw significant gains. Since the major correction in 2022, this is the first time that the ratio has shifted so markedly in favour of gold. In the grand scheme of things, however, Bitcoin remains the much faster horse.
Having fallen back to 24, the ratio has nearly reached its rapidly rising 200-day moving average and the 38.2% retracement of the former rally. However, the sharp recovery in recent days does not appear to signal a completed correction but rather seems like a technical reaction. To truly correct the steep ascent of the last 15 months, a significantly deeper retracement into the range between 18 and 20 may be necessary.
Overall, the Bitcoin/Gold ratio is undergoing the expected correction. This correction is likely to continue indirectly over the coming months to probably find its bottom in the range between 18 and 20.
6. Macro Update – The collapsing yen is paving the way ahead
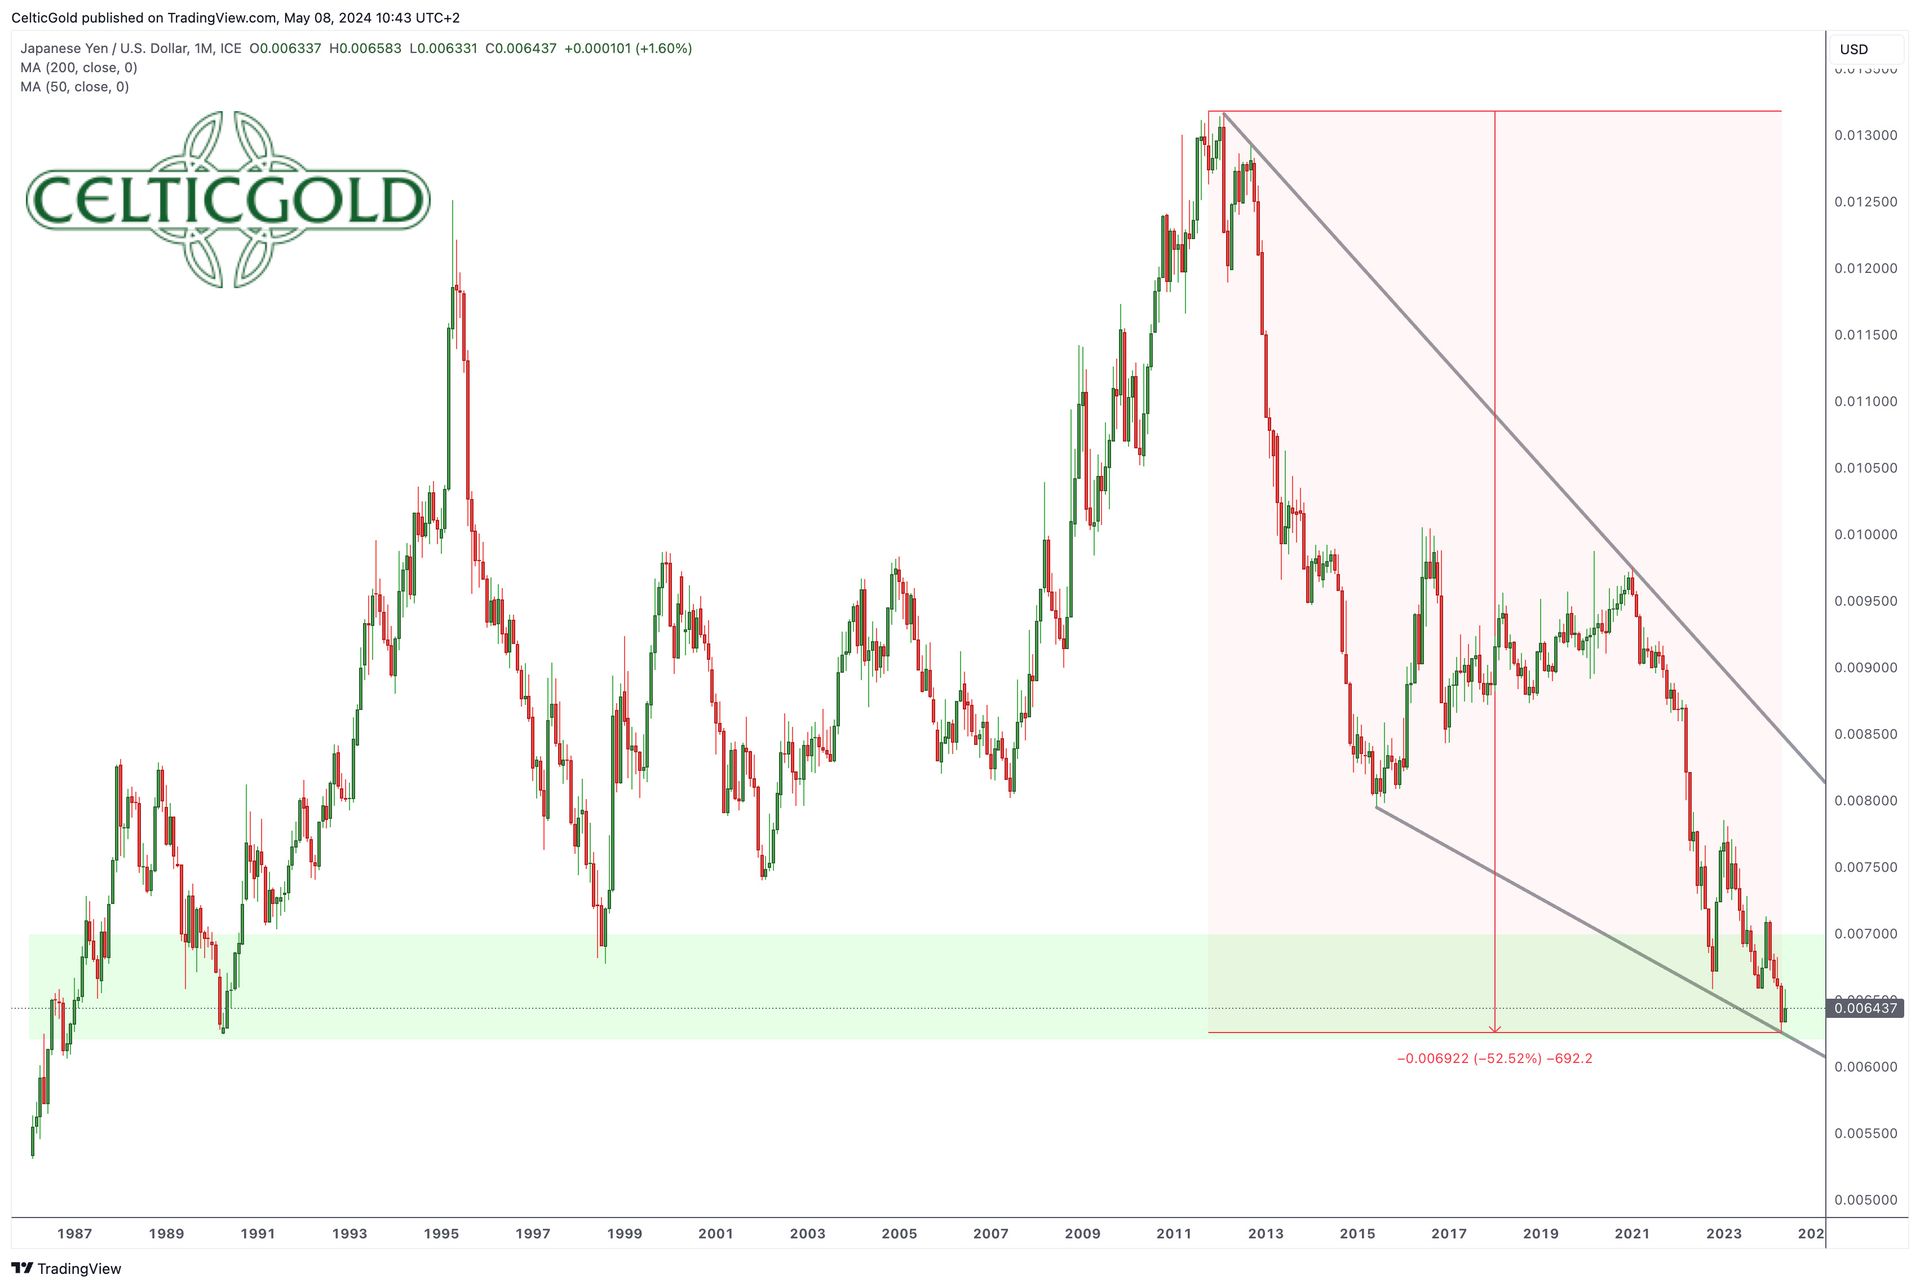
Japanese Yen vs. US-Dollar, monthly chart as of May 8th, 2024. Source: Tradingview
Over the past three and a half years, the Japanese yen has dramatically depreciated against the US dollar, recently reaching its lowest level since 1991. However, despite this, the Bank of Japan (BoJ) only raised the benchmark interest rate by a meager quarter point to 0 to 0.1% in March, even though the US Federal Reserve (Fed) has implemented significant interest rate hikes in recent years and has recently indicated that US interest rates may remain higher for longer.
With one of the world’s highest debt-to-GDP ratios of over 260%, Japan has been forced to keep interest rates at an extremely low level, near zero, for years. Even as inflationary pressures have increased, the BOJ has resisted aggressive interest rate hikes. The central bankers feared they would make the enormous debt burden even more uncontrollable. While Japanese banks have attempted to curb the yen’s weakness by selling dollar holdings, the diametrically opposed interest rate policies logically hinder success.
6.1 The “yen carry trade” poses significant risks for the international financial casino
Given the recent rapid depreciation, the collapsing yen now sends strong warning signals, particularly as the “yen carry trade” is one of the main supports for the international financial casino. For years, low-interest yen loans have been taken out to invest in higher-yielding assets abroad, especially in the US bond and US stock markets. However, a worsening yen weakness could lead to margin calls and potentially force the liquidation of positions, triggering significant volatility between different assets in the international financial system. A rate hike in Japan, on the other hand, would similarly put significant pressure on the “yen carry trade”.
Due to the high debt burden, Japanese policymakers likely have no choice but to resort to debt monetisation and thus significantly higher inflation. However, this environment creates the ideal breeding ground for alternative assets like Bitcoin, which has proven itself as one of the best stores of value outside the traditional fiat financial system over the past 14 years.
6.2 In the current high-interest rate environment Bitcoin has demonstrated impressive resilience
While Bitcoin could have been considered a “low-interest phenomenon” in its first 12 years of existence, its recent resilience in a high-interest rate environment unmistakably confirms its nature as hard money and makes it one of the few instruments to counter the stealth devaluation of fiat currency.
As formerly respected institutions and governments sink into dysfunction and inaction, Bitcoin, based on mathematical code, becomes a beacon of hope for those seeking truth and order amidst chaos. While there are many valid criticisms of Bitcoin, its monetary properties of immutable scarcity, decentralisation, and transparency make it a significantly better alternative to the fiat world drowning in devaluation, obfuscation, and misallocated credit, alongside precious metals.
6.3 Total global debt resumed its upward trend in the first quarter of 2024
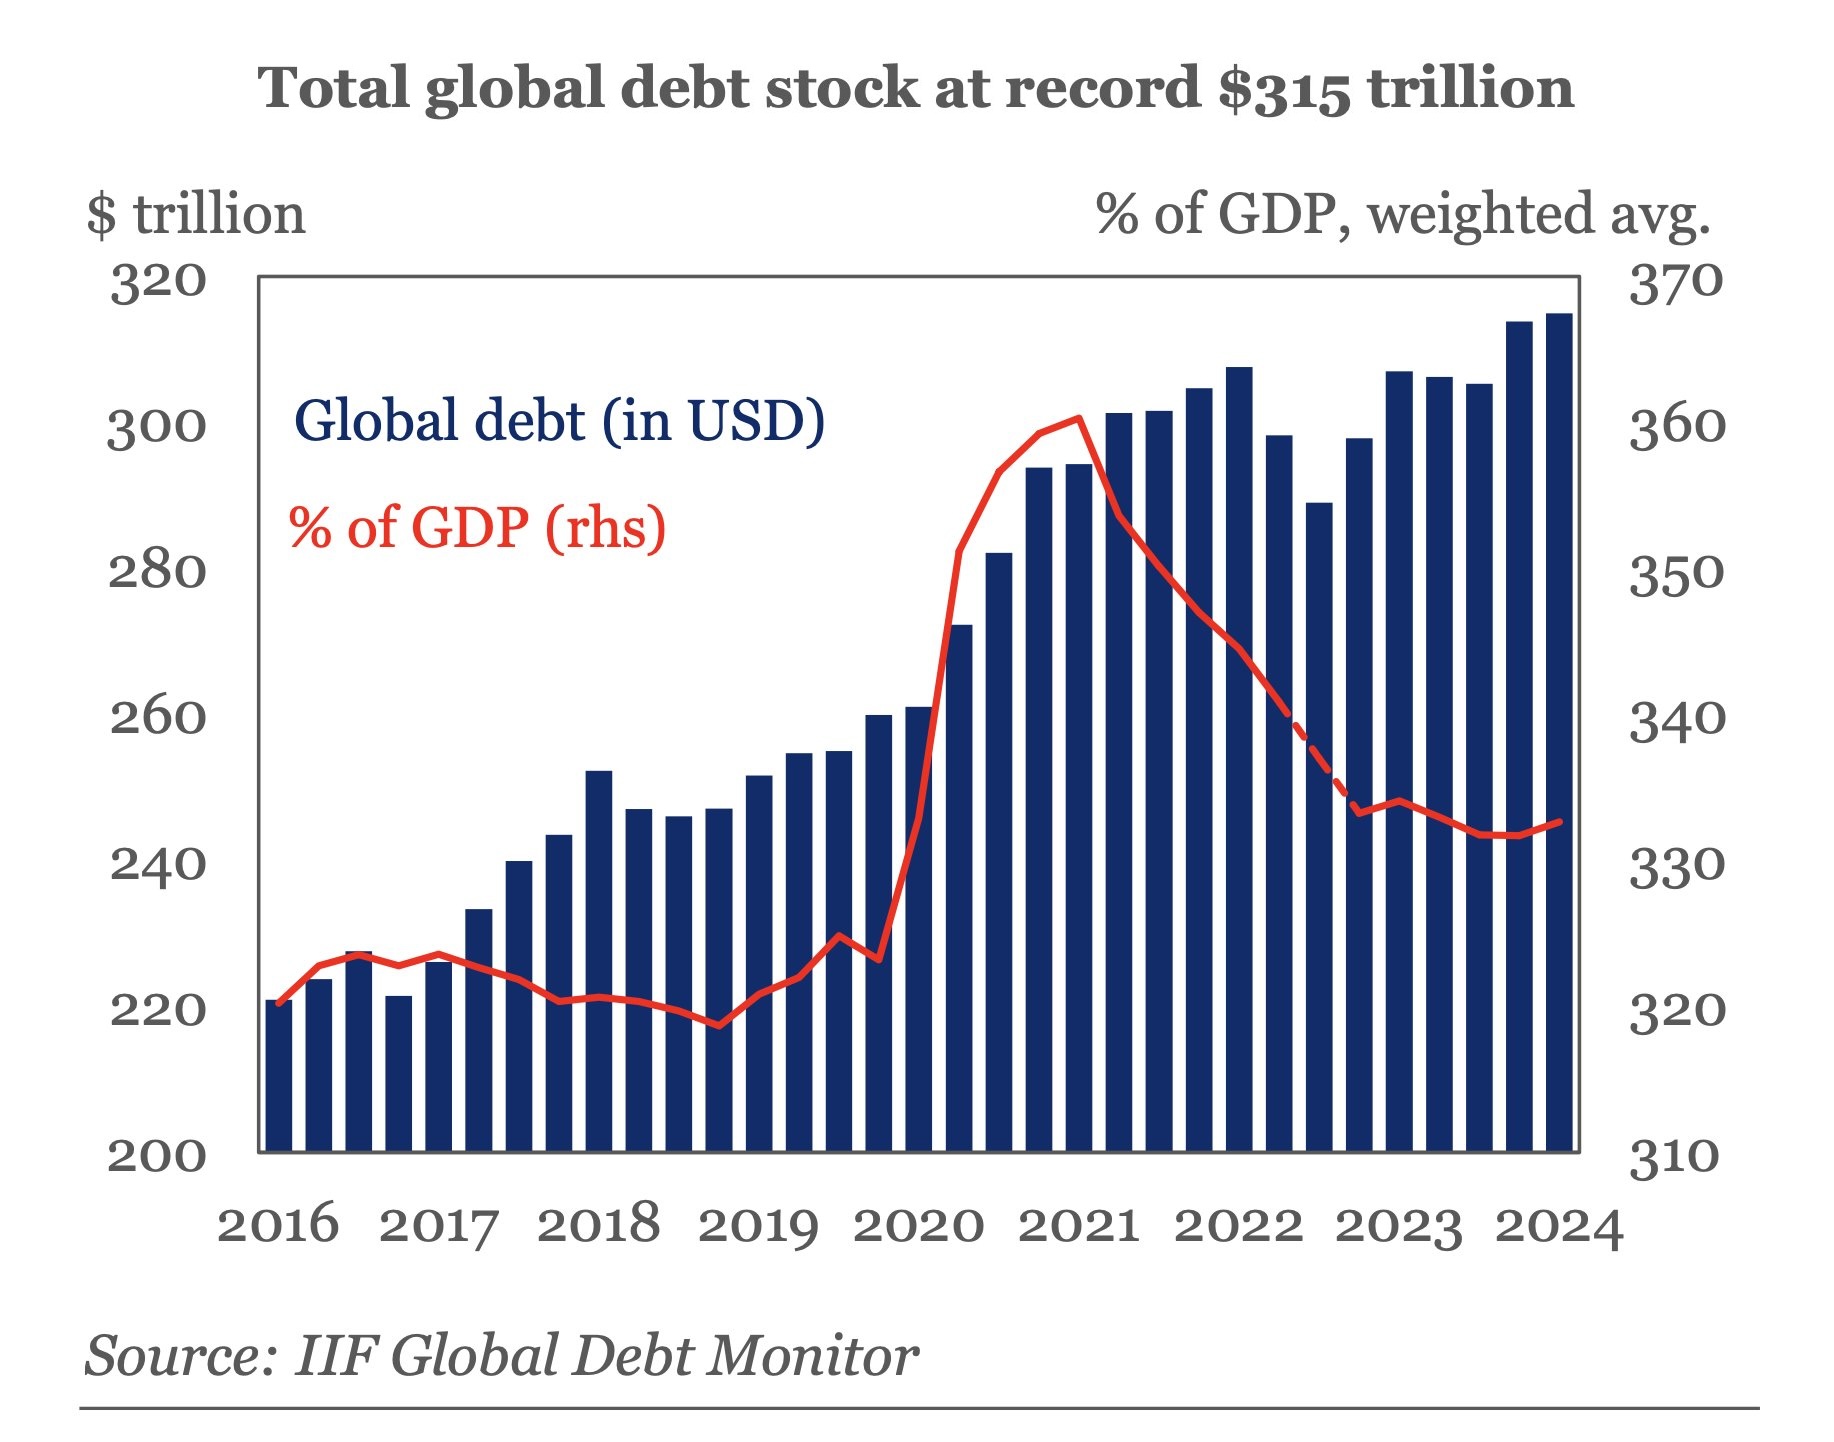
Total global debt, as of May 7th, 2024. Source: Holger Zschäpitz
The dramatic depreciation of the yen is likely just the beginning of renewed upheavals within the fiat system. Global debt recently rose by USD 1.3 trillion to a new all-time high of USD 315 trillion in Q1, 2024. Furthermore, global debt-to-GDP ratio resumed its upward trend in the first quarter of 2024 after three consecutive quarters of decline. At the same time, emerging market debt rose to over USD 105 trillion. The largest increases came from China, India, and Mexico.
The profound and structural imbalances that have accumulated over decades of easy money and reckless government spending cannot be sustainably corrected. Instead, the inevitable end is merely delayed along the timeline with desperate political measures. Thus, the shift towards the antifragile and network-based liquidity of Bitcoin is gradually occurring. Albeit for most, this shift will only come through the pain of devaluation.
Overall, the crack-up boom will continue, gradually pushing prices for Bitcoin and precious metals higher. Nonetheless, we expect at least a brief respite in the markets in the coming months. hence, we prefer to observe the tepid summer doldrums with an increased liquidity ratio from the sunbed.
Conclusion: Bitcoin – Recovery attempt fails, summer doldrums loom
With May already upon us, spring officially has just six more weeks before the calendar summer begins. However, in financial markets, the month of May is associated with the old adage “Sell in May and go away.” Statistically, it can undoubtedly be shown that markets tend to perform better on average between October and the following spring than between May and September.
For Bitcoin, closely correlated with tech stocks, we also anticipate a rough patch until autumn. This doesn’t necessarily mean dramatic price declines. A sluggish and mostly sideways consolidation could be enough to cool down the still overly optimistic sentiment.
Overall, a healthy pullback to the 38.2% retracement level around USD 51,500 within the “cup-and-handle” formation appears most likely at the moment, before the next major uptrend wave could potentially start in mid-September or October 2024.
“9th May 2024, Bitcoin – Recovery attempt fails, summer doldrums loom.” analysis sponsored and initially published on 8th May 2024, by www.celticgold.de. Translated into English and partially updated on 9th May 2024.
Feel free to join us in our free Telegram channel for daily real time data and a great community. To get regular updates on our gold model, precious metals, commodities, and cryptocurrencies, subscribe to our free newsletter.
Disclosure:
This article and the content are for informational purposes only and do not contain investment advice or recommendations. Every investment and trading move involves risk, and readers should conduct their own research when making a decision. The views, thoughts, and opinions expressed here are the author’s alone. They do not necessarily reflect or represent the views and opinions of Midas Touch Consulting.
About the Author: Florian Grummes
Florian Grummes is an independent financial analyst, advisor, consultant, trader & investor as well as an international speaker with more than 20 years of experience in financial markets. He is specialized in precious metals, cryptocurrencies, and technical analysis. He is publishing weekly gold, silver & cryptocurrency analysis for his numerous international readers. He is also running a large telegram channel with smart investors from all over the worls. Florian is well known for combining technical, fundamental and sentiment analysis into one accurate conclusion about the markets.