The crypto community is terrified as Bitcoin continues to move downwards. Seven months after the new all-time high at US$69,000 Bitcoin has already trouble to regain the US$30,000 level. Bitcoin – Extremely fearful sentiment offers chance for a bounce.
1. Review
Starting at the new all-time high of US$69,000 on November 10, 2021, the price for one Bitcoin has been brutally sliding down over the last seven months. Until now, the low point of this correction had been marked on May 12th, with prices around US$25,400.
Following the first hard correction wave (-52.25% in two and a half months), which ended on January 24th at US$32,950, bitcoin was able to recover temporarily by 46% to just under US$48,000 by the end of March. However, the 200-day moving average line blocked any further progress and pushed bitcoin prices directly back into the next hard correction wave (-47.2% in one and a half months). During the dramatic panic sell-off due to the Terra Luna disaster, bitcoin reached the low at US$25,400.
Altcoins getting annihilated
The vast majority of altcoins were punished even more severely. From high to low, bitter losses of e.g., -70% for Ethereum (ETHUSD), -83% for Polygon (MATICUSD), -87% for Cardano (ADAUSD) and -90% for Solana (SOLUSD) have occurred. Thus, an established bear market or a so-called “crypto winter” can no longer be dismissed.
Despite a total loss of 63% since the all-time high in November, as well as a completely depressed sentiment, bitcoin is barely or only very slowly and tenaciously getting back on its feet in the last four weeks and has lots of trouble regaining the 30k level.
2. Technical Analysis For Bitcoin in US-Dollar
2.1. Bitcoin Monthly Chart – Right at ten-year uptrend line
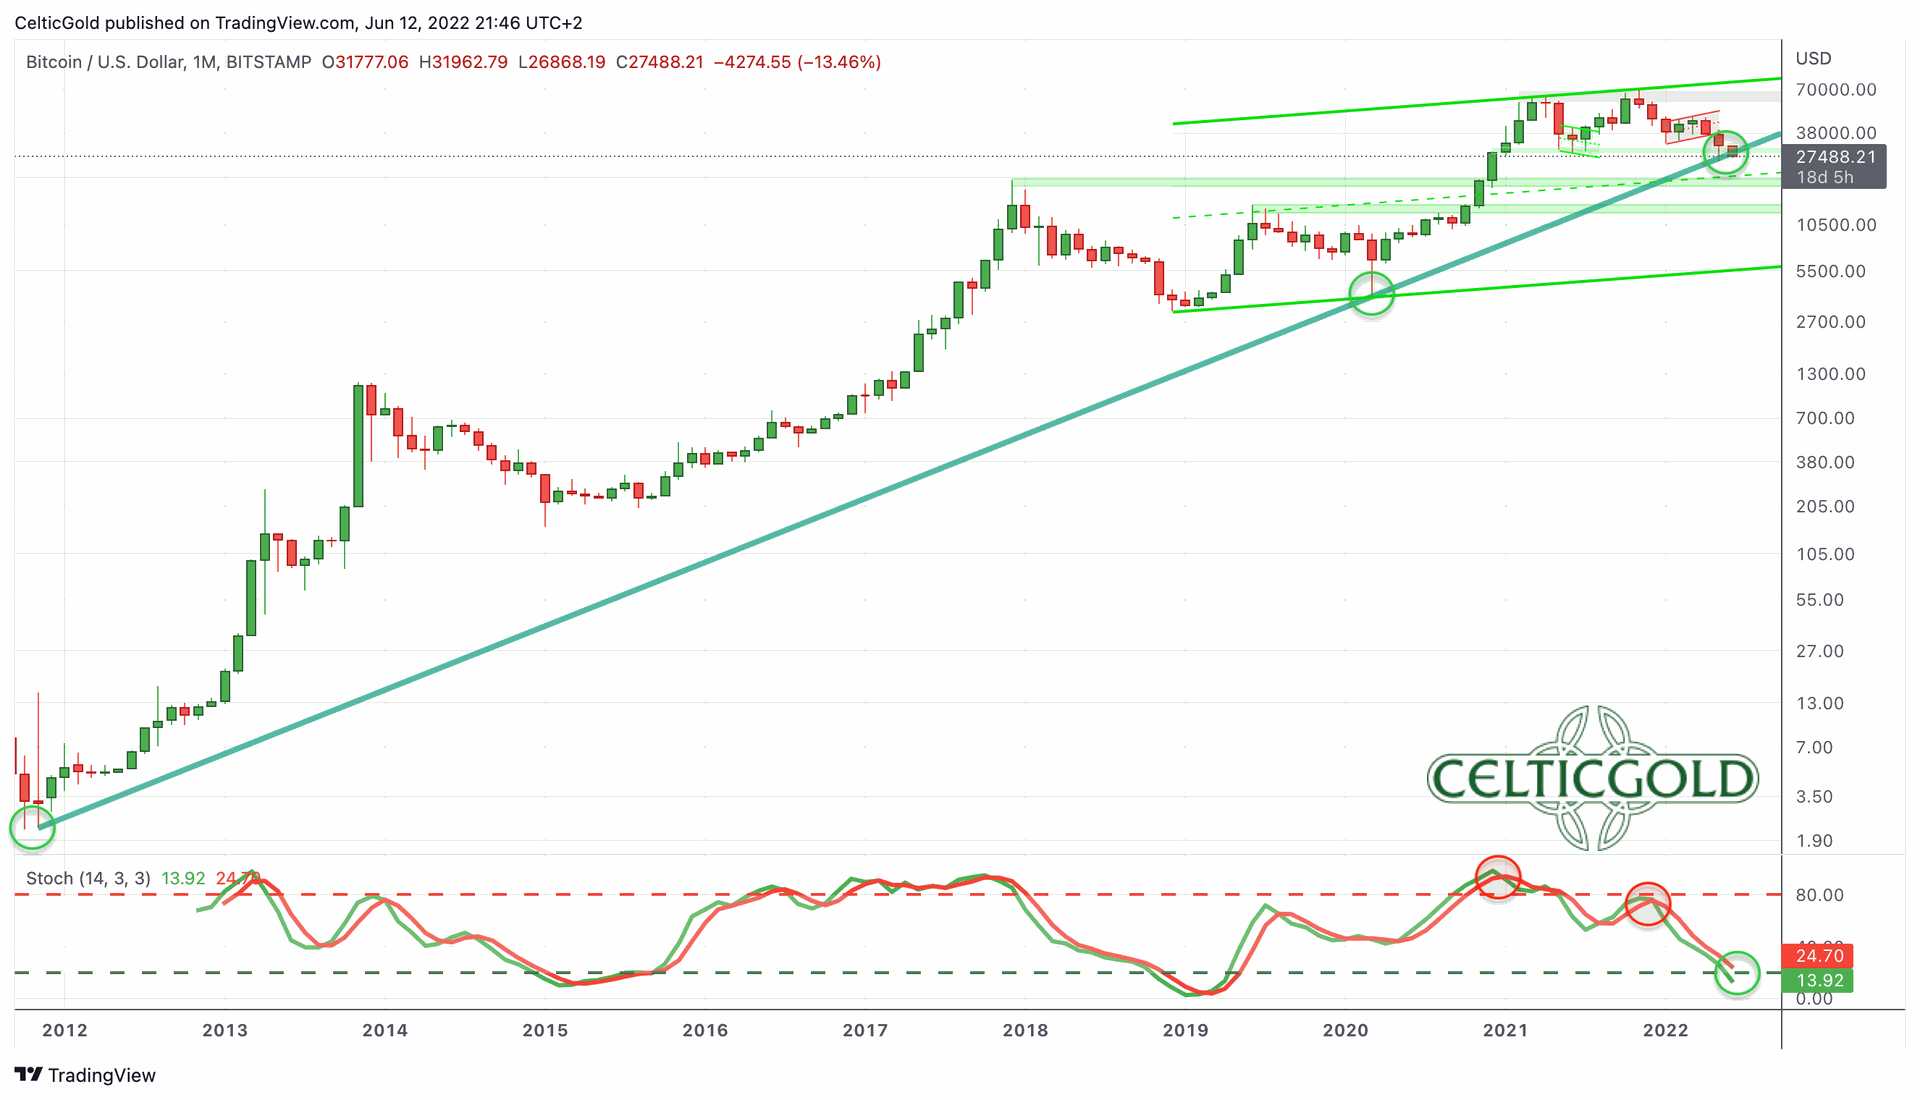
Bitcoin in USD, monthly chart as of June 12th, 2022. Source: Tradingview
The seven-month-long correction has led bitcoin back to its 10-year uptrend line. This line originated at the low in the fall of 2011 with prices around US$2.35 and was defined by the Corona crash low around US$3,800 in March 2020. Currently, it looks like bitcoin might not be able to defend this line anymore. However, only a daily and weekly closing would confirm the breakdown with all its negative consequences.
At the same time, there is an oversold situation on the monthly chart. The stochastic oscillator is trading at very low levels and is oversold. A potential bounce or recovery to the upside would have plenty of room before this oscillator turns overbought.
Overall, the monthly chart is still in an uptrend. Hence, at least the potential for a nice bounce is growing. If the major uptrend line indeed can no longer be held, an immediate continuation of the downtrend is likely in the short-term. In that case, prices around the middle trend line of the major uptrend channel of the last two years or towards the old all-time high from 2017 at around US$20,000 are the next targets.
2.2. Bitcoin Daily Chart – Another breakdown or bear trap?
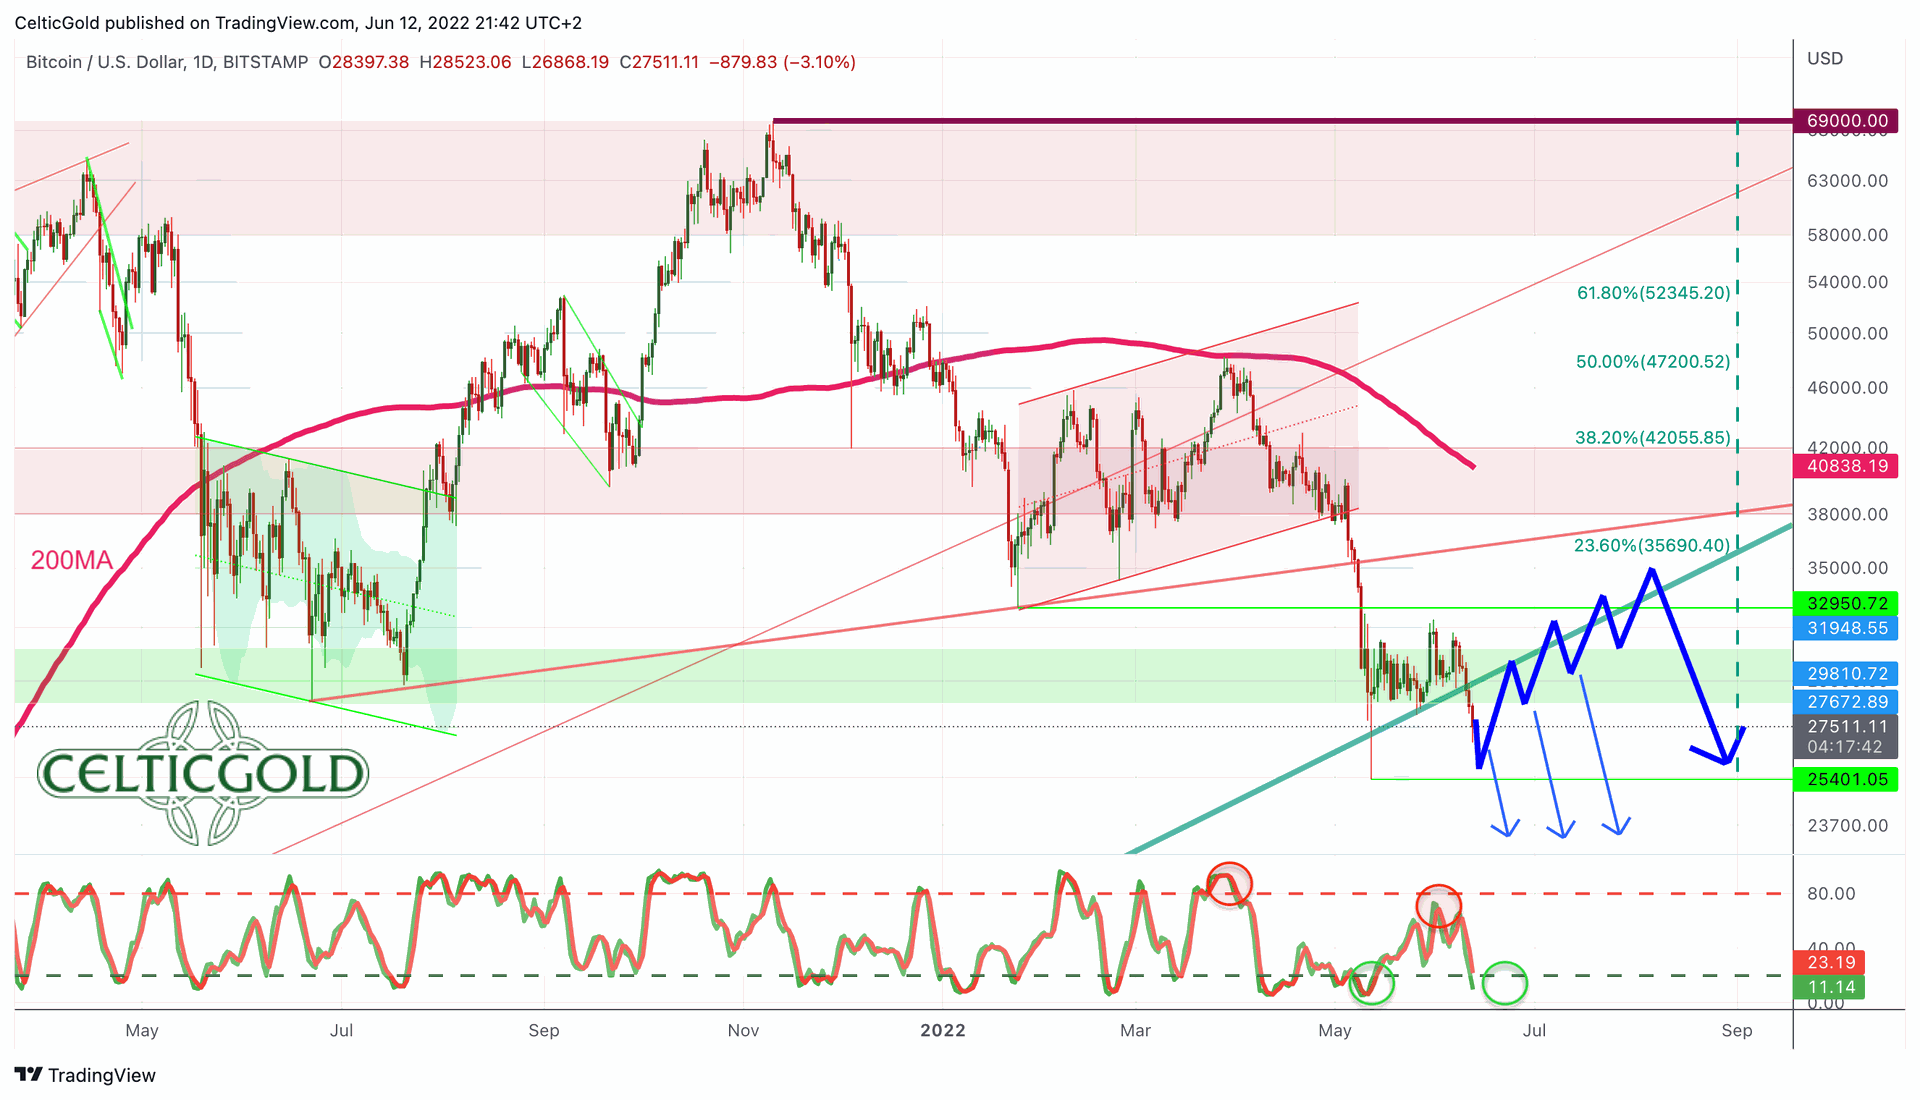
Bitcoin in USD, daily chart as of June 12th, 2022. Source: Tradingview
On the daily chart, prices have come under heavy pressure since failing at the 200-day moving average line (currently US$ 40,838) and crashed to a low of US$25,400 just a few weeks ago. Since then, bitcoin has been struggling to get back on its feet. This does not look confident at the moment, and the last few days have actually worsened the outlook. On the other hand, a stabilization or bottoming takes time.
Similar to the monthly and the weekly stochastic, the daily stochastic is getting oversold, too. Hence, the oscillator is right in front of a nice alignment in all of those three different timeframes. This could create a very promising setup. The two Bollinger Bands define a potential sideways range between US$31,948 and USD 27,672. Yet, the last three days saw Bitcoin sliding south and below the 10-year uptrend line.
In summary, the daily chart is bearish but getting oversold. One can clearly see how the prices have been pushing sideways above the long-term dark green uptrend line for almost four weeks. But any attempt to stage a bounce has failed so far. Actually, this should develop into a reunion with the fast falling 200-day line. The first Fibonacci retracement (23.6%) of the entire correction is at USD 35,690 and represents a realistic minimum target for a recovery. If, on the other hand, the dark green uptrend line is clearly undershot at the daily and weekly closing price, new downside potential opens up.
3. Sentiment Bitcoin – Extremely fearful sentiment offers chance for a bounce
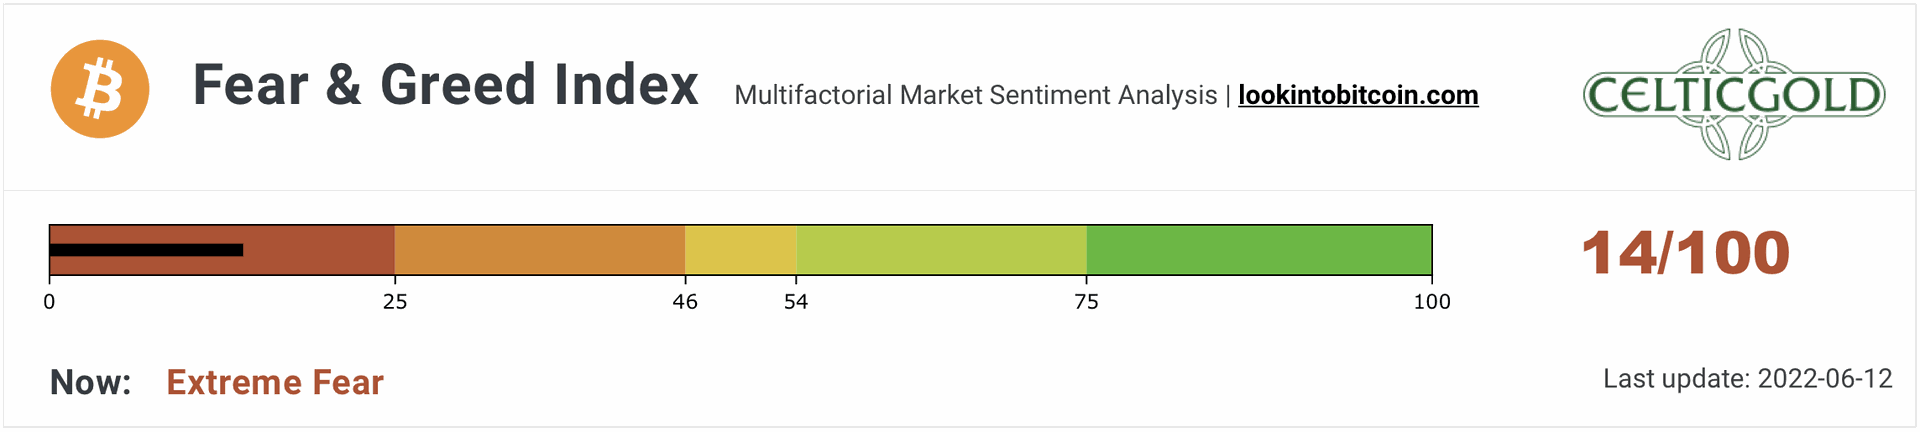
Crypto Fear & Greed Index, as of June 12th, 2022. Source: Lookintobitcoin
The Crypto Fear & Greed Index has been trading in the dark red “fear zone” for weeks with values between 8 and 20. Hence, fear in the crypto sector is very high.
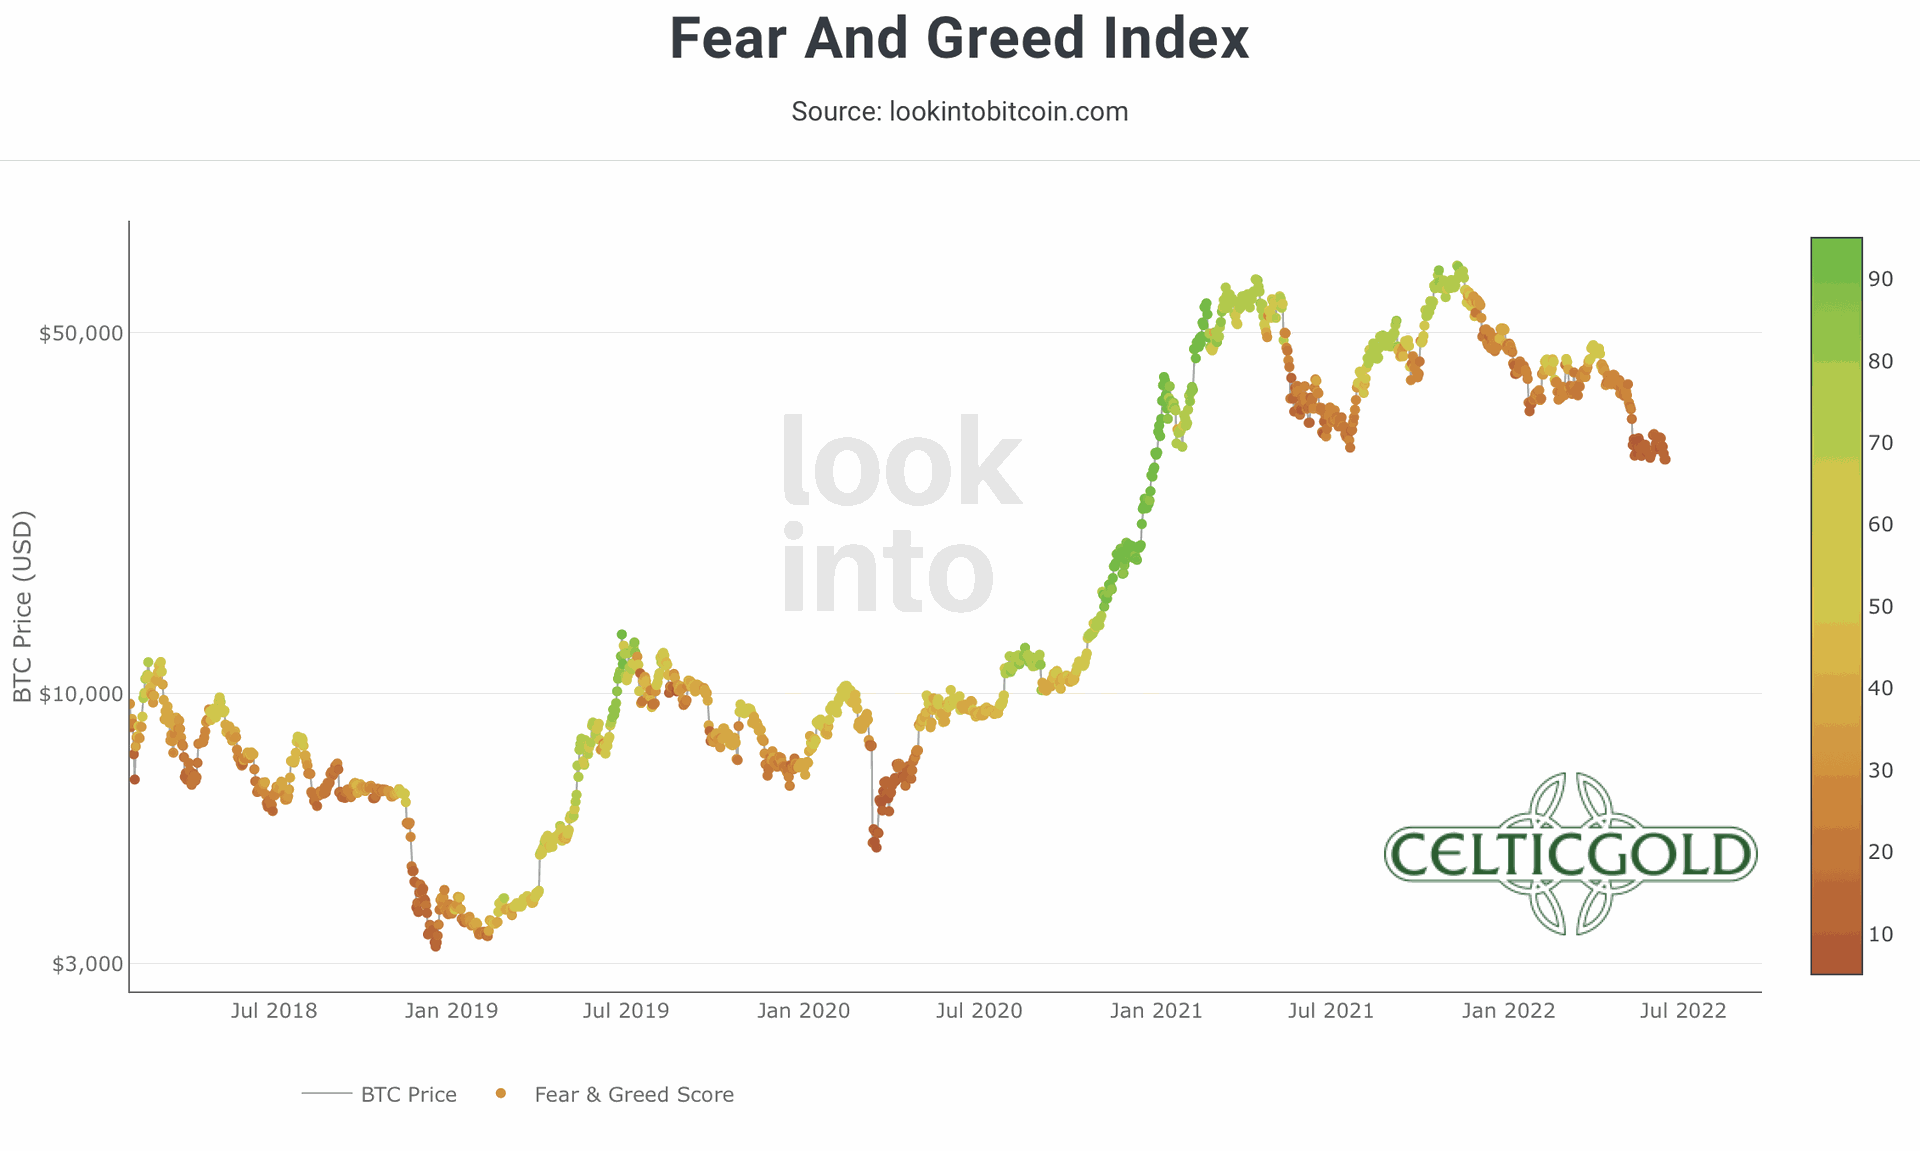
Crypto Fear & Greed Index longterm, as of June 12th, 2022. Source: Lookintobitcoin
In the big picture, the current dark red situation in the Crypto Fear & Greed Index resembles the setup from January 2019. Back then, the crypto winter had also hit brutally, and it took almost three months for bitcoin to get a massive recovery rally started. New lows were not seen in the bottoming phase back then.
Overall, the beaten down sentiment provides the best contrarian buy signal in over two years.
4. Seasonality Bitcoin
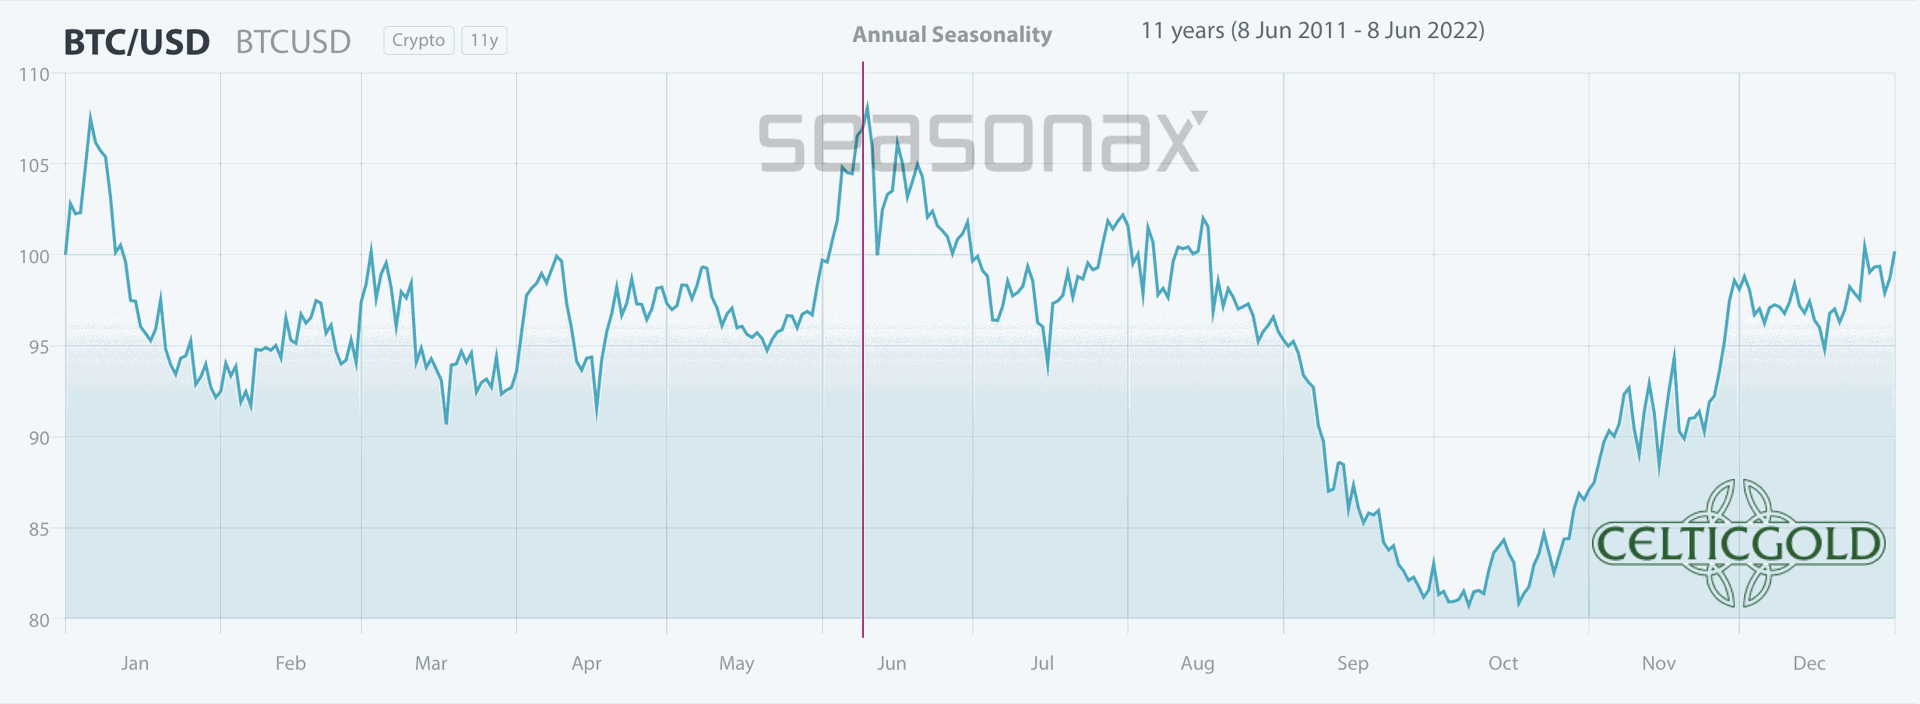
Seasonality for Bitcoin, as of June 9th, 2022. Source: Seasonax
According to the seasonal pattern of the last 11 years, bitcoin should be on the verge of a dramatic sell-off. However, the seasonal cycle does not fit the price trend this year, because bitcoin has already taken a severe beating in the last two and a half months. The typical strong phase in May and June could therefore be pushed back this year and bring a recovery rally in the coming months. Towards the fall, together with the typical turbulence in the stock markets, another bearish phase would then be expected, which in turn would fit in well with the weak month of September according to the seasonal cycle.
Overall, in 2022 the seasonality must be treated with caution, as market activity has hardly followed the seasonal pattern so far.
5. Sound Money: Bitcoin vs. Gold
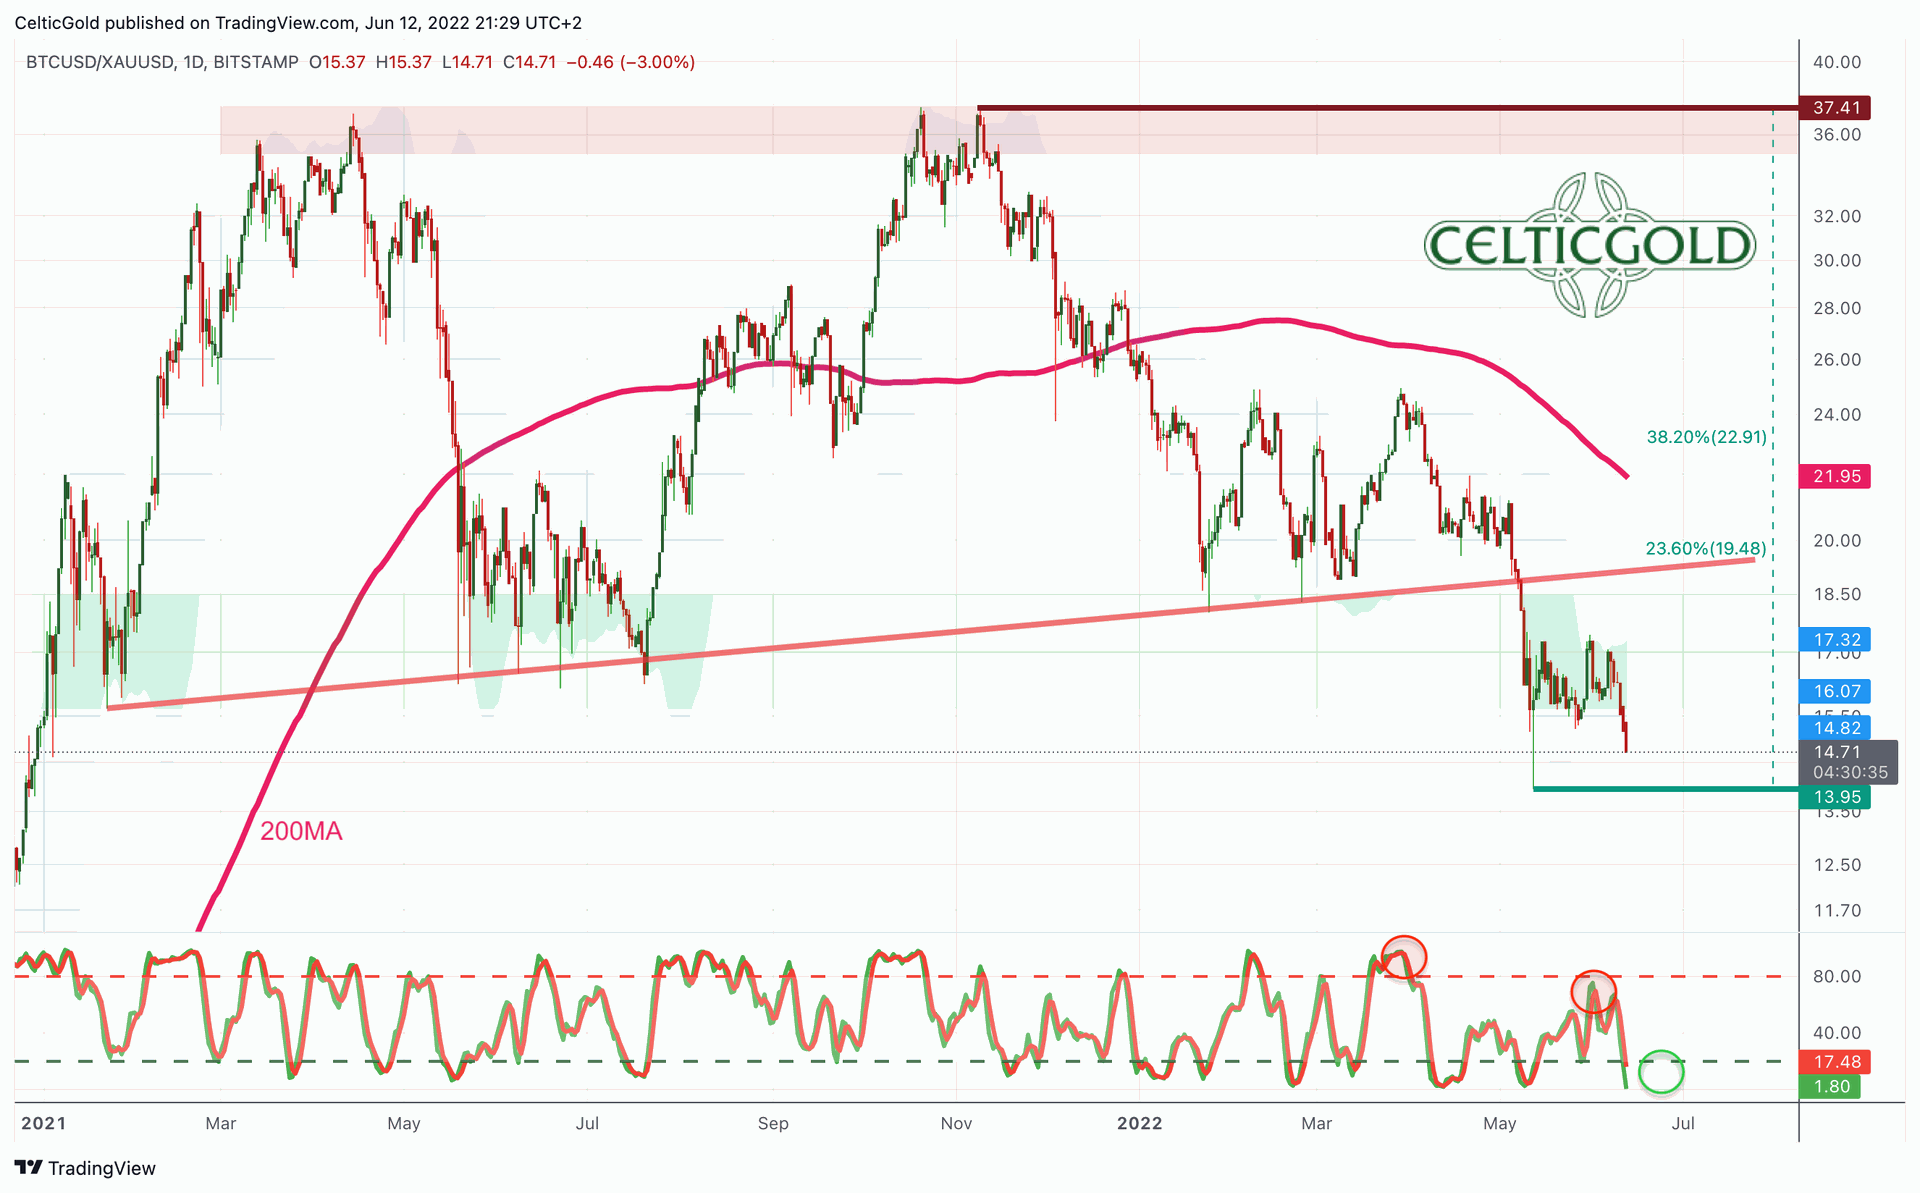
Bitcoin/Gold-Ratio as of June 12th, 2022.Source: Tradingview
The bitcoin/gold-ratio has crashed from 37.41 to 13.95 over the last seven months, which equals -62.7%. Gold has thus done extremely well against bitcoin after a long period of suffering. With prices currently around $28,000 for a bitcoin and just under $1,870 for a troy ounce of gold, you have to pay a good 14.97 ounces of gold for a bitcoin. Put another way, an ounce of gold currently costs about 0.0667 bitcoin.
The daily chart for the bitcoin/gold-ratio currently shows a possible bottom in the making. Subsequently, bitcoin would have the chance to bounce towards the former support line (red) around 19. Another obvious target would be the rapidly falling 200-day moving average line (currently 22.12). The minimum Fibonacci retracement (23.6%) at 19.48 would also be in this area. The next one to three months will show whether the Bitcoin bulls have enough strength to do so. However, the chances are quite not bad. However, should the ratio fail to hold the current support zone between 18 and 16, a continuation of the correction towards the next holding zone around approx. 10 would be likely.
Allocation of sound money
Generally, buying and selling Bitcoin against gold only makes sense to the extent that one balances the allocation in those two asset classes! At least 10% up to a maximum of 25% of one’s total assets should be invested in precious metals physically, while in cryptos and especially in bitcoin one should hold at least 1% but max. 5%. If you are very familiar with cryptocurrencies and bitcoin, you can certainly allocate much higher percentages to bitcoin on an individual basis. For the average investor, who is primarily invested in equities and real estate, a maximum of 5% in the still highly speculative and highly volatile bitcoin is a good guideline!
Overall, you want to own gold and bitcoin, since opposites complement each other. In our dualistic world of Yin and Yang, body and mind, up and down, warm and cold, we are bound by the necessary attraction of opposites. In this sense, you can view gold and bitcoin as such a pair of strength. With the physical component of gold and the pristine digital features of bitcoin you have a complementary unit of a true safe haven for the 21st century. You want to own both! – Florian Grummes
In summary, the bitcoin/gold-ratio currently has a certain chance of recovering in favor of bitcoin. How long and how sustainable this recovery will be, remains to be seen. Overall, however, until the end of the crypto winter gold will outperform bitcoin!
6. Macro Update – Risk Off
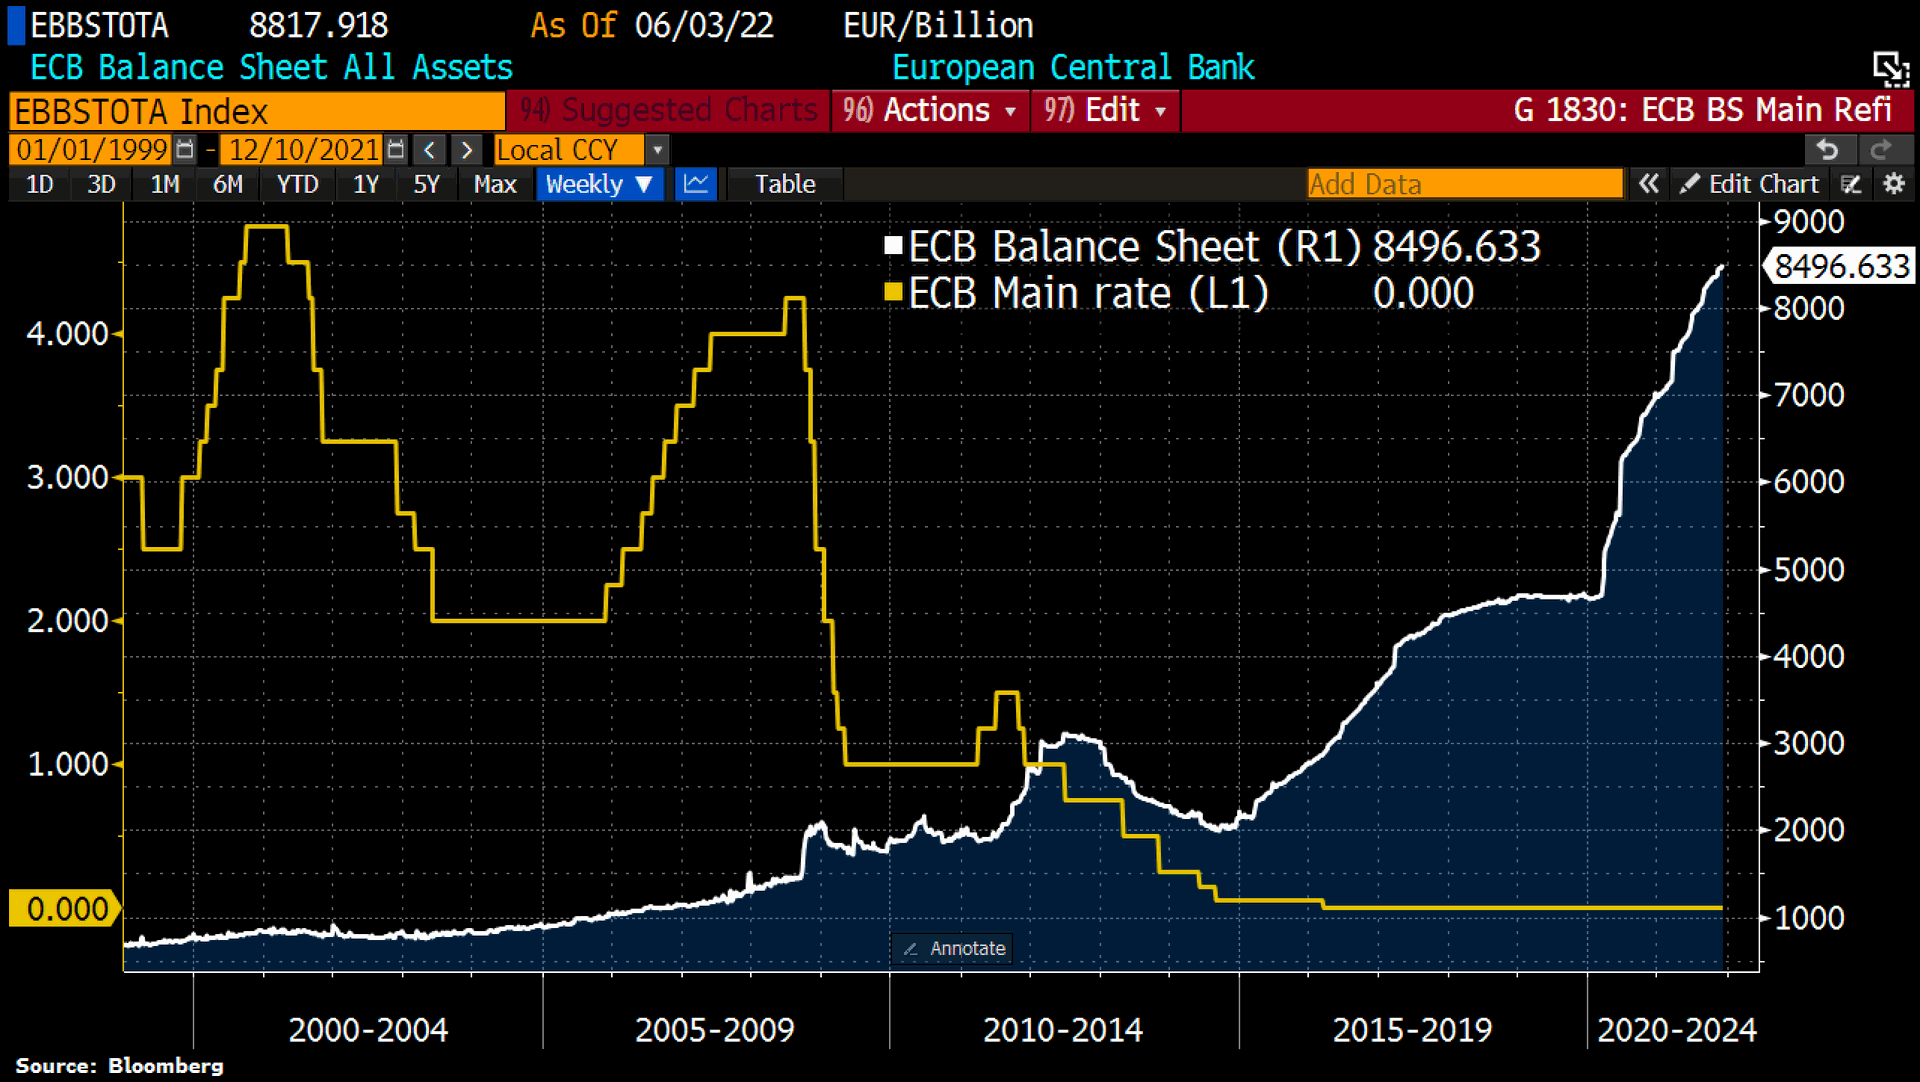
ECB balance sheet total vs. ECB interest rate as of June 9th, 2022. ©Holger Zschaepitz
Although the official inflation rate in Germany rose to 7.9% in May, the European Central Bank left its interest rates unchanged on Thursday this week. However, the ECB plans to raise rates by 25 basis points in July. According to the ECB, the extent of another rate hike in September will only be determined by the data available at that time. Meanwhile, the Pandemic Emergency Purchase Program (PEPP) will end on July 1st.
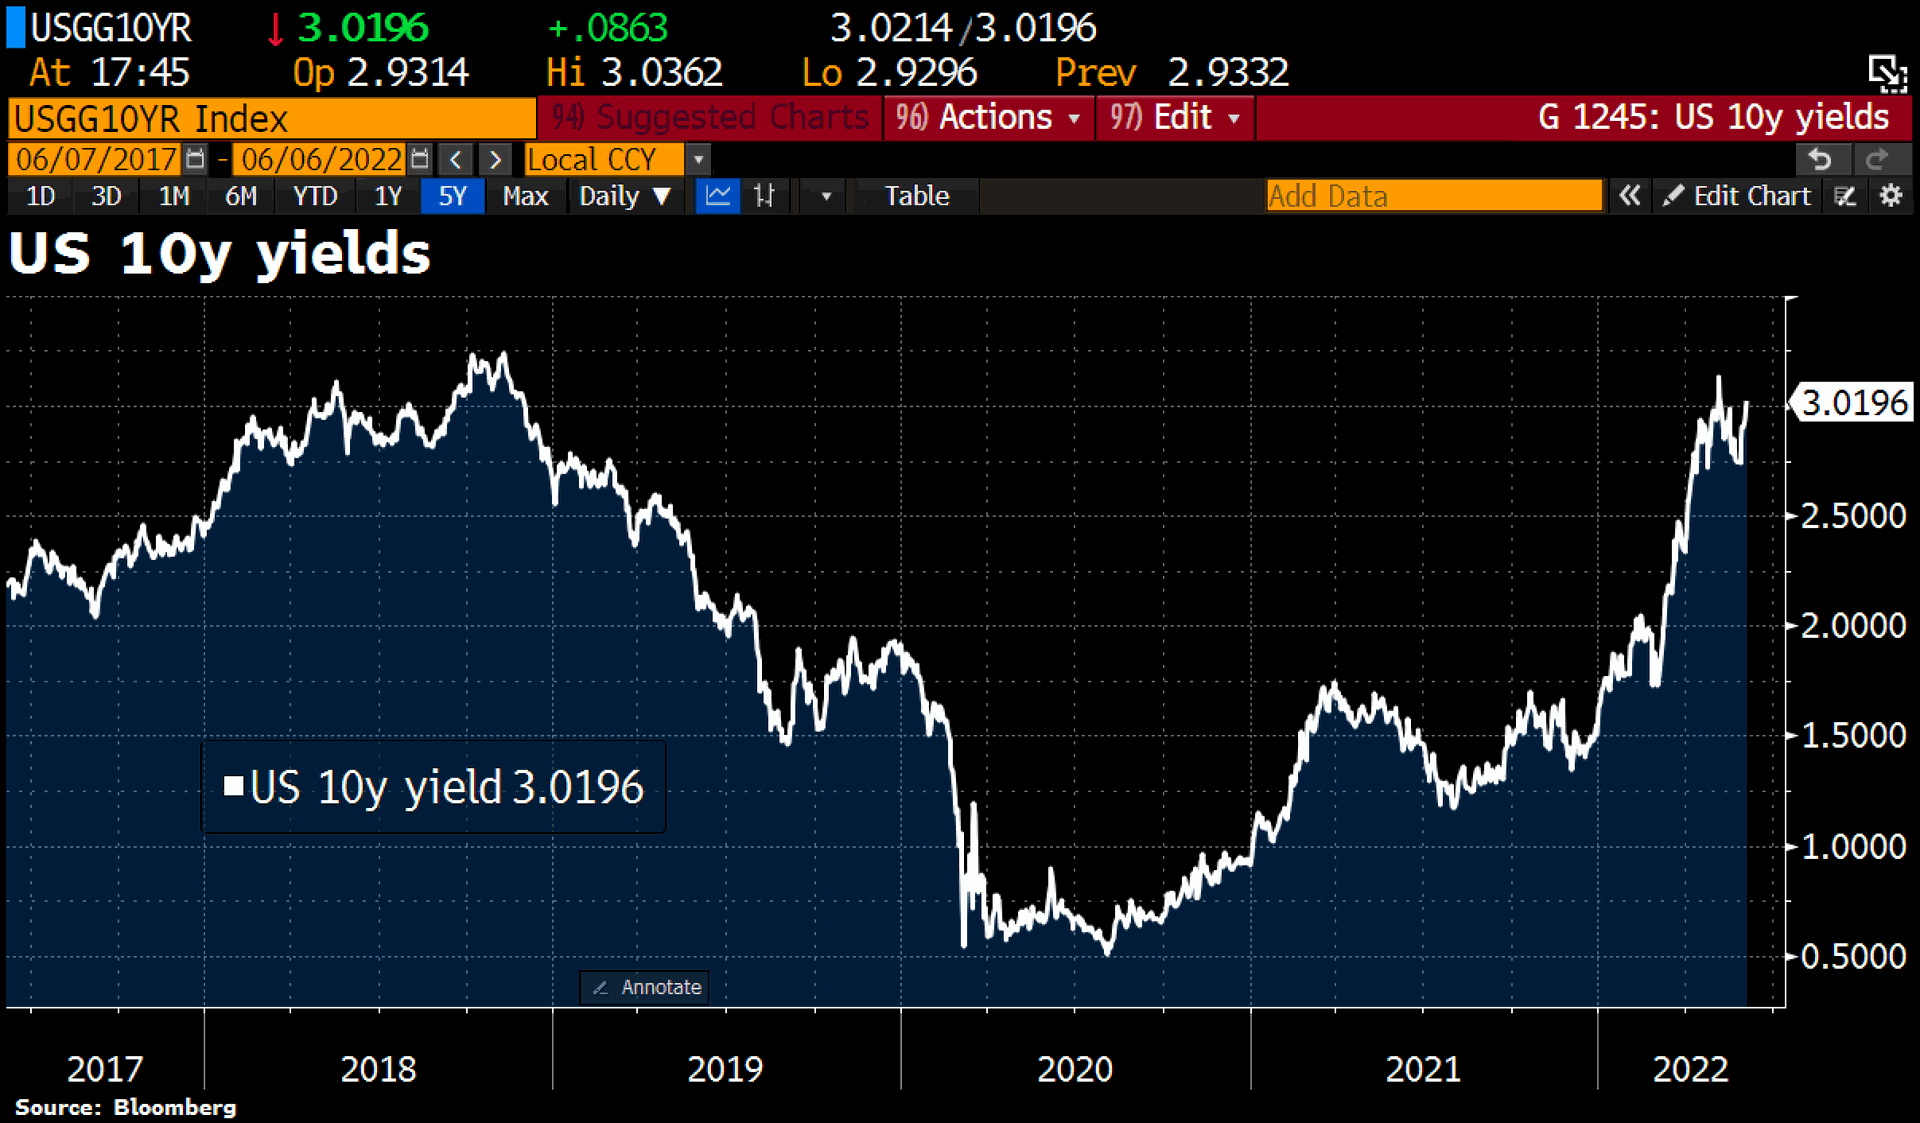
U.S. government bonds 10-year yield as of June 6th, 2022. ©Holger Zschaepitz
At the same time, however, yields on 10-year U.S. Treasury bonds have already exploded to over 3% in recent months. The rise from the record low of 0.33% in mid-2020 is dramatic and is already putting bond, credit and real estate markets around the world on their head or under tremendous pressure. The ECB is now lagging well behind the U.S. Fed’s aggressive rate hike plan, while inflation in the Eurozone has exploded to its highest level in over 40 years.
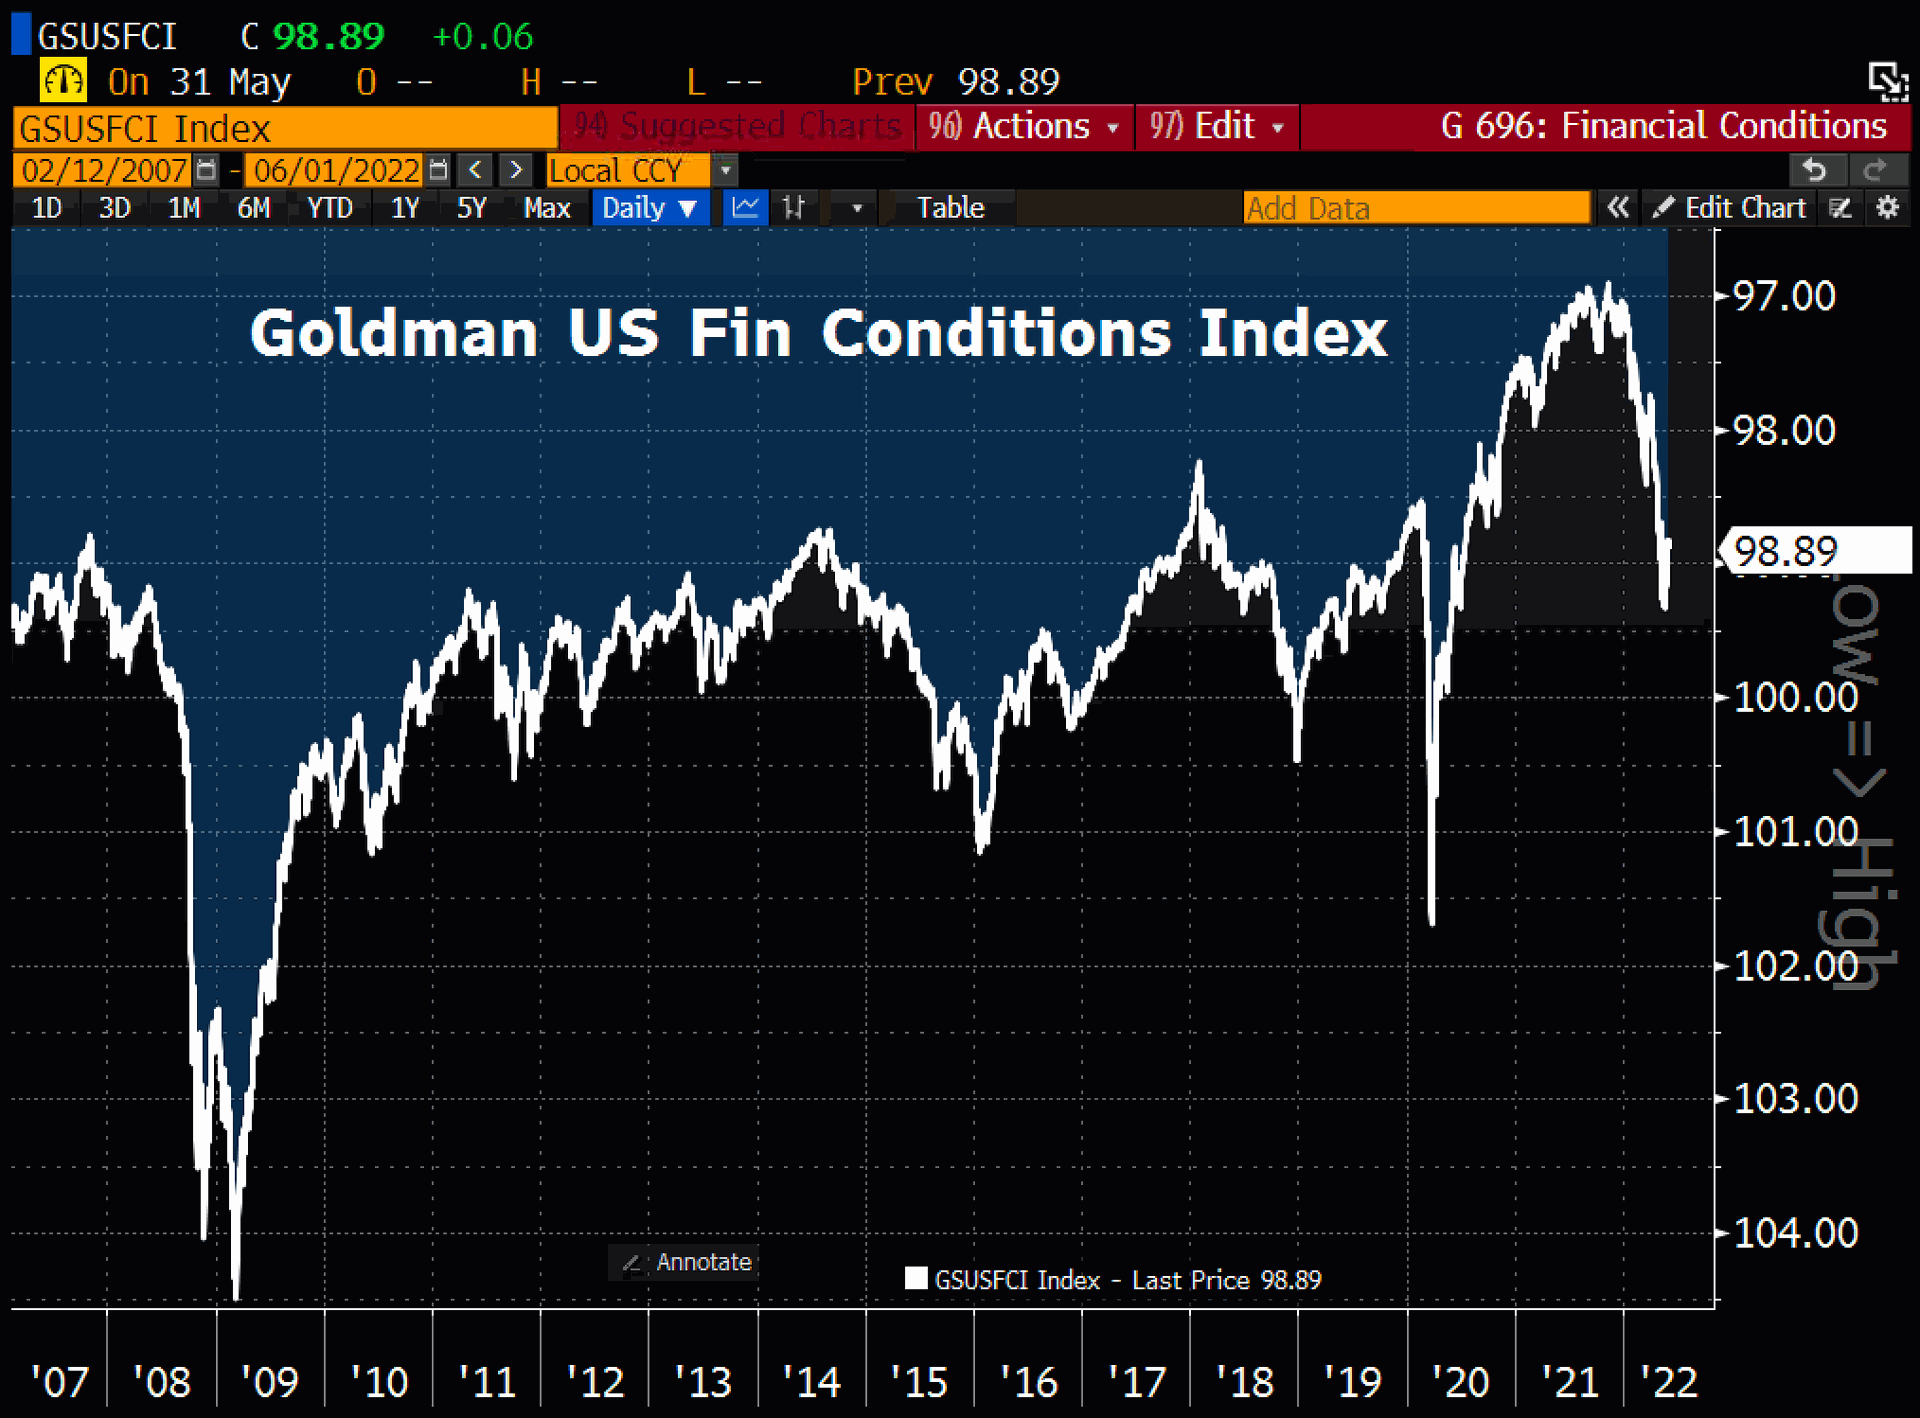
Financial situation in the U.S., as of June 1, 2022. ©Holger Zschaepitz
The bursting of the largest bond bubble of all time has caused a lot of stress throughout the financial system in recent months. Until early last week, the markets were trying to stabilize but the latest inflation data from U.S. showed, that inflation was still very high in May. It is however foreseeable, that the turmoil in the market swill lead to some form of demand destruction. Hence, we assume inflation is peaking out currently. Yes, it will very likely not withdraw back to 2%, but rather stay somewhere between 4% and 6% in the month to come. Nevertheless, the markets will already be deprived of a quarter of a trillion U.S. Dollar by the fall as part of the “quantitative tightening”.
Until the black month of September, the markets will likely trade range-bounded over the summer or, to the surprise of many, even recover somewhat more significantly. For the fall, however, one should expect new sell-offs and probably also new lows in the stock markets. This should then also affect bitcoin and cryptos.
Overall, the stock markets are in a bear market. The same applies to the crypto sector. The real estate markets are also likely to come under more significant pressure in the coming months. Cash remains king in this environment, and patience is the best advisor. October potentially could bring a brilliant entry opportunity in all markets.
7. Conclusion: Bitcoin – Extremely fearful sentiment offers chance for a bounce
The financial markets are in a brutal correction since November. Almost all stocks are down by double digits, some tech stocks have lost 70% to 90%! Gold, on the other hand, has held up better than most stocks and other asset classes. Only energy and agricultural commodities made significant gains throughout April.
Bitcoin and the entire crypto sector, on the other hand, took the hardest hit as the most speculative asset class. The ongoing crypto winter could easily last another year or two, as the next Bitcoin halving is not expected until early May 2024! After the incredible boom, cryptocurrencies are now in a brutal downturn. Unfortunately, this has always been the case in the past, and it is likely to be the case this time as well. During the boom, far too many bad projects and far too much greed emerged in the crypto sector. Now the sector is undergoing a dramatic and brutal cleansing and detox, wiping out all the weak projects and all the fraudulent players. In the medium term, however, bitcoin will survive and come back stronger than before. However, it needs time to do so.
Bitcoin is down -63% so far
From the high, bitcoin has lost about -63% so far, which is rather low compared to previous cycles. In past cycles, bitcoin has always lost more than -80% in those down cycles! Therefore, considering the weak recovery since the recent low at US$25,500, we may not have seen the final bottom yet. However, bottoming phases in bitcoin have always looked similar to what we are currently seeing. Therefore, we tend to assume in the short term that bitcoin could manage to get a bounce going towards approx. US$35,000 by the summer.
In the fall, however, bitcoin could then correct further towards US$22,500 or even move below US$20,000 in search of the final low. We think it’s crucial to understand, that the current tight U.S. monetary policies are new for bitcoin. Since bitcoin was invented in 2009 U.S. monetary policy have always been very expansionary and soft.
How long the FED can keep up this painful path is impossible to predict at the moment. At the latest, when the credit markets are starting to implode, they will have to go back to printing money. That is when gold and also bitcoin will both take off.
To sum up, the extremely fearful sentiment offers a chance for a bounce in the short-term. In the medium term, however, bitcoin is in a crypto winter. Long-term, though, prices below US$30,000 and especially below US$25.000 are most likely a good buying opportunity.
Feel free to join us in our free Telegram channel for daily real time data and a great community. If you like to get regular updates on our gold model, precious metals, commodities, and cryptocurrencies you can also subscribe to our free newsletter.
Disclosure: This article and the content are for informational purposes only and do not contain investment advice or recommendations. Every investment and trading move involves risk, and readers should conduct their own research when making a decision. The views, thoughts and opinions expressed here are the author’s alone. They do not necessarily reflect or represent the views and opinions of Midas Touch Consulting.