Bitcoin’s price action in the last four weeks has been characterised by consolidation and a lack of decisive movement. The market is eagerly anticipating a breakout, and the next significant price direction will likely depend on factors such as market sentiment, macroeconomic trends, and potential catalysts within the cryptocurrency ecosystem. However, caution is still advised, as external factors such as macroeconomic conditions, regulatory developments, and market sentiment will influence Bitcoin’s price trajectory. Bitcoin – Breakout to the upside is most likely.
1. Review
Since hitting a low of USD 24,756 on 15th June, Bitcoin has experienced a significant increase of over 27% fueled by the excitement surrounding a potential Bitcoin ETF by BlackRock, the world's largest asset manager. At its peak, prices reached USD 31,850, the highest level in over 12 months. However, those who missed the initial nine days of this sharp rally in mid-June are now facing a three-week sideways consolidation. Despite repeated attempts, Bitcoin has been unable to break through its resistance zone between USD 30,750 and USD 31,850. Instead it has pulled back slightly on Friday.
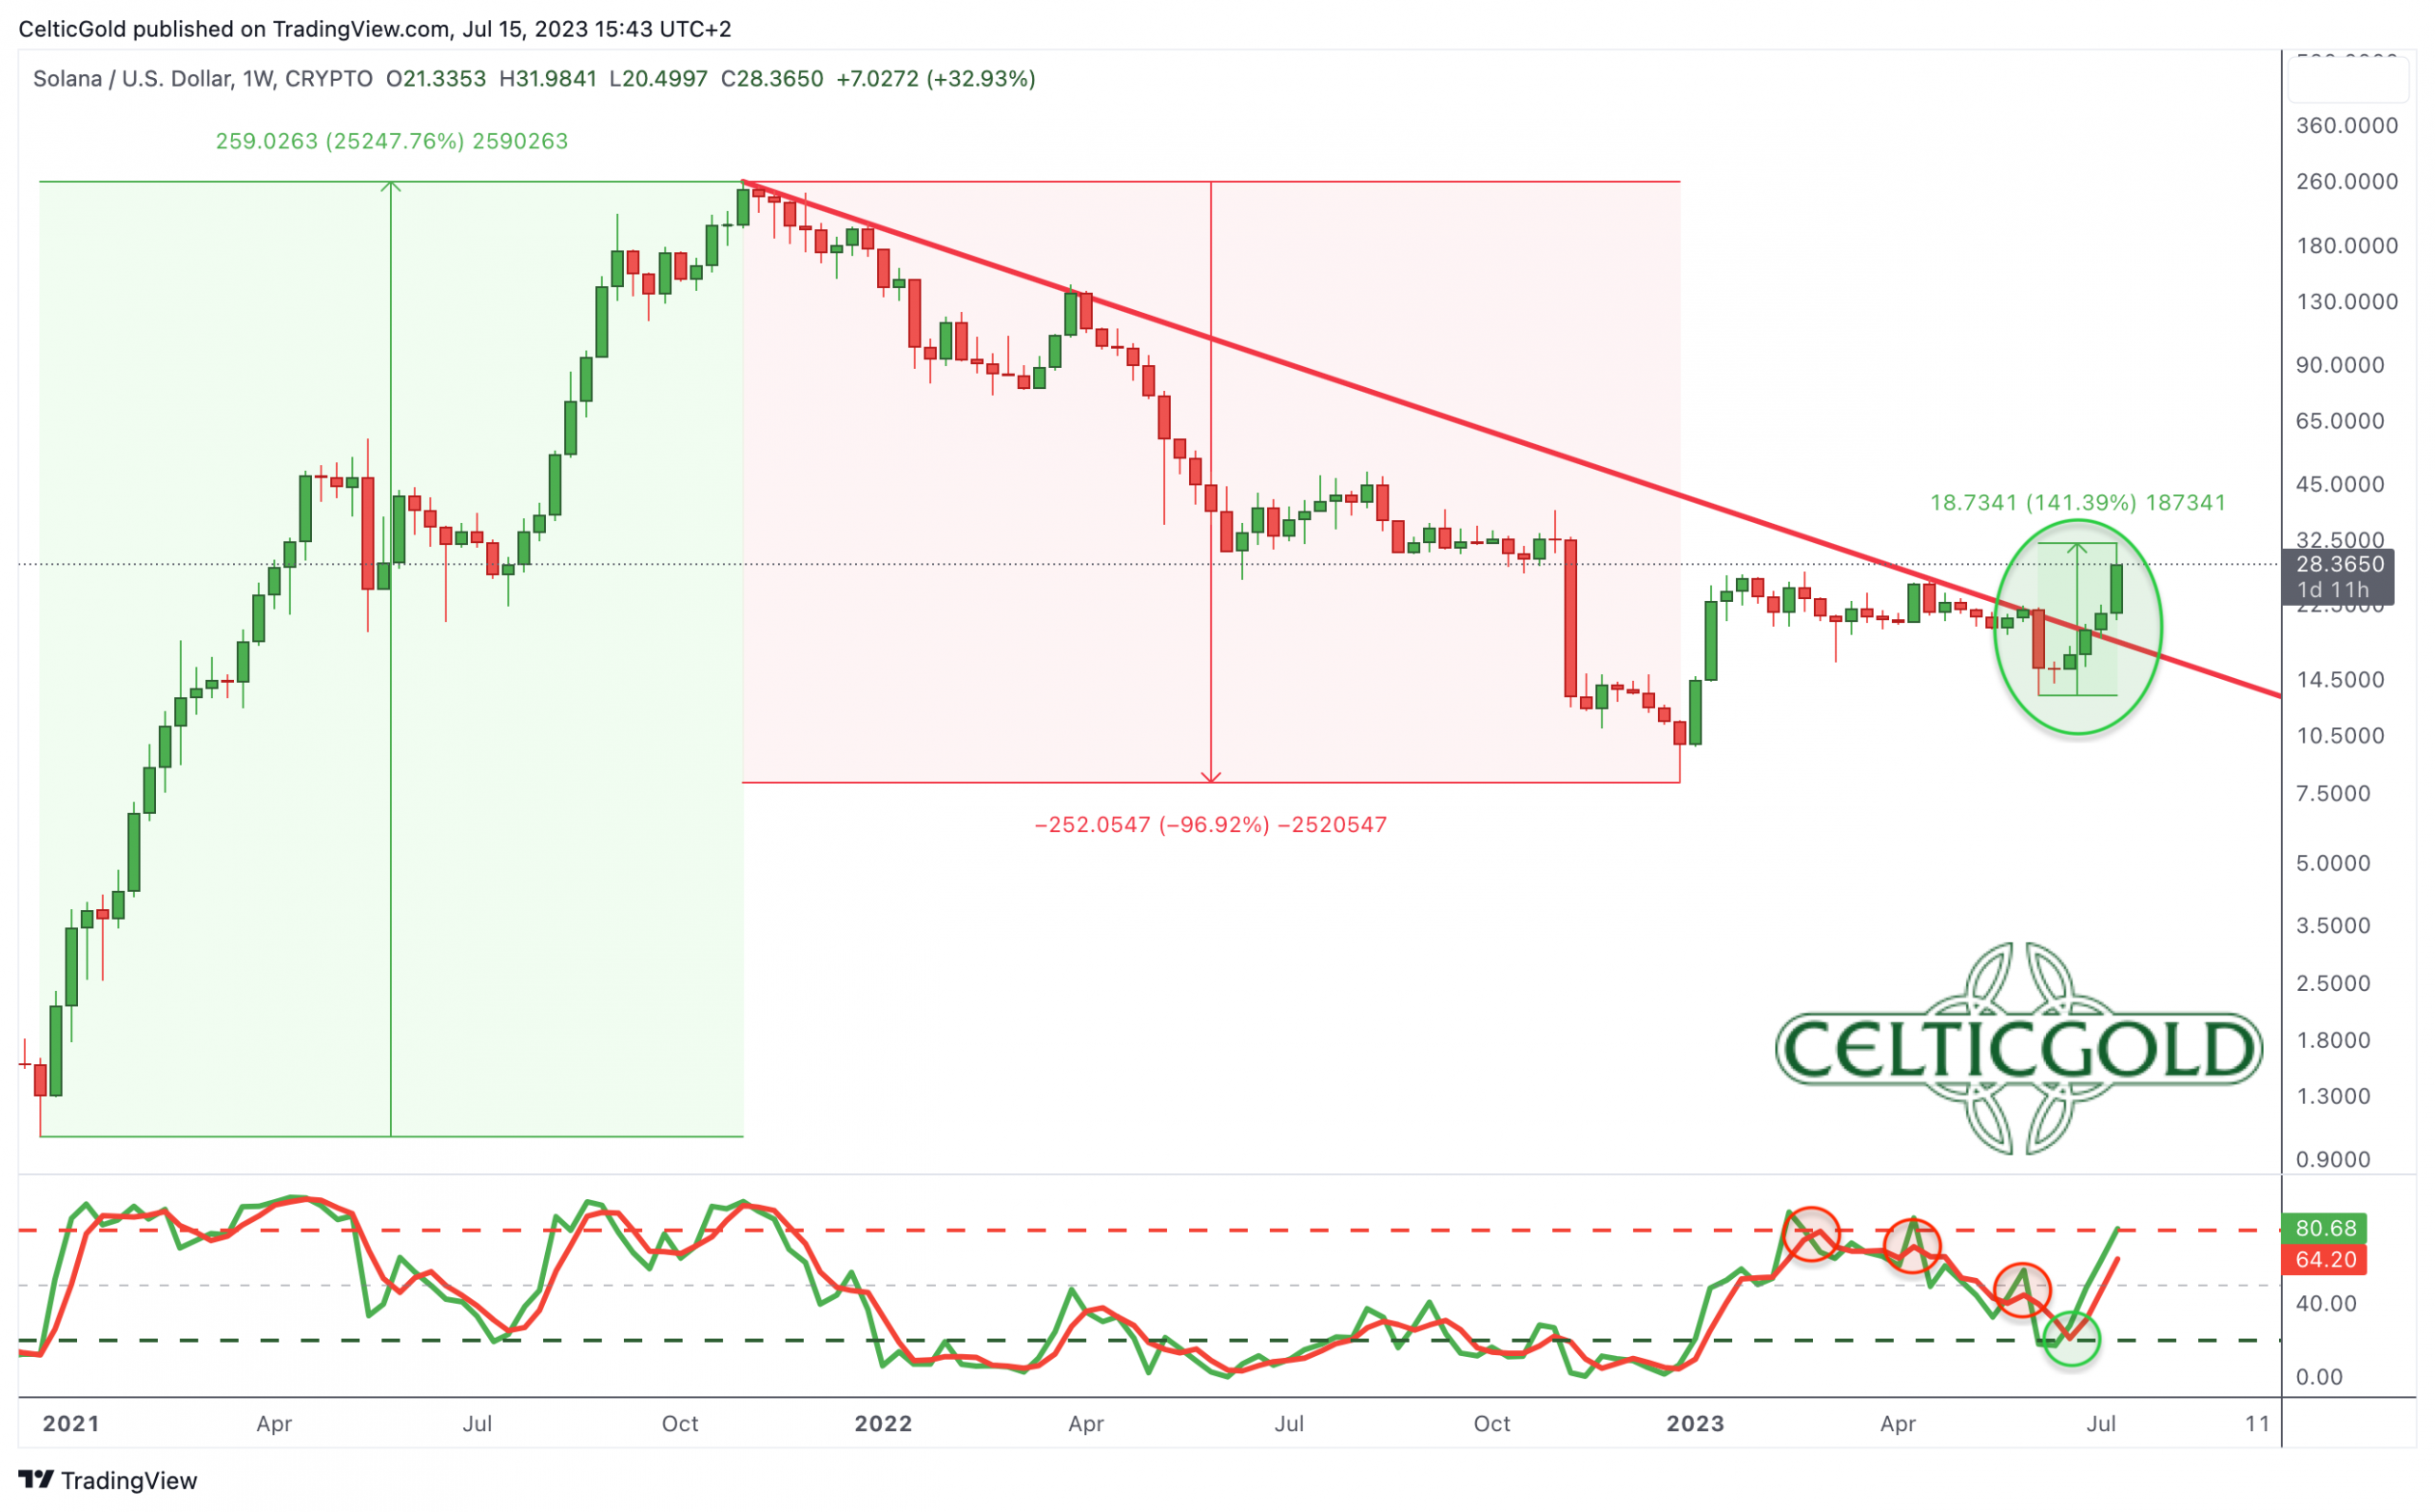
 Solana in USD, weekly chart as of July 15th, 2023. Source: Tradingview
Solana (SOLUSD) has seen an even more impressive surge, gaining over 75% since mid-June. The bear market and the FTX debacle had a significant impact on the blockchain project last year, causing its coin to crash 97%. However, it now appears that the worst is behind Solana, and it is gradually establishing its relevance, much like Ethereum did in 2019. Recently, there was a noteworthy inflow of over USD 1 billion in a single trading day, potentially indicating institutional investors positioning themselves as Solana may play an important role in the Web3 and DeFi sector in the medium to long term. Hence, in a new crypto bull market, Solana likely has a significantly greater upside potential in terms of price performance compared to Ethereum.
2. Technical Analysis for Bitcoin in US-Dollar
2.1 Bitcoin Weekly Chart – Breaking out above USD 31,800 would be the next logical step
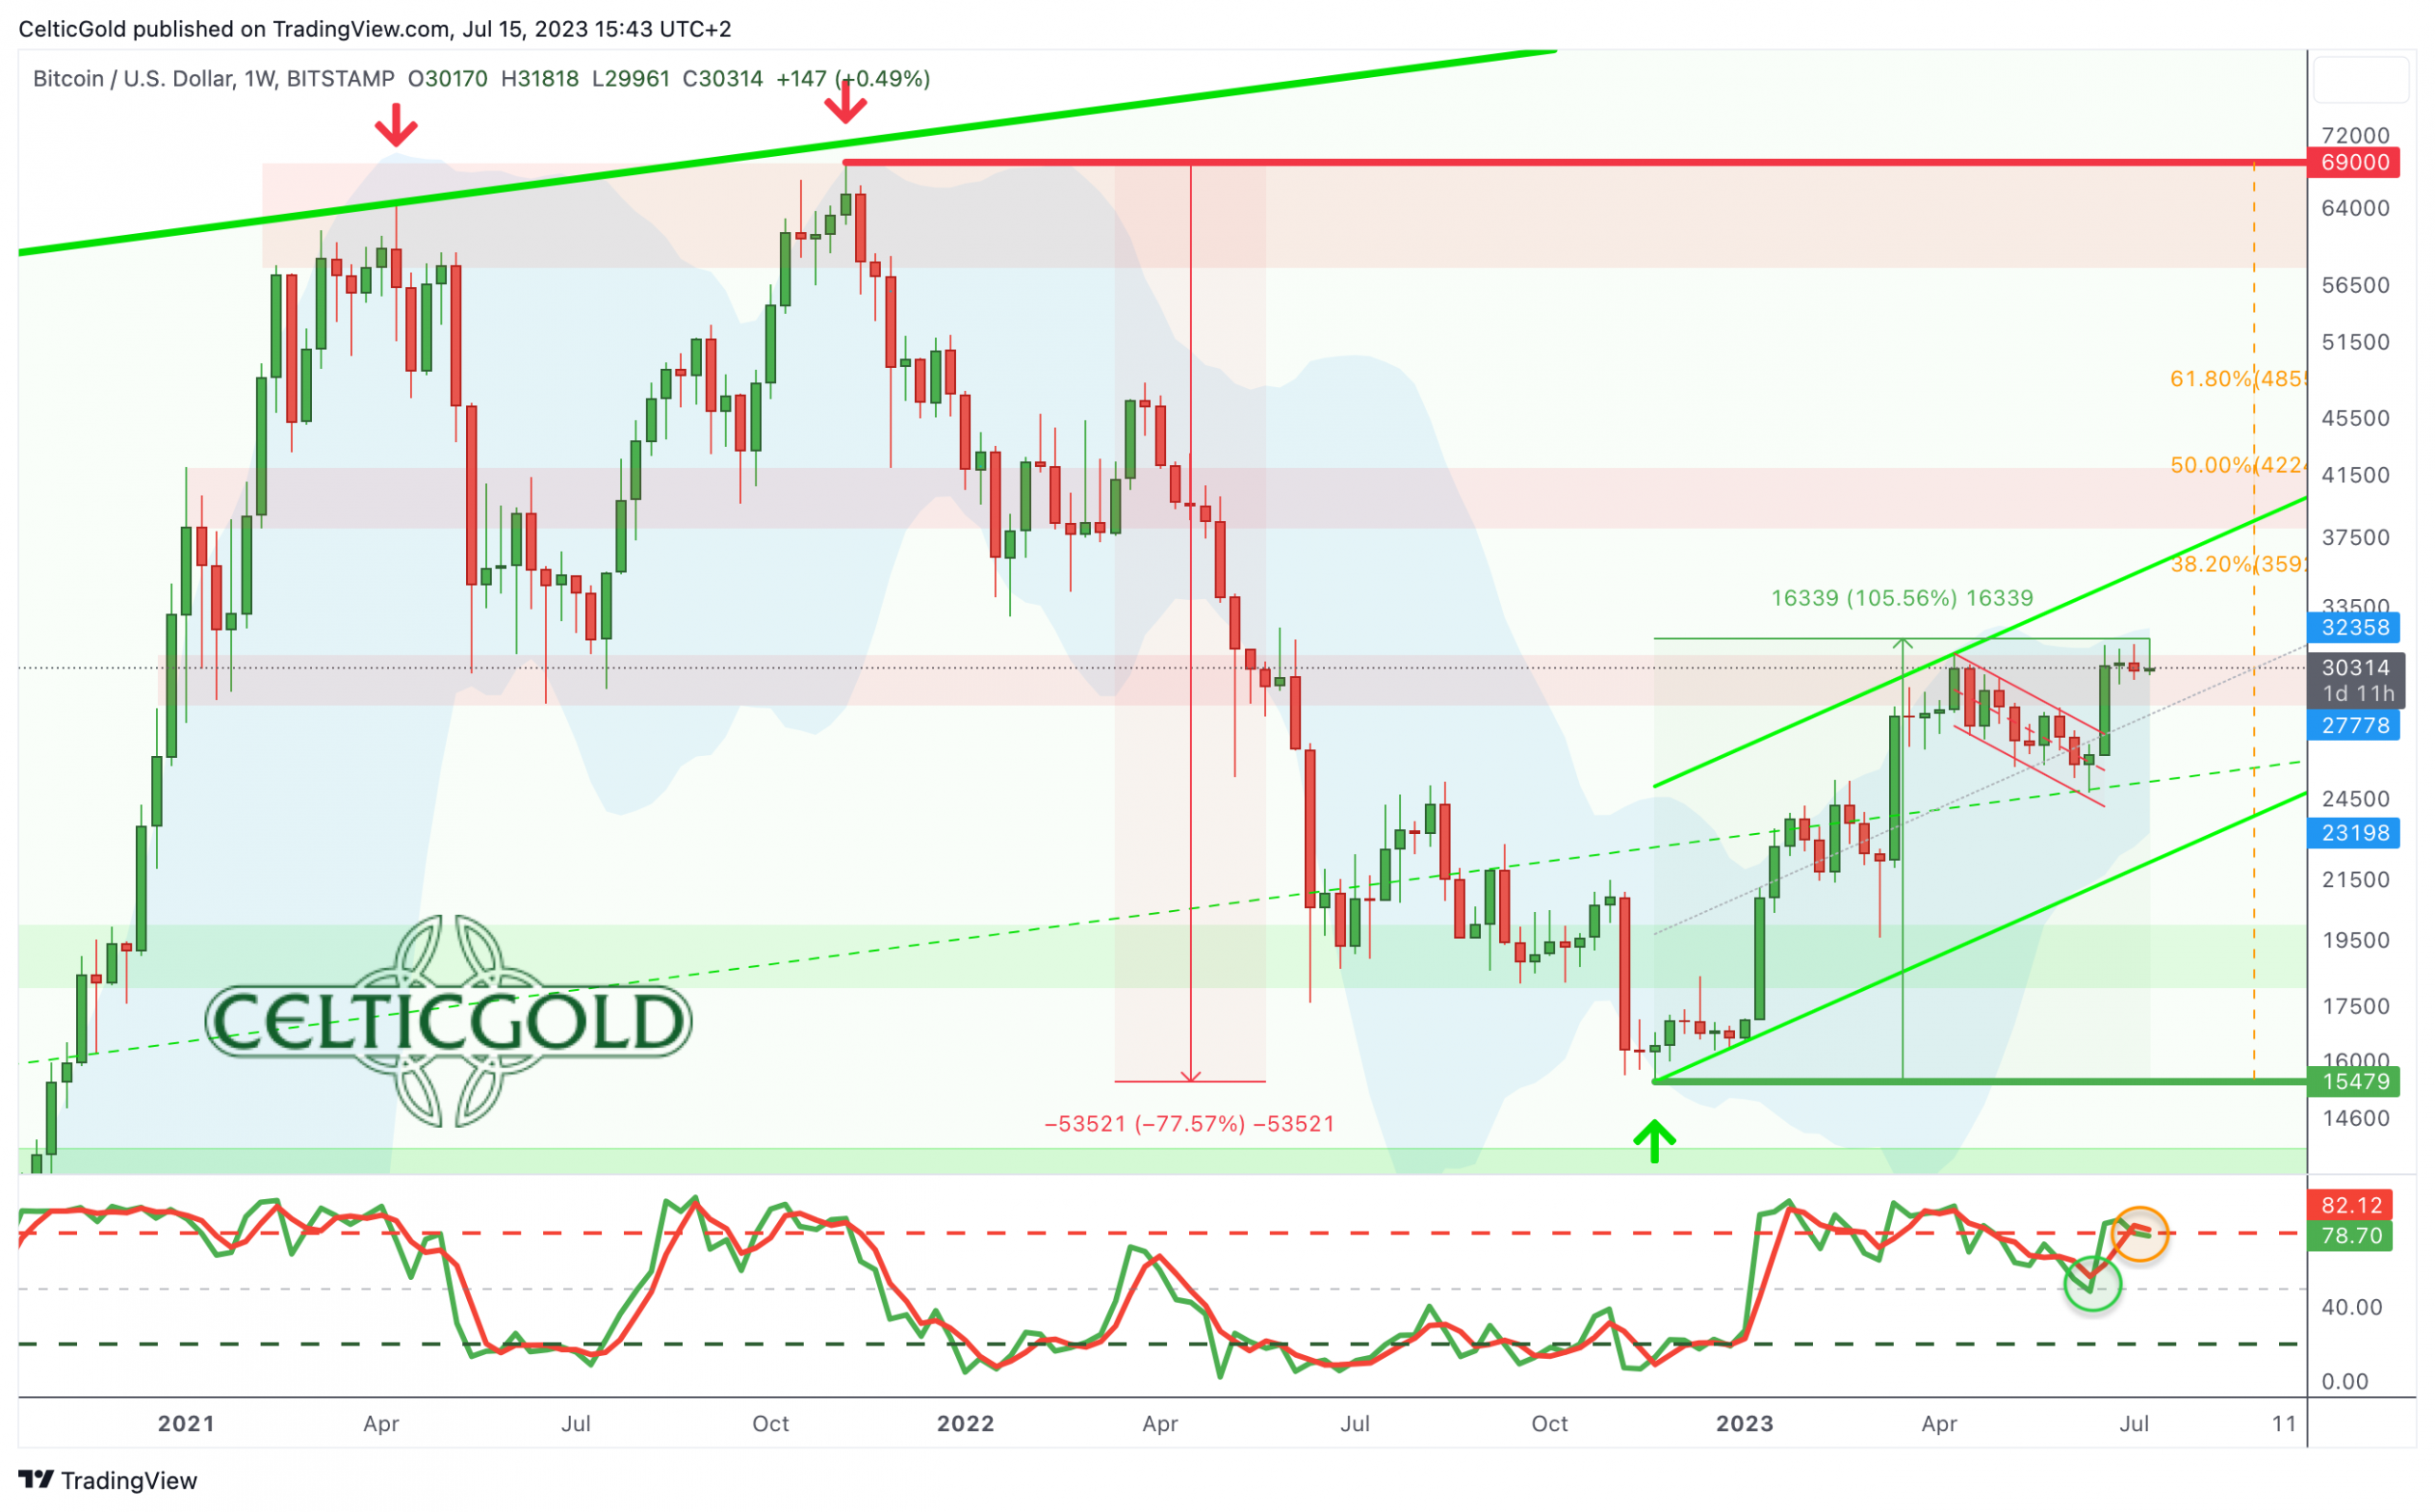
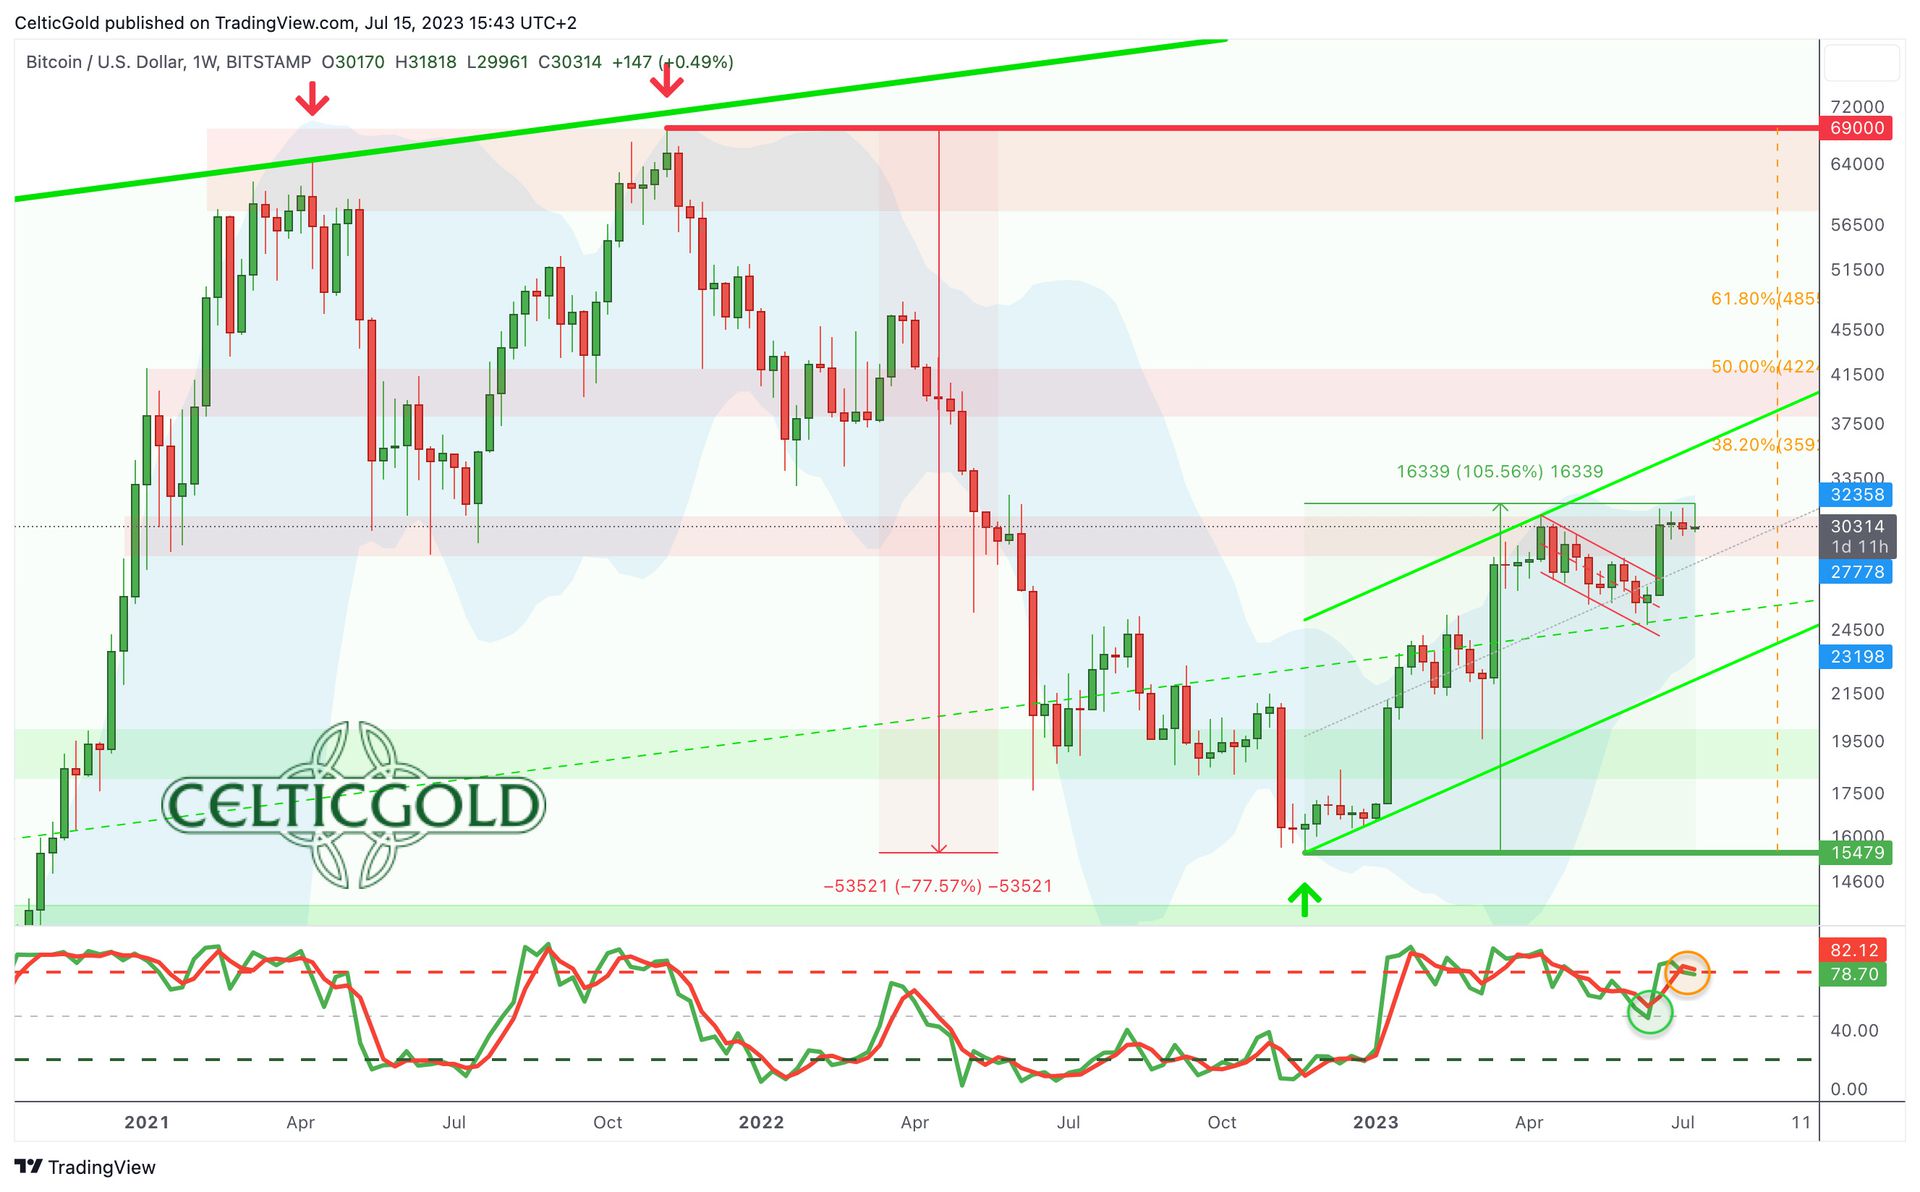 Bitcoin in USD, weekly chart as of July 15th, 2023. Source: Tradingview
On the weekly chart, Bitcoin forcefully broke out of its corrective flag pattern. Since that significant green breakout candle, prices have been hovering around the upper edge of the resistance zone between USD 30,750 and USD 31,800. A successful breakout would likely result in a rapid ascent towards the upper Bollinger Band (USD 32,500), the upper trend channel boundary (approximately USD 33,500), and subsequently the 38.2% retracement level at USD 35,924.
Reaching this 38.2% retracement around USD 36,000 would mark the completion of the minimum recovery or bounce in response to last year’s bear-market. It would not be surprising if Bitcoin would then take a breather in that range between USD 35,000 and USD 37,000. Additionally, the overbought condition indicated by the weekly Stochastic oscillator suggests that pushing even higher will not be an easy task.
2.2 Rally directly towards USD 48,555?
Alternatively, the rally may continue directly, with the bulls potentially gaining further momentum. In order to inflict the maximum amount of pain on latecomers they must be denied any opportunity to join the moving train with a reasonably favourable risk/reward ratio.
Our overall target remains the 61.8% retracement at USD 48,555. With some luck, Bitcoin may even reach the psychological level of USD 50,000. However, we do not expect much more for Bitcoin this year. Instead, after reaching the 61.8% retracement, we anticipate a significant pullback, potentially leading to medium-term prices around or below USD 30,000 and possibly even around or below USD 25,000.
In summary, the weekly chart is bullish, and a rise towards USD 35,000 to USD 37,000 would be the next logical step. Temporary pullbacks should hold above USD 28,500. However, the anticipated breakout above USD 31,500 could generate enough momentum to catapult Bitcoin directly towards the major resistance zone between USD 45,000 and USD 50,000.
2.3 Bitcoin Daily Chart – Bollinger Band Squeeze is developing
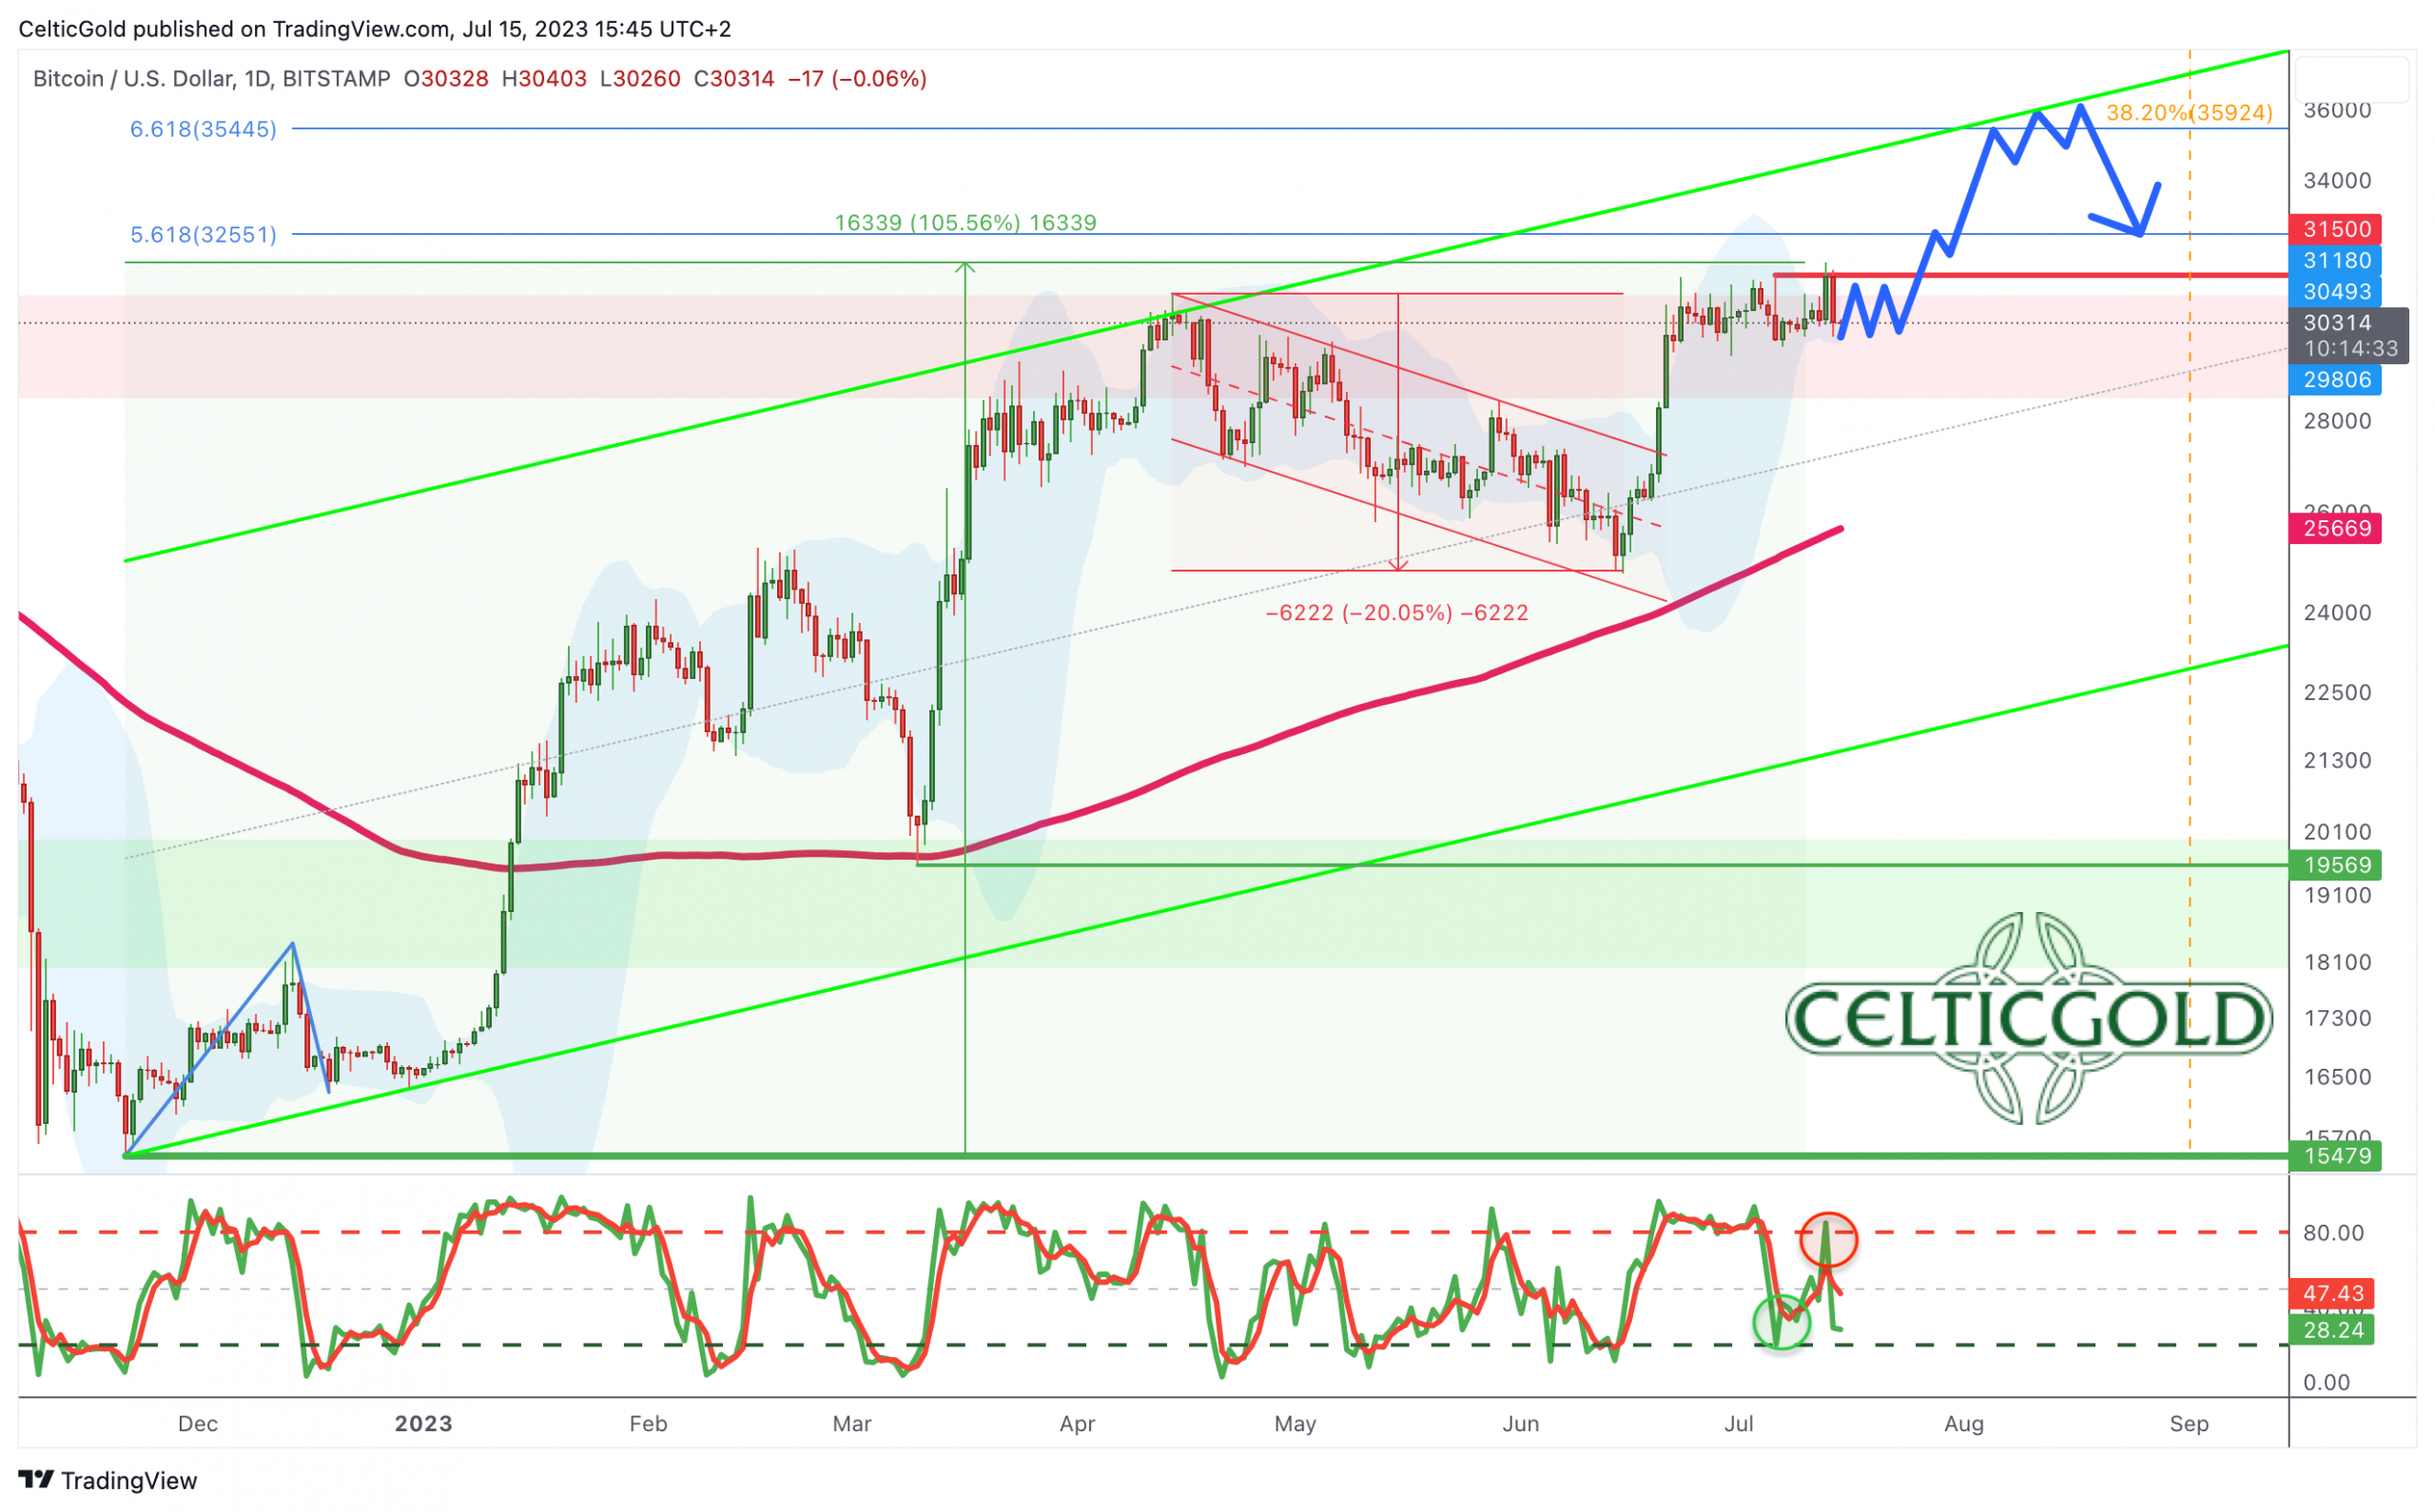
 Bitcoin in USD, daily chart as of July 15th, 2023. Source: Tradingview
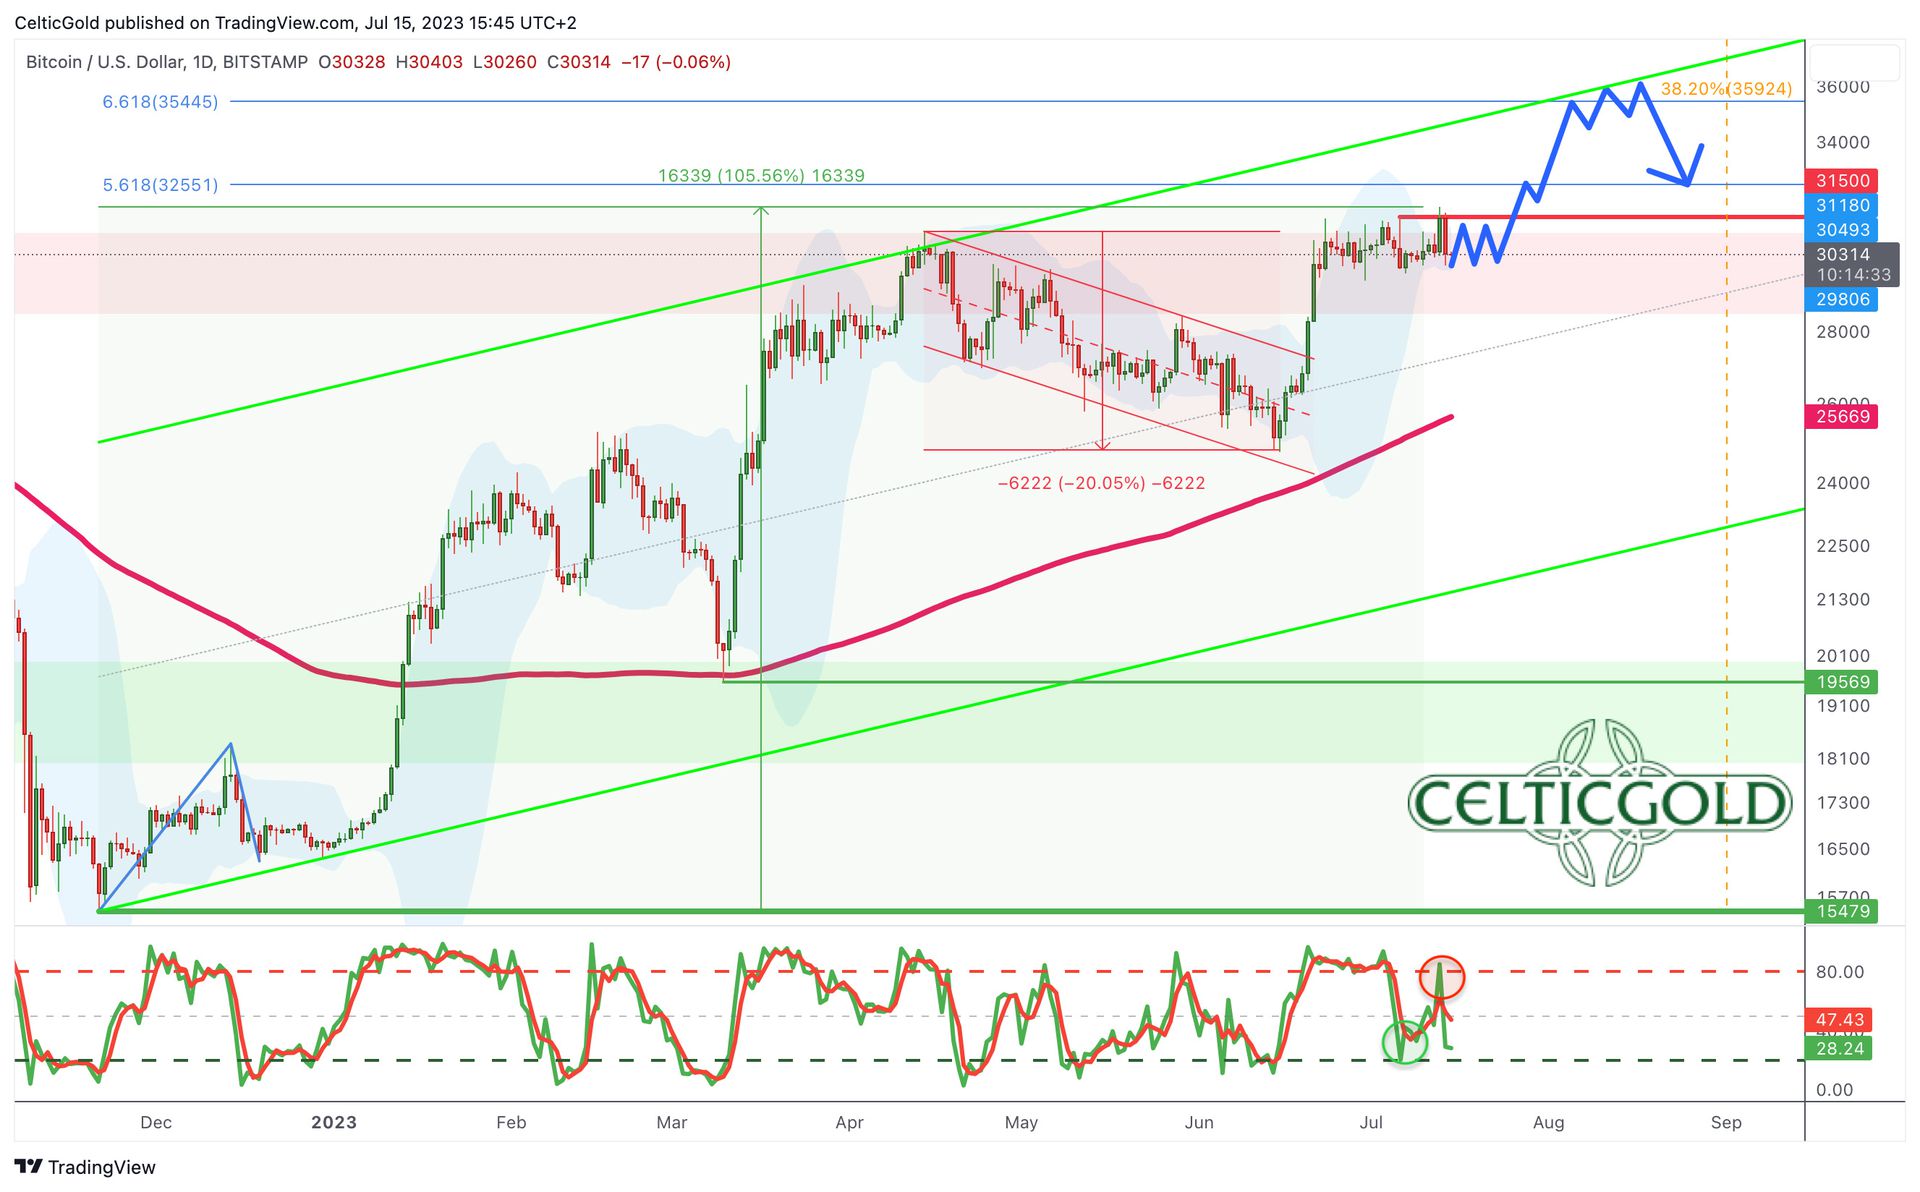
On the daily chart, the price action has been confined within a tight range primarily between approximately USD 30,000 and USD 30,800 for the past 22 trading days. Occasional spikes to the upside and downside have been quickly contained. Thanks to this prolonged period of sideways movement, the Bollinger Bands have also been moving sideways or in parallel. We suspect that a Bollinger Band Squeeze is developing here. This occurs when volatility diminishes, and the two bands contract or narrow. Eventually, a breakout from the sideways band indicates the beginning of the next trending move, which, given the accumulated energy, can have explosive characteristics.
After countless attempts by the bulls to breach the resistance zone around USD 31,500 since mid-April, a breakout above it would indeed initiate a strong up-trending move. The active buy signal from the Stochastic indicator is also positive in this context.
Overall, the daily chart is bullish. However, it may still take another week or two until enough energy has built up for a breakout to the upside. On the downside, Bitcoin has strong support around USD 30,000 already. Hence, the “worst-case scenario” currently suggests a decline towards the swiftly rising 50-day moving average at around USD 28,585.
3. Sentiment Bitcoin – Market participants are regaining confidence
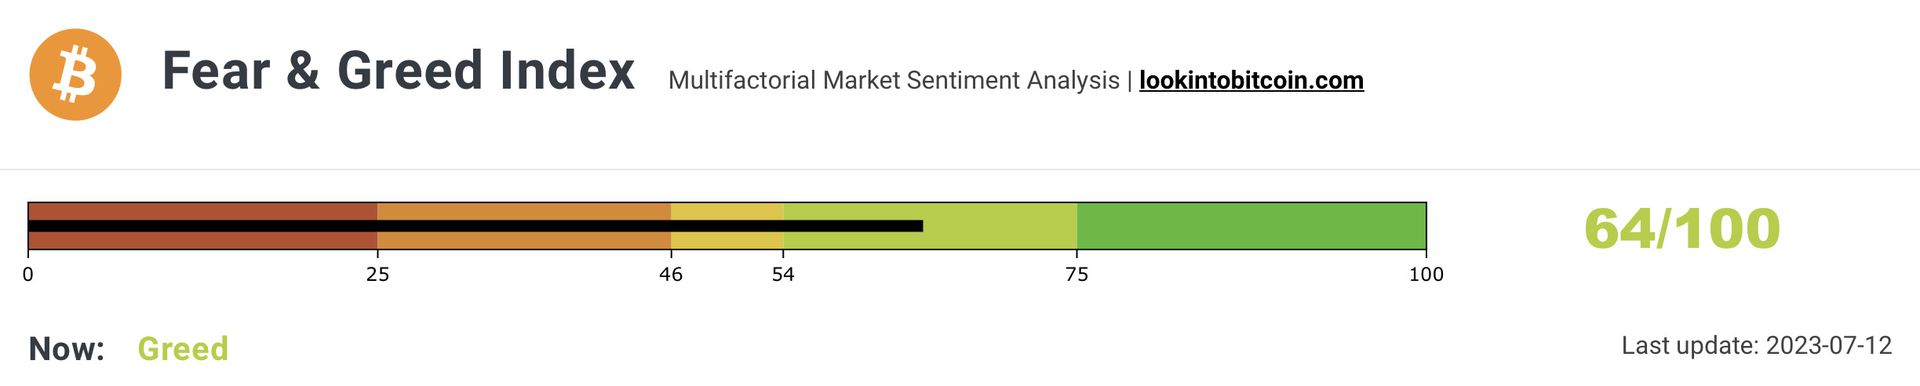 Crypto Fear & Greed Index, as of July 12th, 2023. Source: Lookintobitcoin
Thanks to the significantly increased Bitcoin prices, the sentiment in the crypto sector has greatly improved, too. The “Crypto Fear & Greed Index” has risen from 47 to the current level of 64 over the past four weeks.
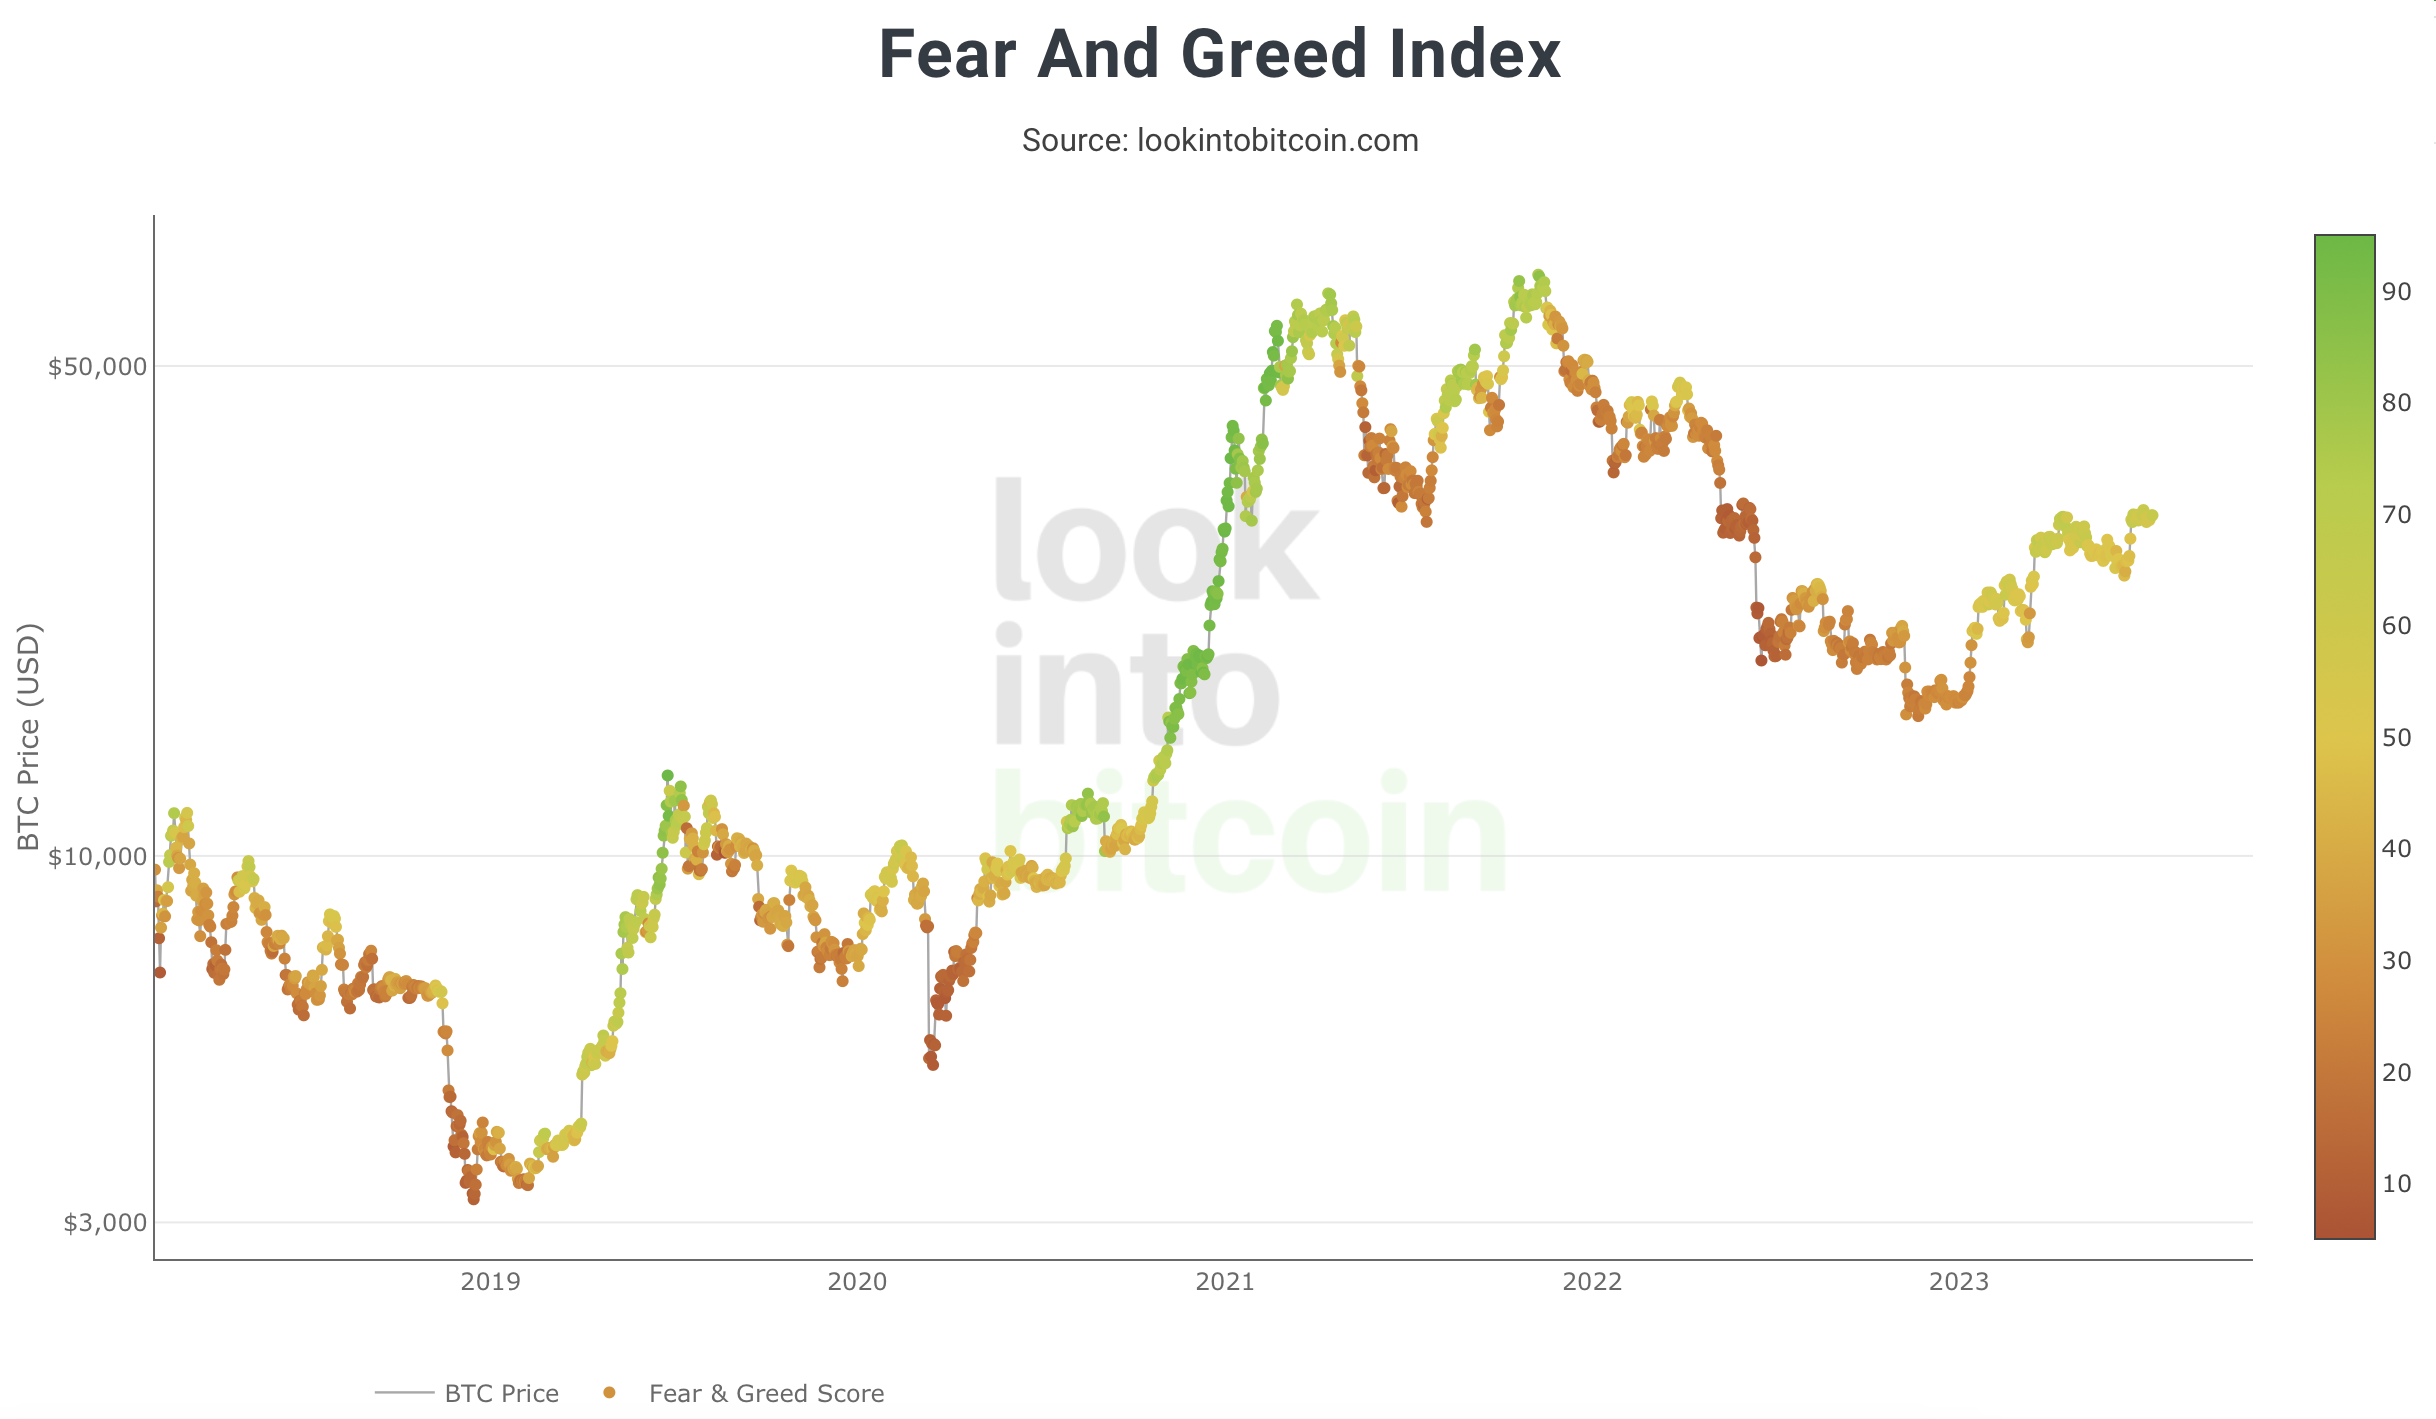
 Crypto Fear & Greed Index long term, as of July 12th, 2023. Source: Lookintobitcoin
Overall, the sentiment recovery is continuing. However, extreme greed, high euphoria, and excessive optimism are not evident. Hence, from a sentiment perspective, there is still plenty of room for Bitcoin’s rally to continue upwards.
4. Seasonality Bitcoin – Unfavorable seasonality since mid-June
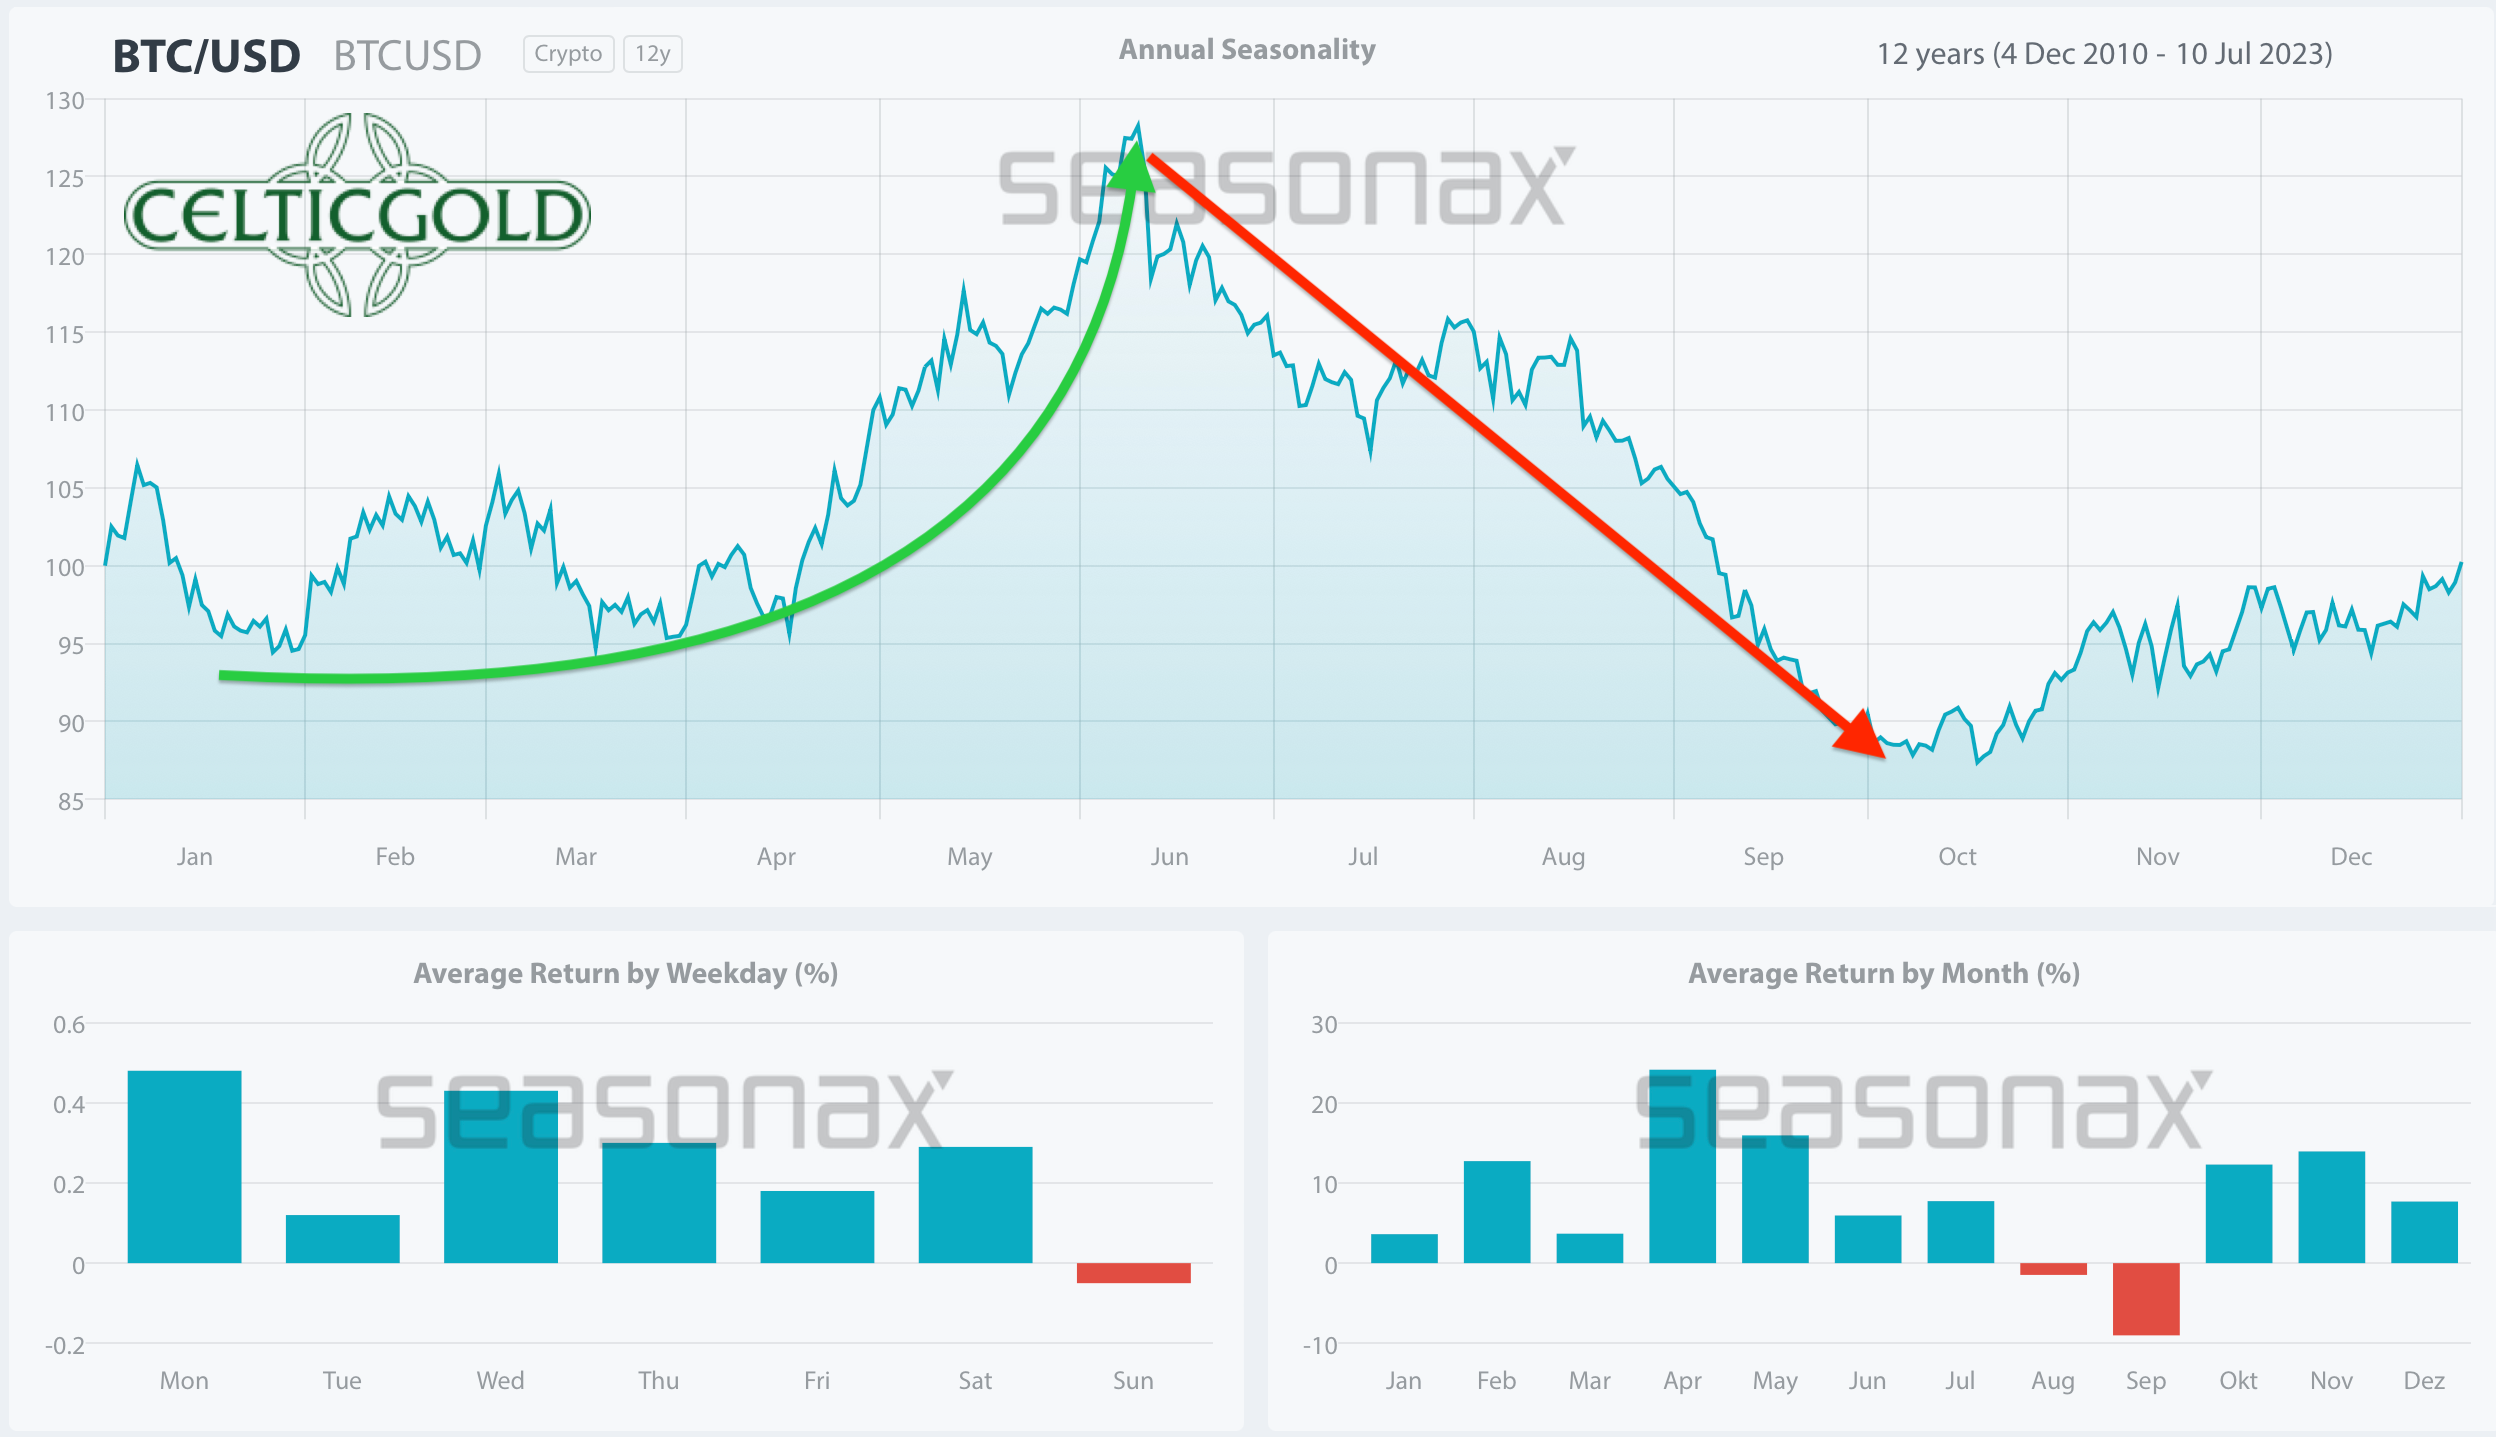
 Seasonality for Bitcoin, as of July 12th, 2023. Source: Seasonax
The seasonal pattern for Bitcoin has been negative since mid-June, posing a clear obstacle to the bullish ambitions. However, things do change over time. Additionally, markets do not adhere to their seasonal statistics approximately two out of ten years. Therefore, the negative seasonal signal should not be overemphasised.
It is worth noting, however, that statistically speaking, Bitcoin tends to exhibit weakness until October based on the data from the past ten years.
5. Sound Money: Bitcoin vs. Gold
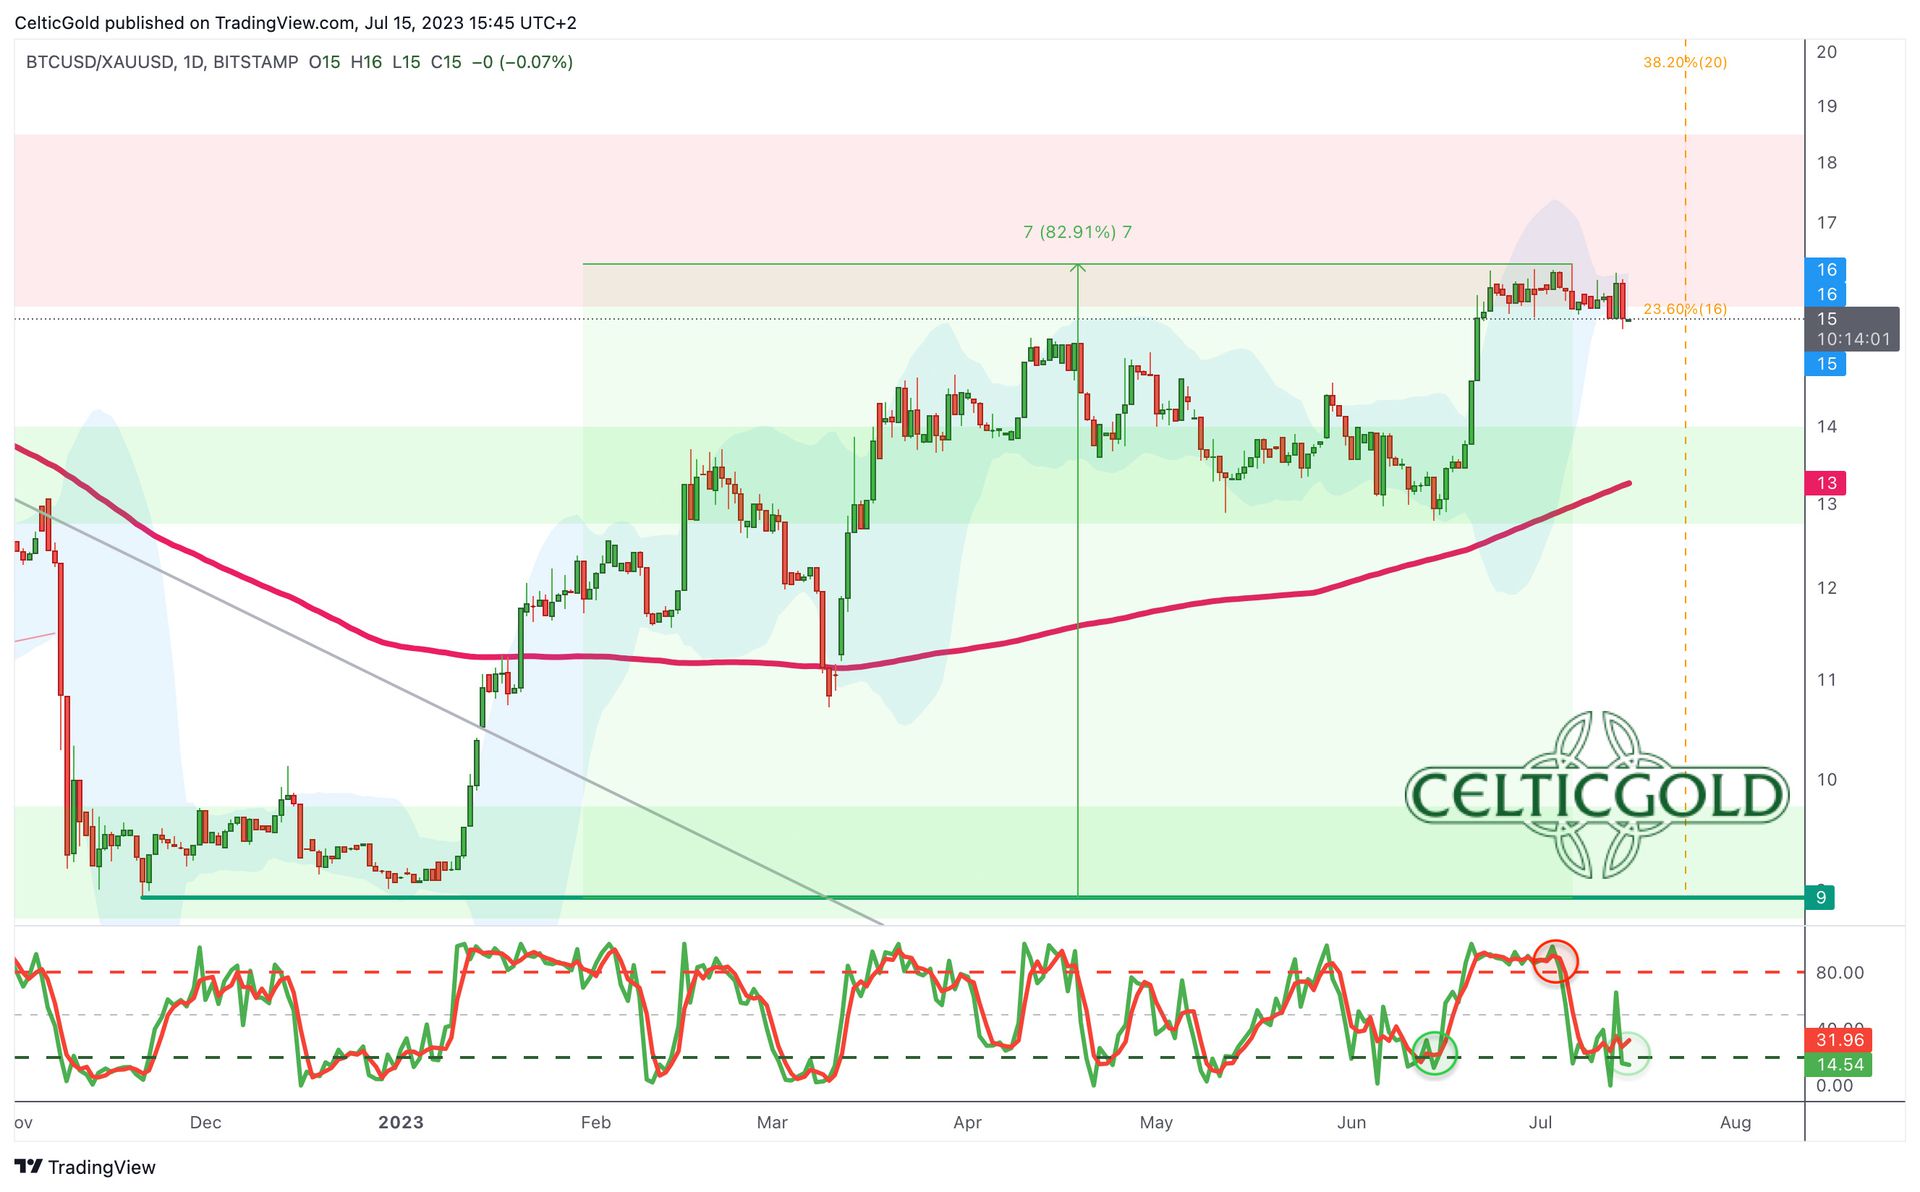 Bitcoin/Gold-Ratio, weekly chart as of July 15th, 2023. Source: Tradingview
Gold prices likely reached their typical early summer low around USD 1,893 two weeks ago and are expected to target the resistance zone around USD 2,075 again in the next one to three months. The breakout to new all-time highs (our first target being USD 2,525) could potentially occur in the third or fourth quarter 2023. On the other hand, Bitcoin is currently consolidating its strong surge from the second half of June and is eyeing a breakout above USD 31,800 in the short term.
At prices of around USD 30,350 for one Bitcoin and USD 1,955 for one ounce of gold, one currently needs to pay about 15.52 ounces of gold for one Bitcoin. Conversely, one ounce of gold currently costs approximately 0.064 Bitcoin. Overall, Bitcoin (+82.85%) remains the faster horse as it has clearly outperformed gold (+6.64%) by a factor of 12.4 since the beginning of the year.
Looking back, as expected four weeks ago, the Bitcoin/Gold-ratio has significantly increased and has surpassed our interim target of 15. If Bitcoin does break out above USD31,800 and continues to rise, ratio values between 17.5 and 21.5 are possible in the second half of the year. If Bitcoin does reach our year-end target of USD 48,550 and gold would simultaneously rise to USD 2,525, the ratio would be at 19.22, which is 23.65% higher than the current level.
6. Macro Update – When will the next rescue action become necessary?
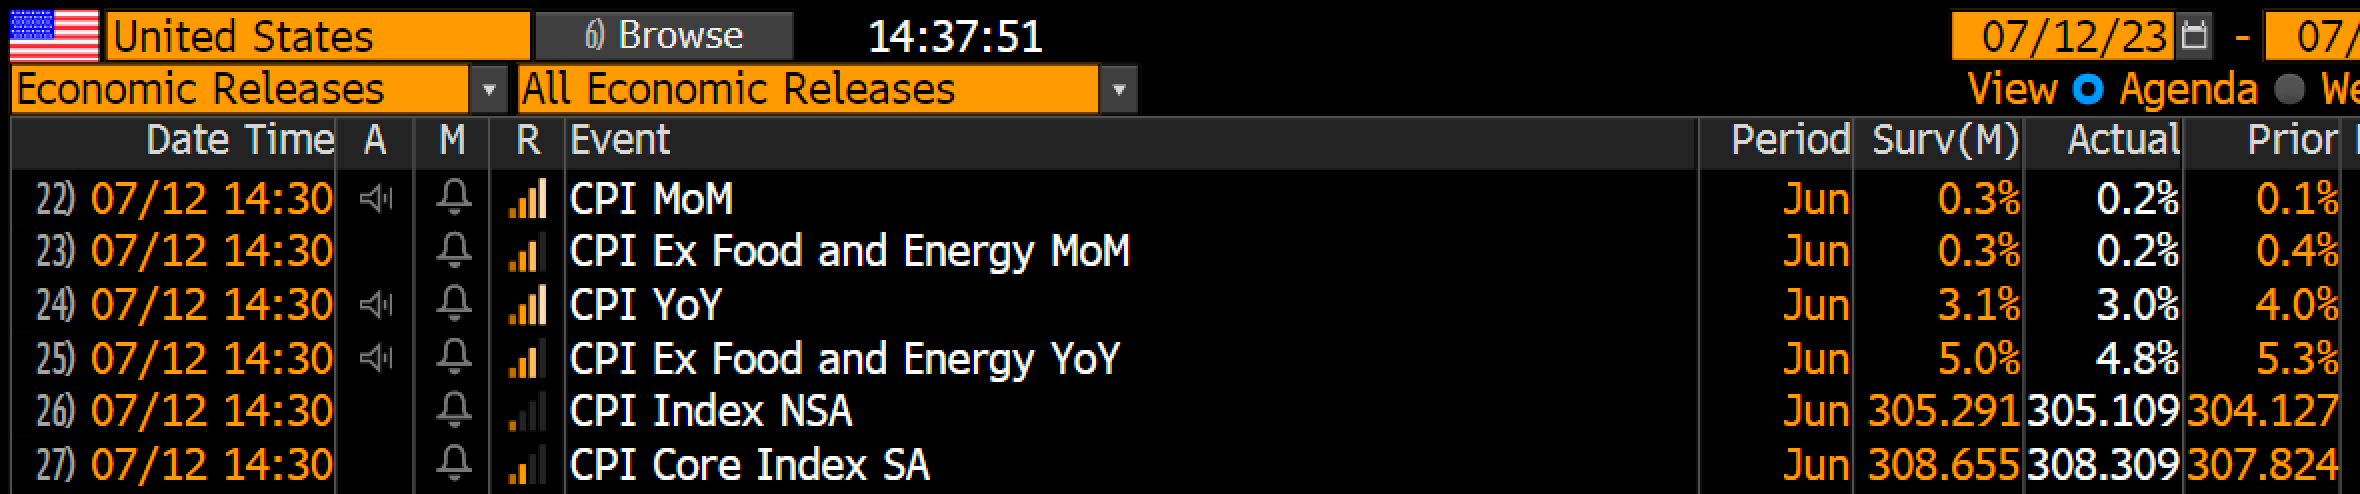
 U.S. inflation data, as of July 12, 2023. Source: Holger Zschäpitz
The U.S. inflation data, released last Wednesday, indicated a further slowdown in both core and headline inflation in June. On a year-on-year basis, the headline price index slowed to +3%, while the core price index fell to “only” +4.8%. Overall, the data came in lower than expected, fueling hopes that the FED would end its rate hikes. The FED had recently paused its rate hikes but continued to maintain a restrictive and hawkish tone.
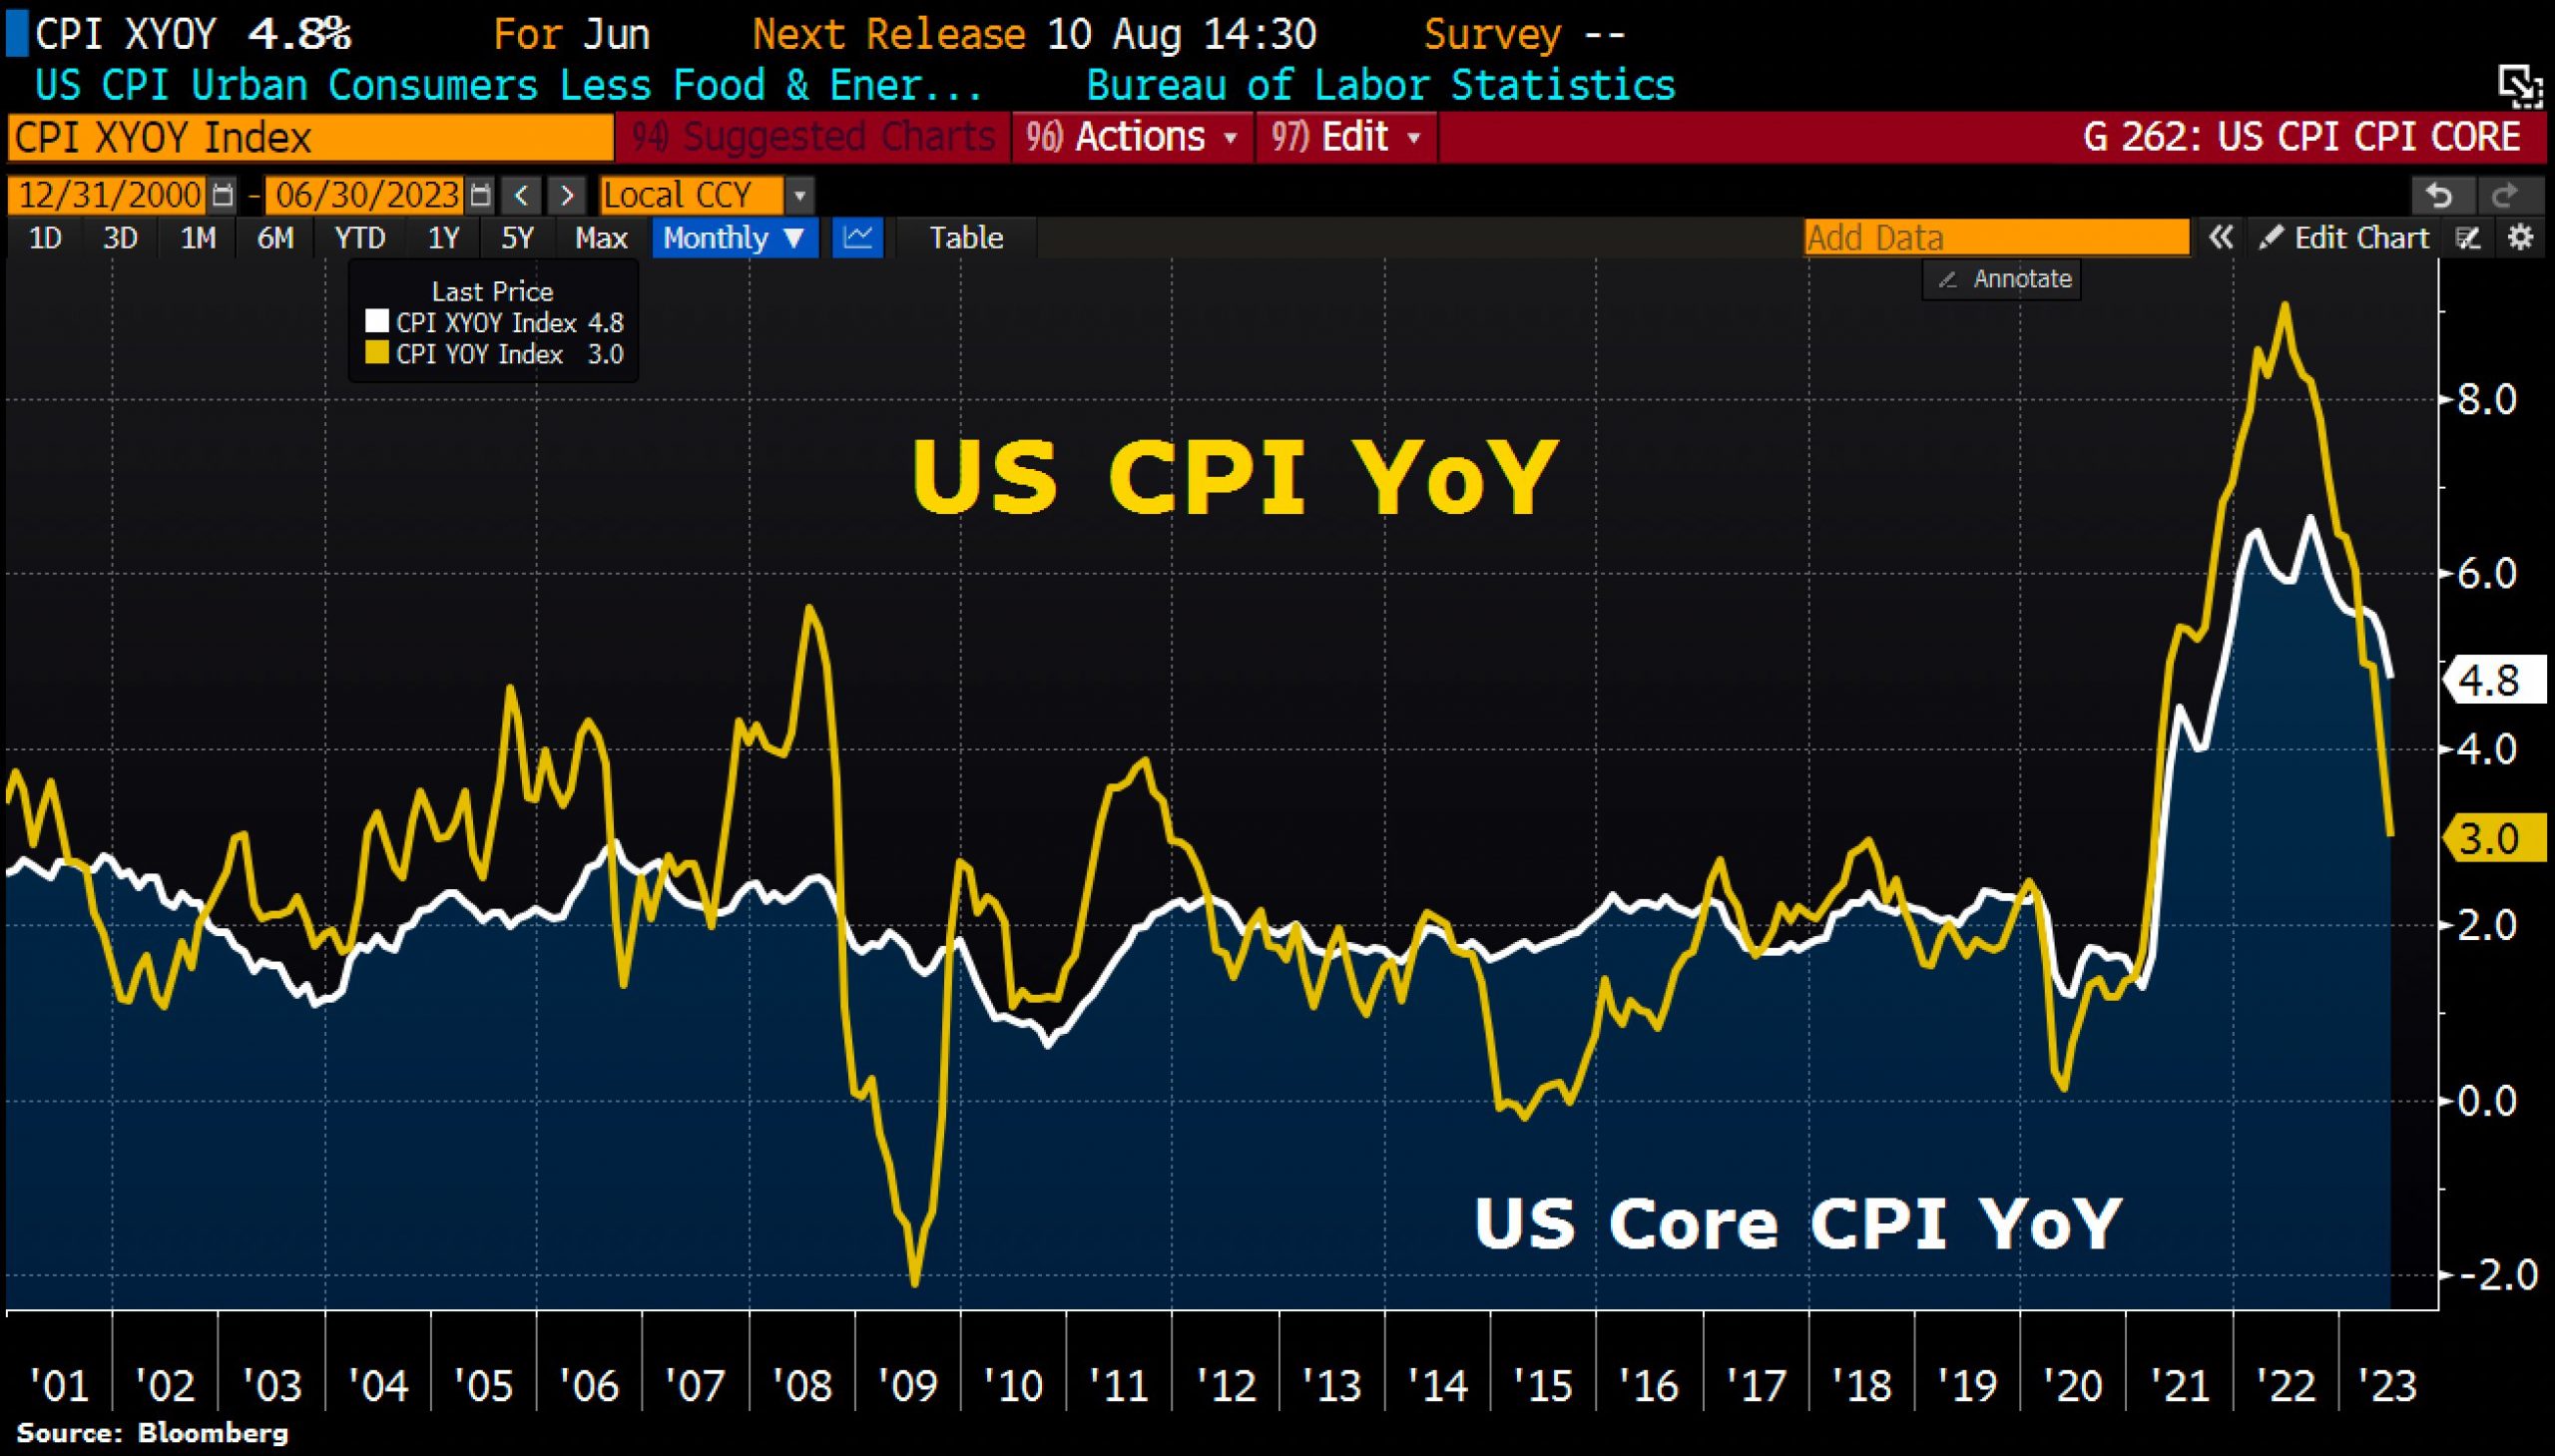
 U.S. inflation data, as of July 12, 2023. Source: Holger Zschäpitz
It is possible that both, the markets, and the FED, initially underestimated the rise as well as now the slump in inflation.
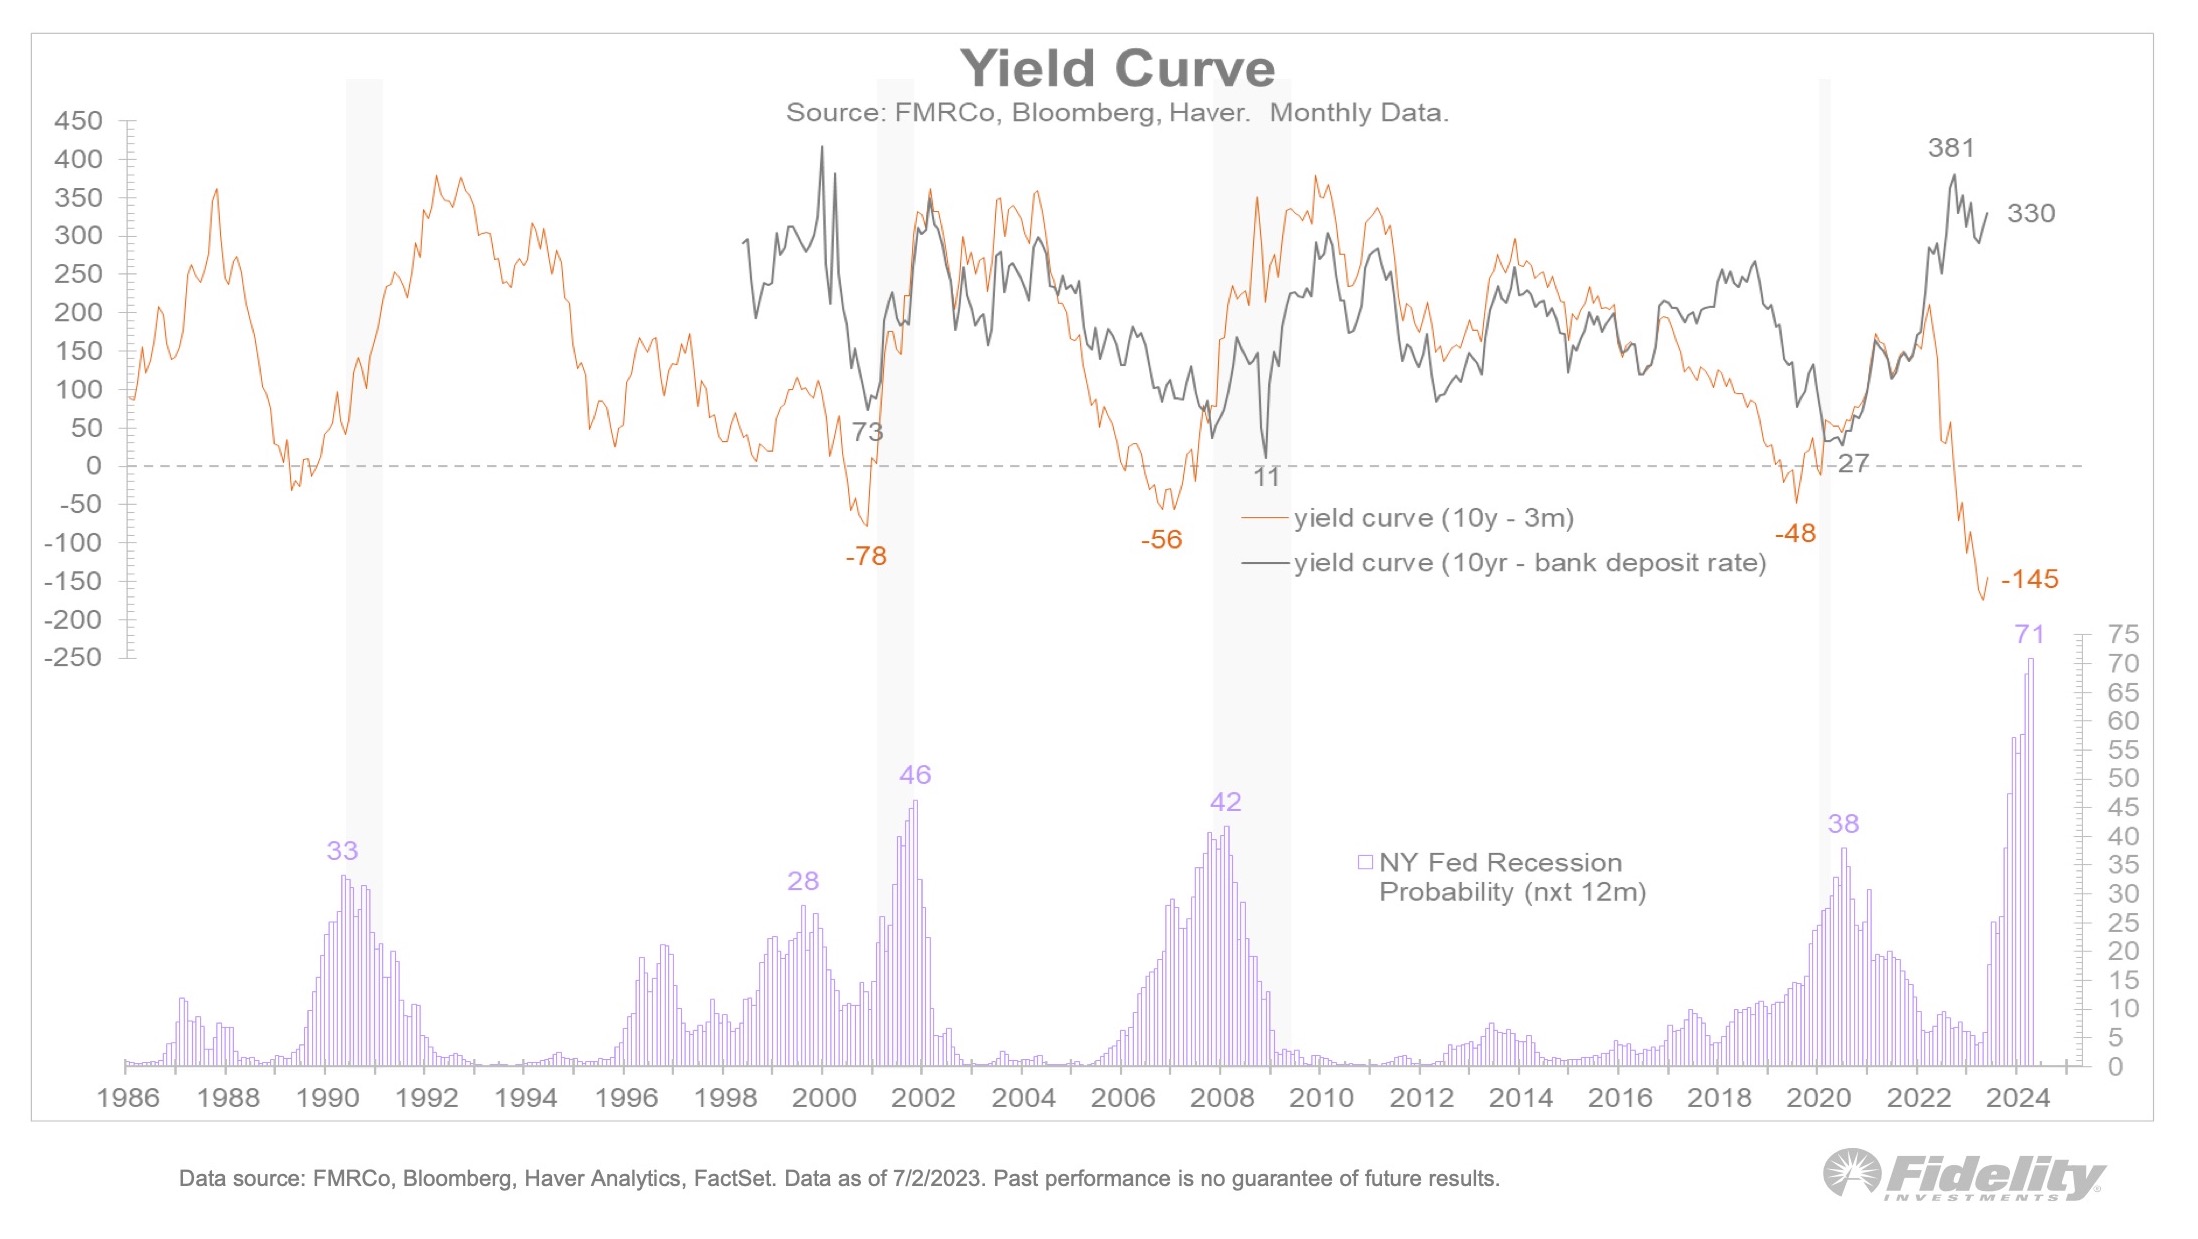
 U.S. yield curve, as of July 2, 2023. Source: Jurrien Timmer, Fidelity
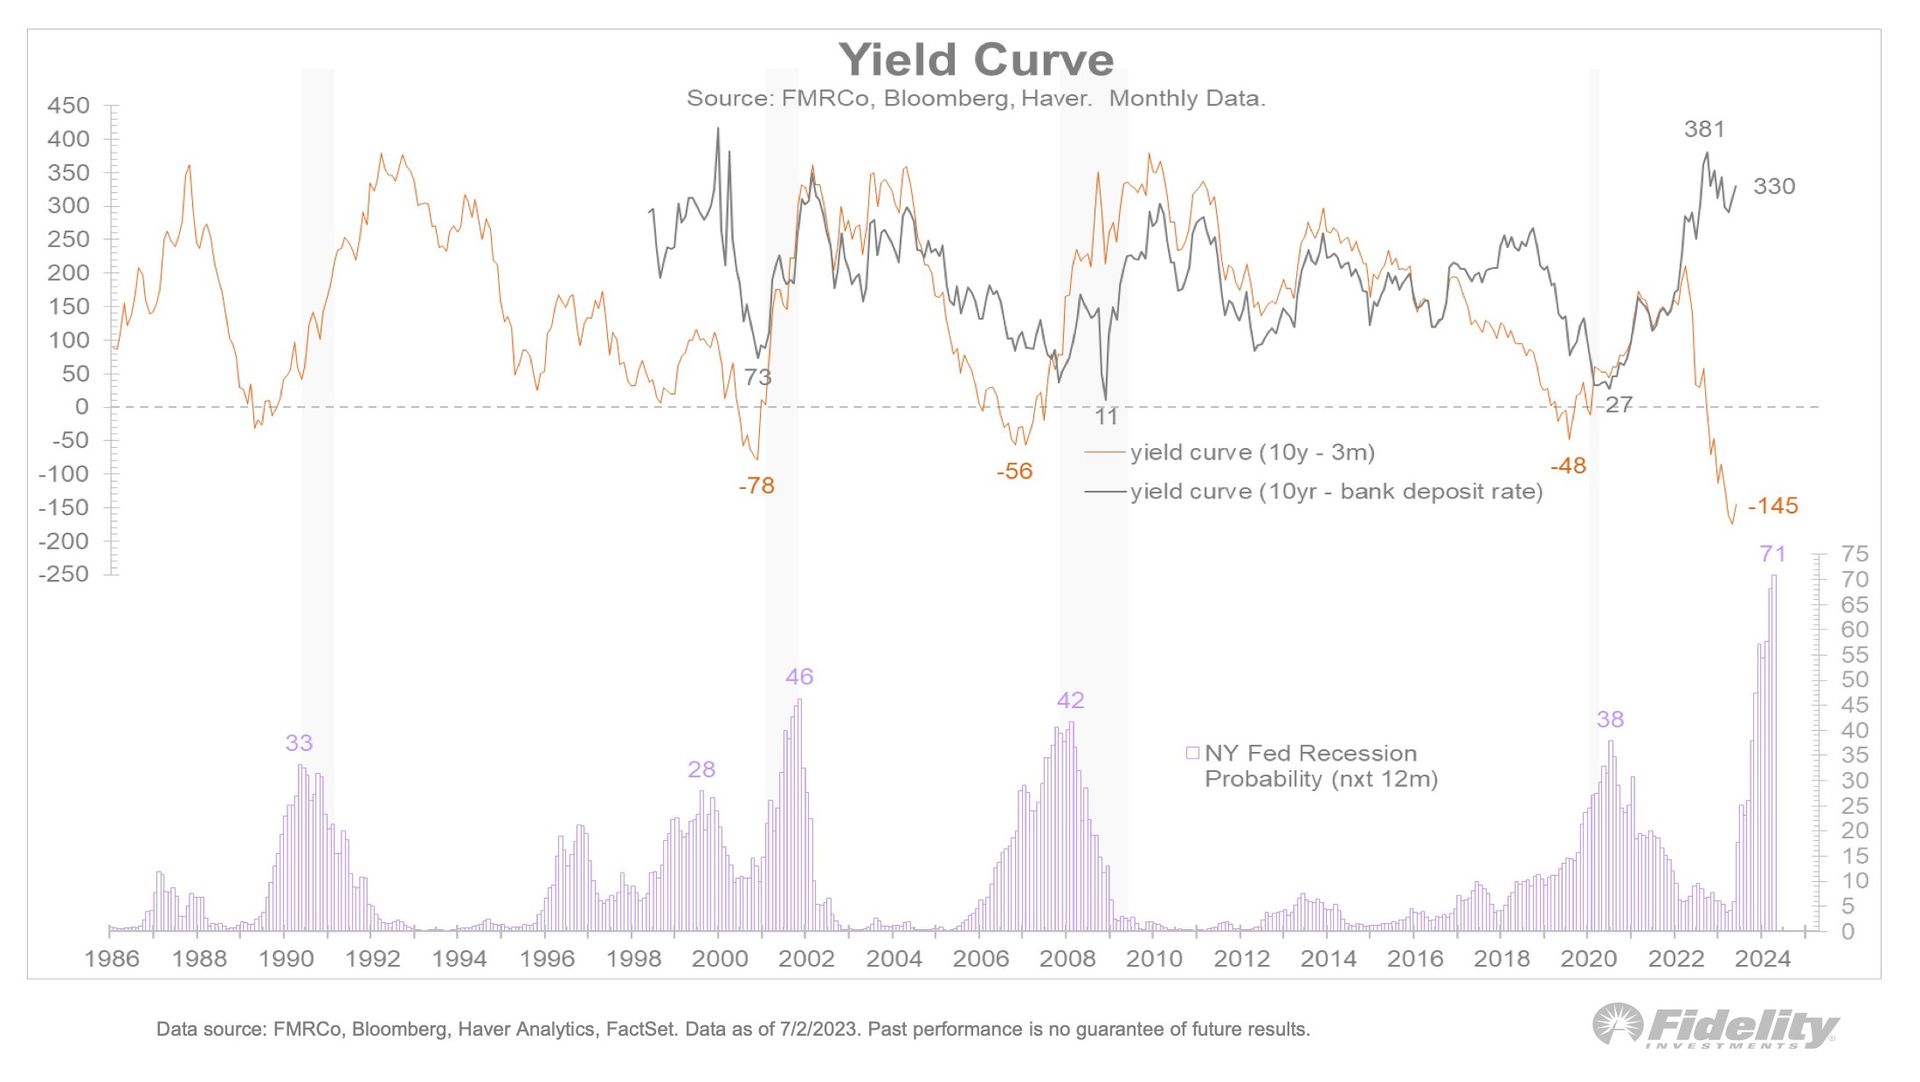
While the equity markets have been pulled up by just a few mega tech stocks for months now, however, the yield curve is increasingly screaming recession. In any case, however, the FED wants to keep withdrawing liquidity from the markets!
6.1 Surplus liquidity plus the “Bank Term Funding Program” have so far prevented worse
Only the surplus liquidity of the last 15 years, which has been wafting in the financial system, together with the hastily knitted rescue package in March (Bank Term Funding Program = BTFP) have so far presumably prevented worse. In any case, commodity prices have been rather weak for months, with the oil price in particular having corrected significantly since June 2022.
At the moment, however, oil looks like it has successfully bottomed out, so that there is hardly any further support coming from that side in combating inflation. At the same time, the BRICS+ countries are working on a new gold standard, while the war in Ukraine continues, escalating the East/West conflict, and unfortunately, the warmongers still hold sway on both sides.
Overall, this presents a very complex and less favorable macro dataset, which initially calls for caution or a defensive approach. Although stock markets tend to weaken in the summer and especially in September, we currently do not see any crash risks though.
6.2 Next stress case is foreseeable
However, we expect the stress caused by the brutal interest rate hikes and the restrictive stance of the US central bank to return to the markets later this year. Nevertheless, the FED will flip just as quickly as it did in March and announce new liquidity programs and rescue measures in no time because the Western financial system probably cannot withstand a multi-month, let alone multi-year bear market.
Currency will have to be created out of thin air again in some form. The main thing is to disguise and package it in a way that the public doesn’t smell a rat.
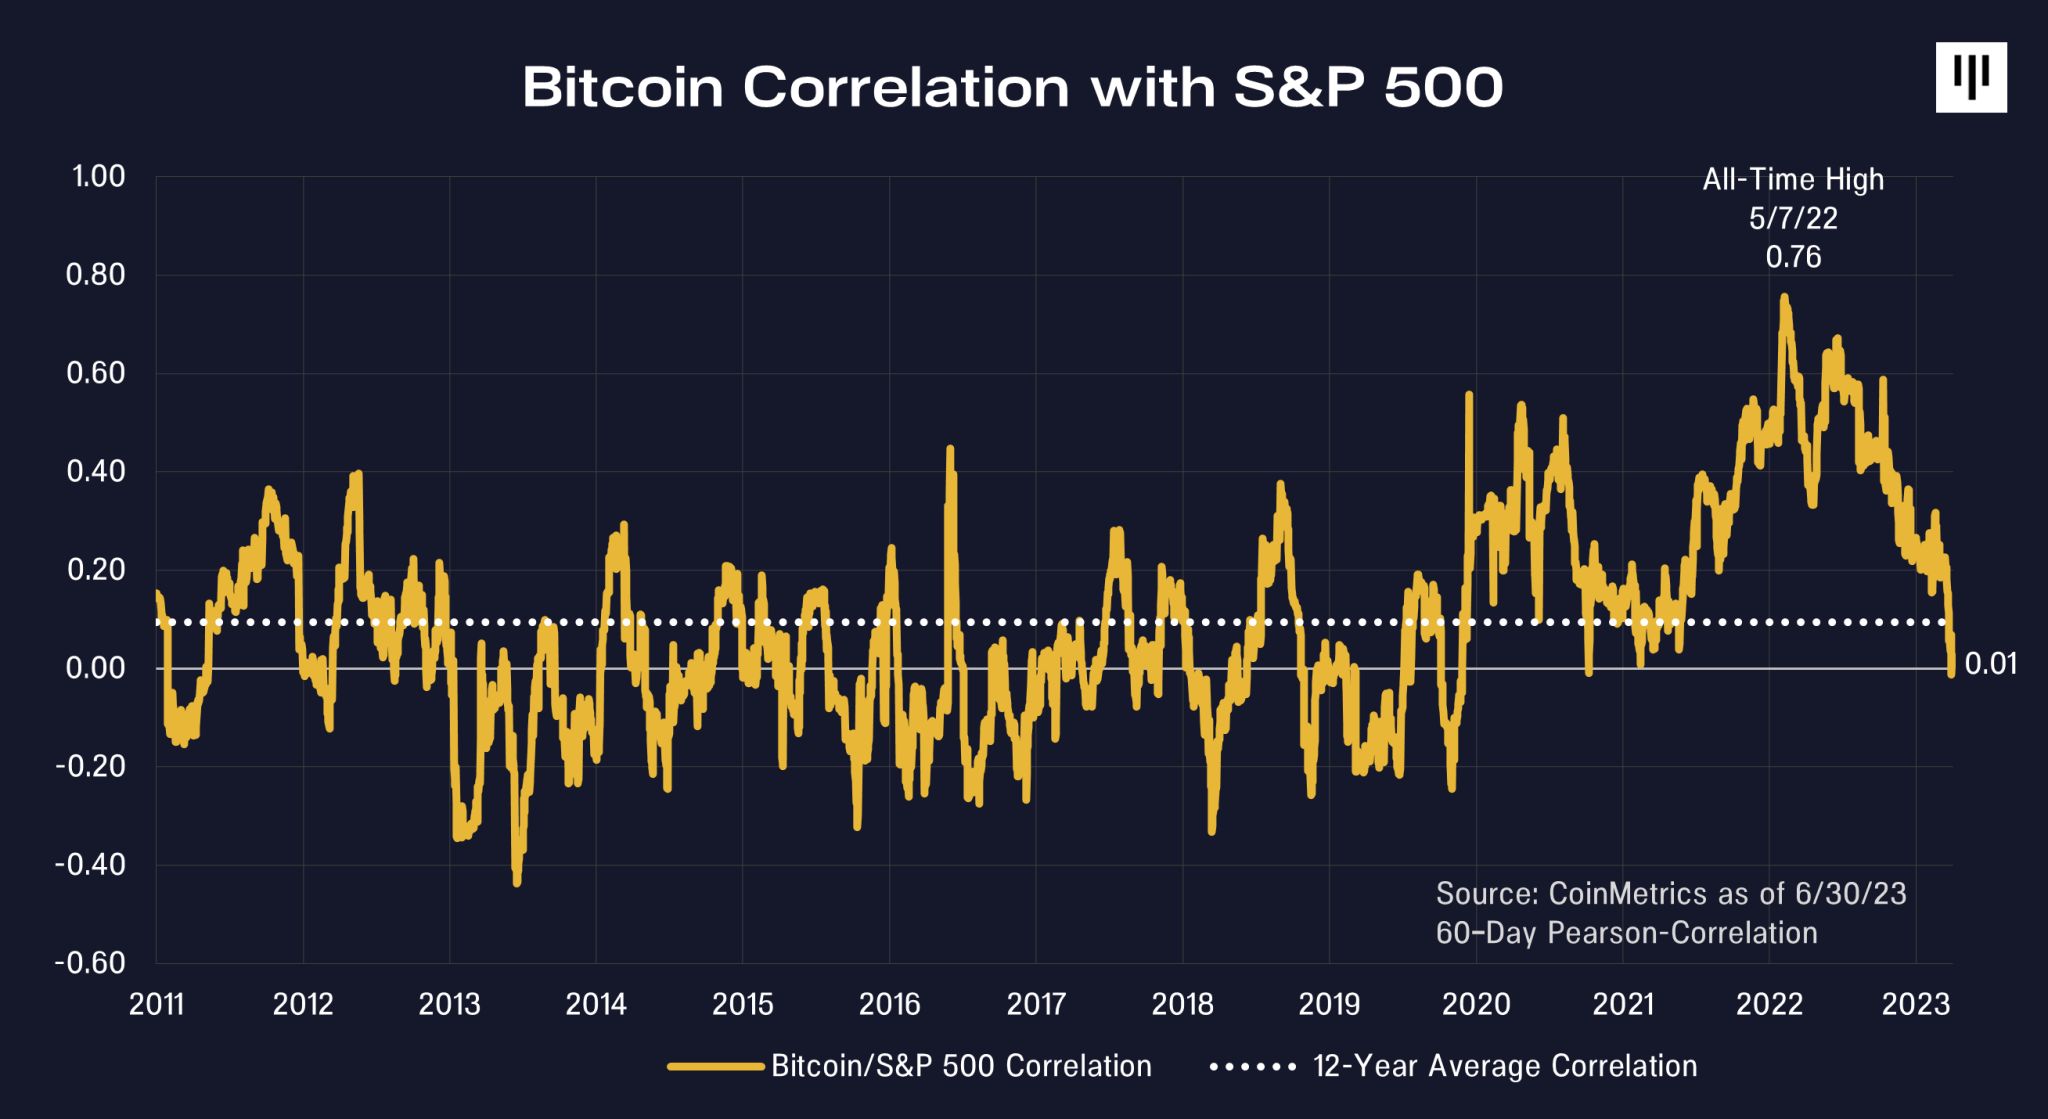
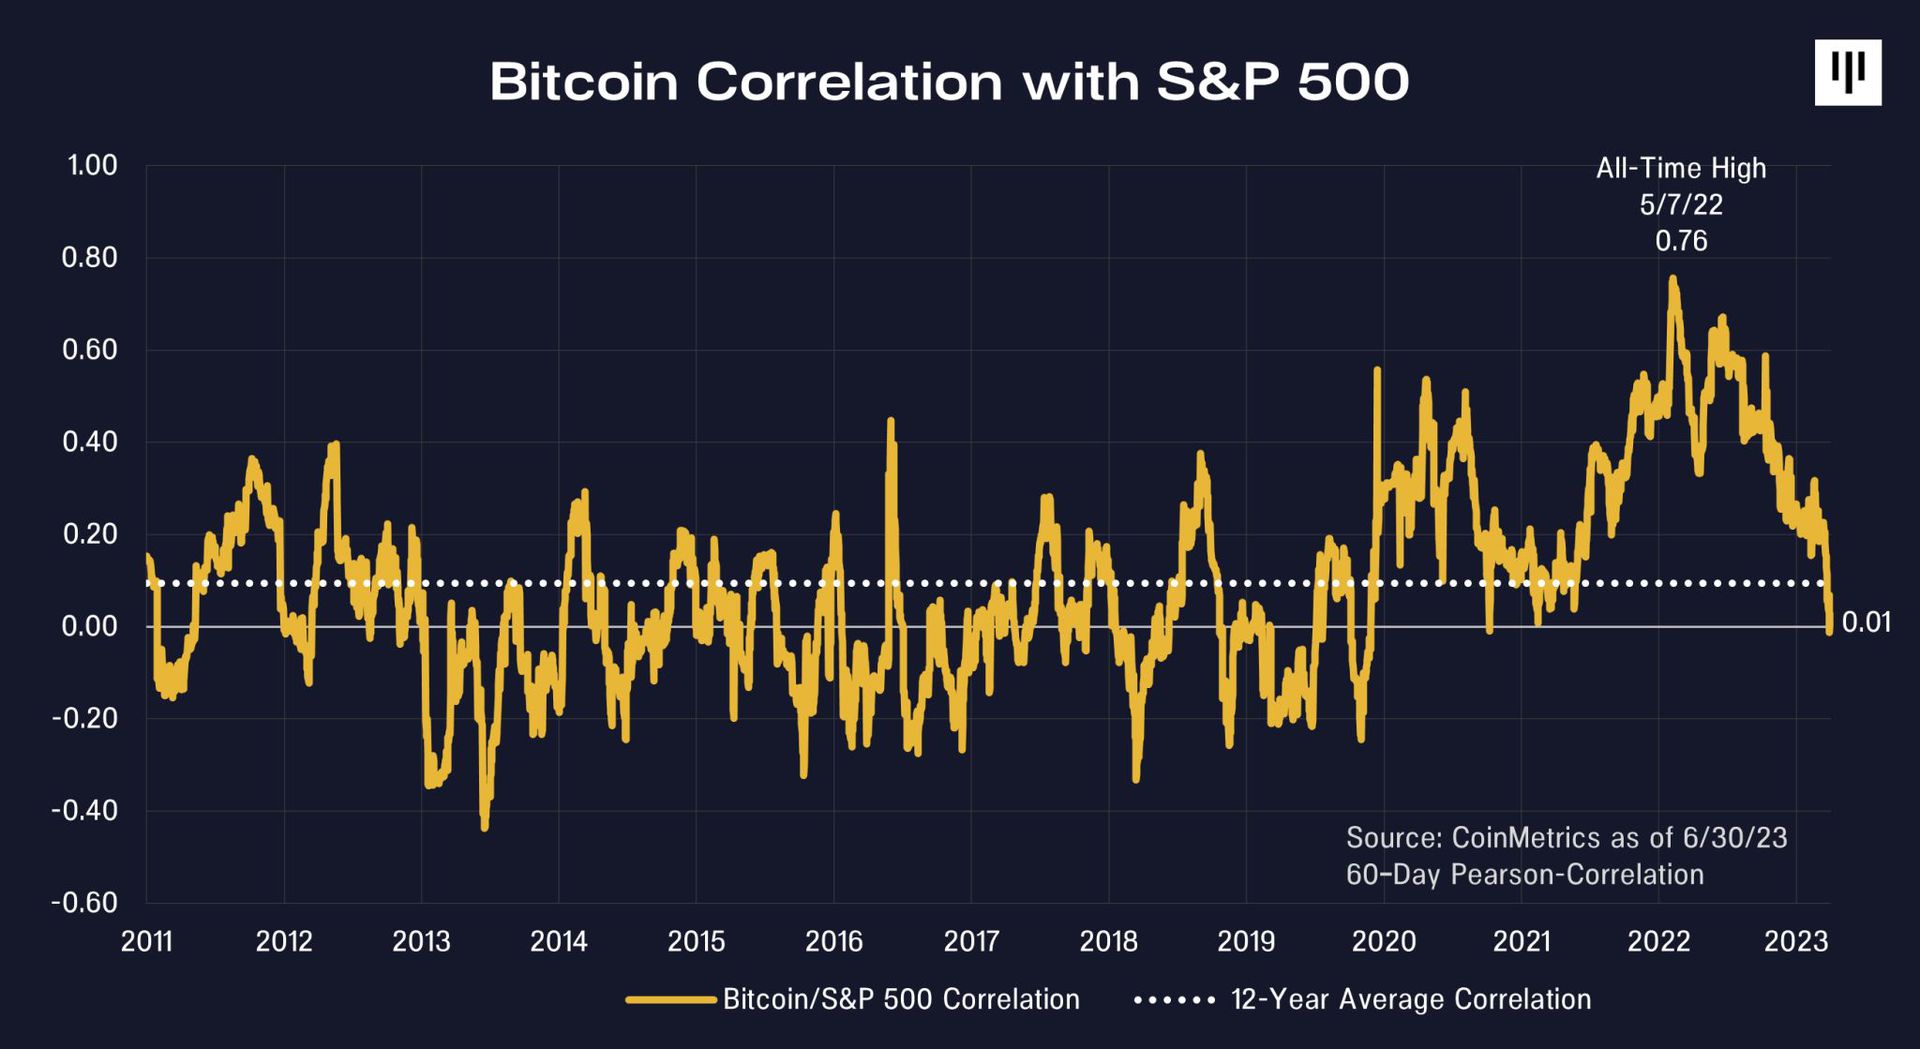 Bitcoin correlation with S&P500, as of June 30th, 2023. Source: Dan Morehead, Pantera Capital
Those who want to protect themselves and their wealth from this irresponsible monetary policy must turn to precious metals and Bitcoin. So far this year, Bitcoin has outperformed all other investments, defying the rise in real interest rates. The potential spot ETF from BlackRock has recently fueled new excitement in the crypto sector. Additionally, the correlation between Bitcoin and the stock market (S&P 500) has dropped to zero. Since a blockchain is not linked to interest rates, it should also exhibit very low correlation with major asset classes such as stocks, bonds, and real estate, which are all heavily influenced by interest rates.
Overall, the macro environment for Bitcoin is extremely favorable in the medium to long term. In the coming months, any stress in the financial system could temporarily put Bitcoin prices under pressure once again.
7. Conclusion: Bitcoin – Breakout to the upside is most likely
After trading sideways at high levels for the past three weeks, we must consider a forthcoming upward breakout from a technical perspective. A potential “Bollinger Band Squeeze” could rapidly propel prices towards USD 35,000. Our target range for this year remains at USD 45,000 to USD 50,000. Currently, we anticipate a significant pullback only after reaching this region, which may also extend over a period of time.
Despite the macroeconomic outlook and the typical summer lethargy providing reasons for skepticism and restraint, we remain cautiously optimistic and expect that the financial markets will soon begin pricing in an interest rate cut by the FED. As financial markets usually look six to eight months ahead, the much-discussed “FED pivot” could become a reality by the end of this year or in the first quarter of 2024.
Disclosure: This article and the content are for informational purposes only and do not contain investment advice or recommendations. Every investment and trading move involves risk, and readers should conduct their own research when making a decision. The views, thoughts, and opinions expressed here are the author’s alone. They do not necessarily reflect or represent the views and opinions of Midas Touch Consulting.